
Downwards movement continued this week exactly as expected.
Summary: The target for a new low remains at 13.39. A new low on the way down, below 55.24, would add substantial confidence in a bearish outlook. At least for the short term classic technical analysis expects downwards movement for another week or so.
A new high above 66.65 would substantially reduce the probability of the bearish wave count and increase the probability of a huge new bull market for Oil, which would have final confidence above 74.96.
Always practice good risk management as the most important aspect of trading. Always trade with stops and invest only 1-5% of equity on any one trade. Failure to manage risk is the most common mistake new traders make.
New updates to this analysis are in bold.
MAIN WAVE COUNT
MONTHLY CHART
Click chart to enlarge.
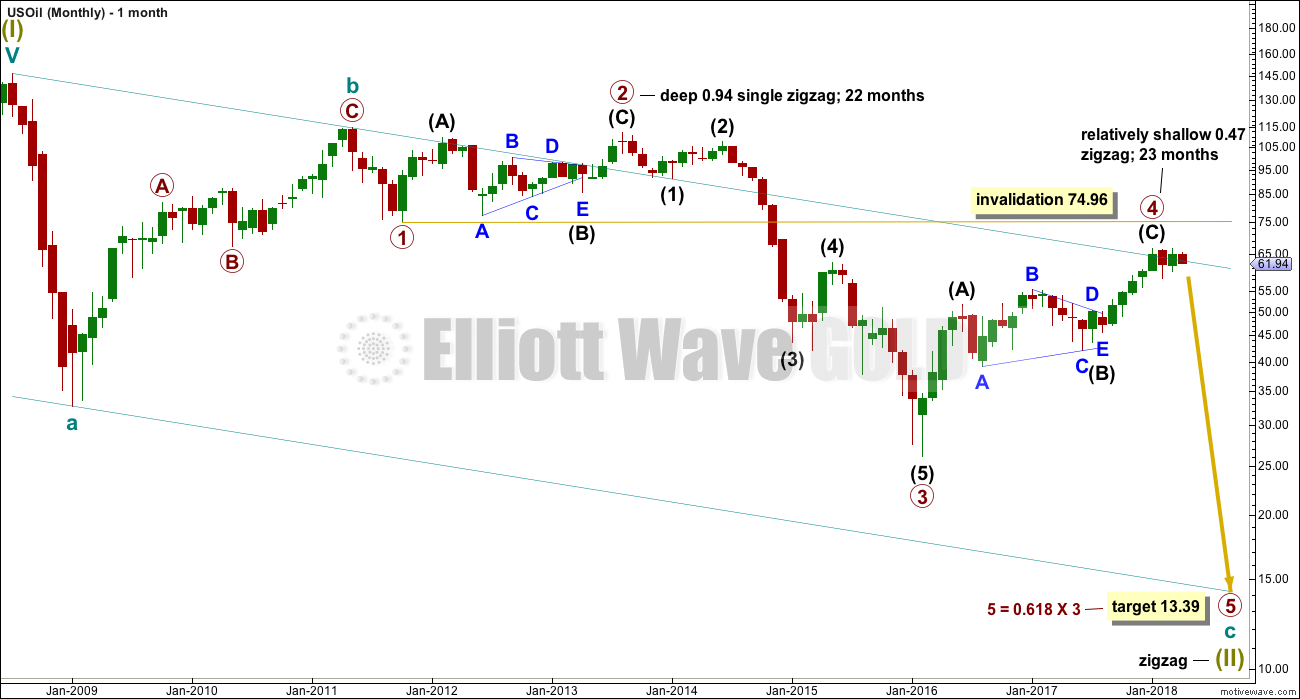
Within the bear market, cycle wave b is seen as ending in May 2011. Thereafter, a five wave structure downwards for cycle wave c begins.
Primary wave 1 is a short impulse lasting five months. Primary wave 2 is a very deep 0.94 zigzag lasting 22 months. Primary wave 3 is a complete impulse with no Fibonacci ratio to primary wave 1. It lasted 30 months.
There is alternation in depth with primary wave 2 very deep and primary wave 4 relatively shallow. There is inadequate alternation in structure, both are zigzags. So far primary wave 4 has lasted 23 months. At this stage, there is almost perfect proportion between primary waves 2 and 4.
Primary wave 4 may not move into primary wave 1 price territory above 74.96.
The wider Elliott channel (teal) about this whole movement may offer support to primary wave 5.
WEEKLY CHART
Click chart to enlarge.
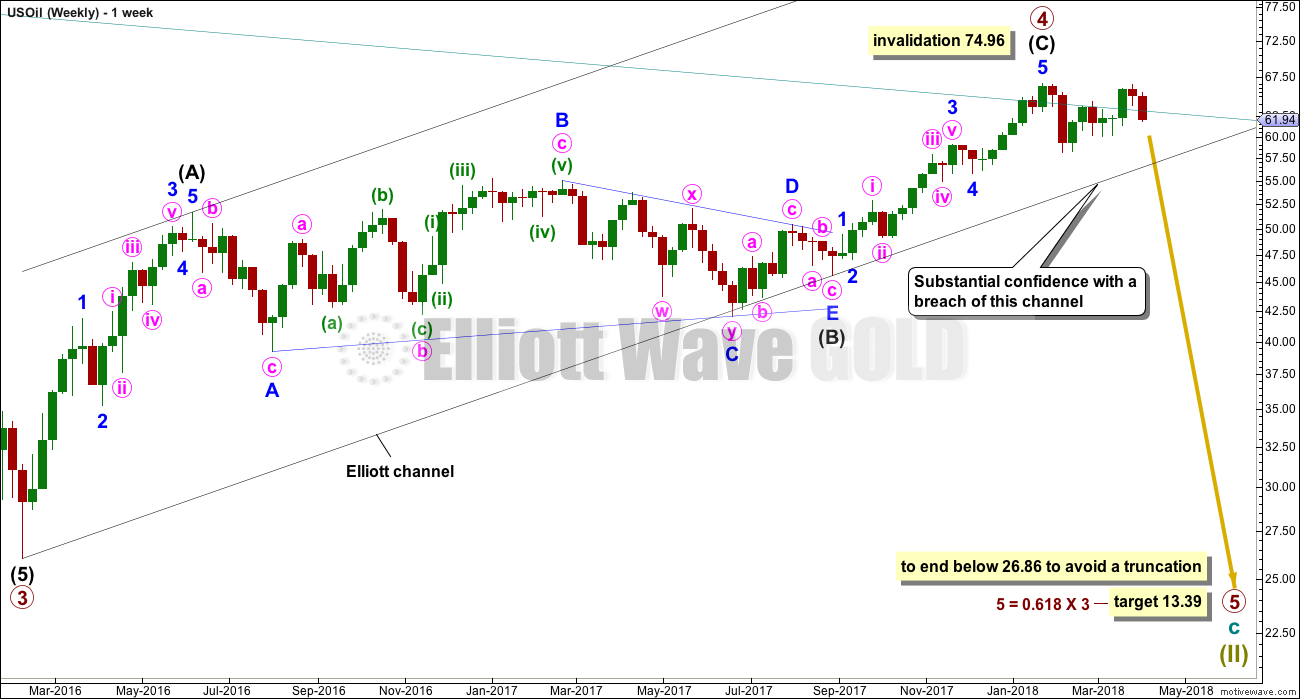
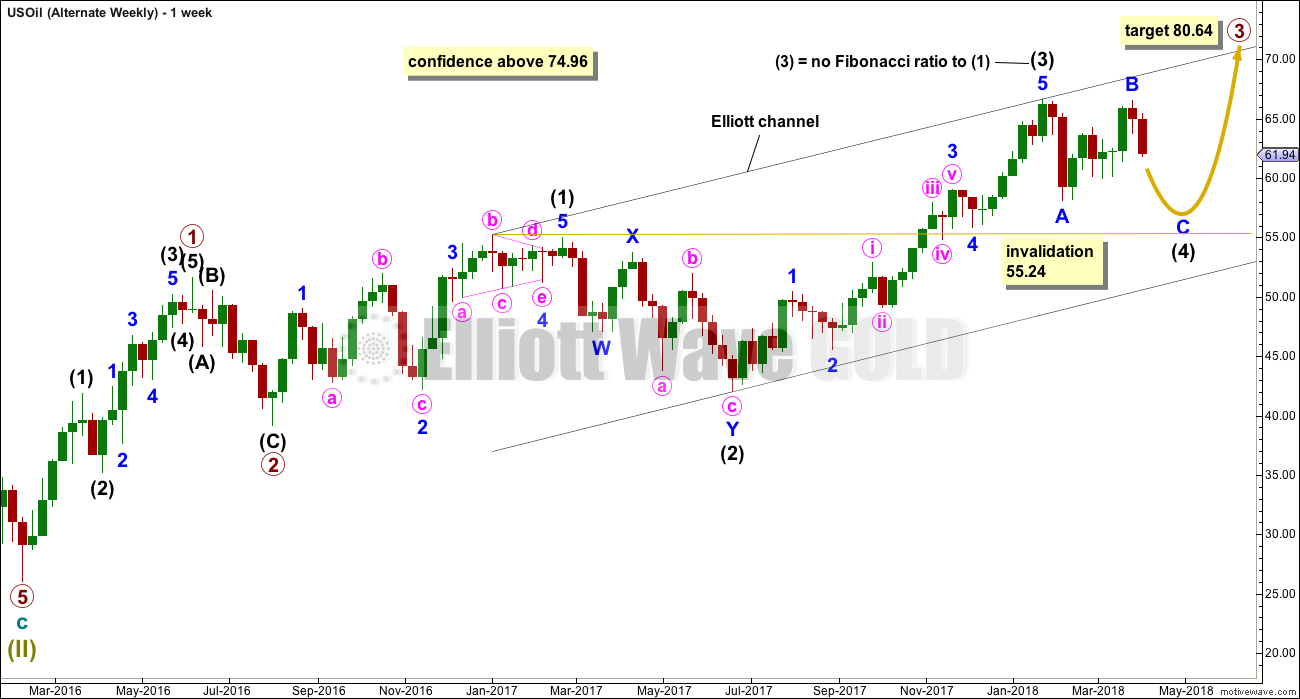
Primary wave 4 subdivides as a zigzag, and for this wave count it should now be complete. There is almost no room for it to move into. If primary wave 5 were to only reach equality in length with primary wave 3, it would end with a small truncation. A target for primary wave 5 may best be calculated at intermediate degree. That can only be done when intermediate waves (1) through to (4) within primary wave 5 are complete.
For now a target will be calculated at primary degree using a ratio between primary waves 3 and 5. This target only has a small probability. This target will be recalculated as primary wave 5 nears its end, so it may change.
An Elliott channel is added to this possible zigzag for primary wave 4. A breach of the lower edge of this channel would provide a very strong indication that primary wave 4 should be over and primary wave 5 should be underway. Look out for some support on the way down, perhaps a short term bounce about the lower edge of the channel.
DAILY CHART
Click chart to enlarge.
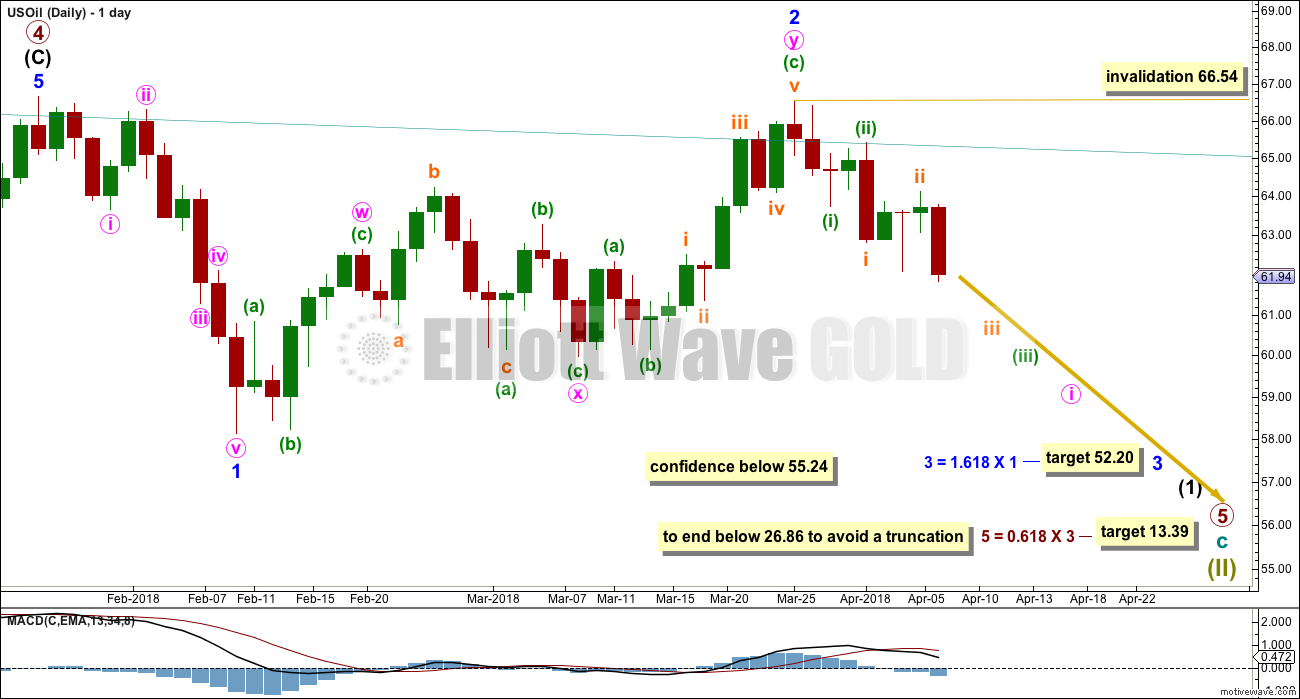
Minor wave 1 will subdivide as a complete impulse at lower time frames.
Minor wave 2 should now be a complete structure. It subdivides well as a double zigzag.
A target is calculated for minor wave 3 which expects the most common Fibonacci ratio to minor wave 1. If price reaches down to this target and the structure is incomplete or price keeps falling through it, then the next Fibonacci ratio in the sequence of 2.618 would be used to calculate a new target.
Within minor wave 3, no second wave correction may move beyond the start of its first wave above 66.54.
There may now be two overlapping first and second waves complete within minute wave i. This expects to see an increase in downwards momentum next week.
A new low below 55.24 would invalidate the bullish alternate below and provide reasonable confidence in this main wave count.
ALTERNATE WAVE COUNT
MONTHLY CHART
Click chart to enlarge.
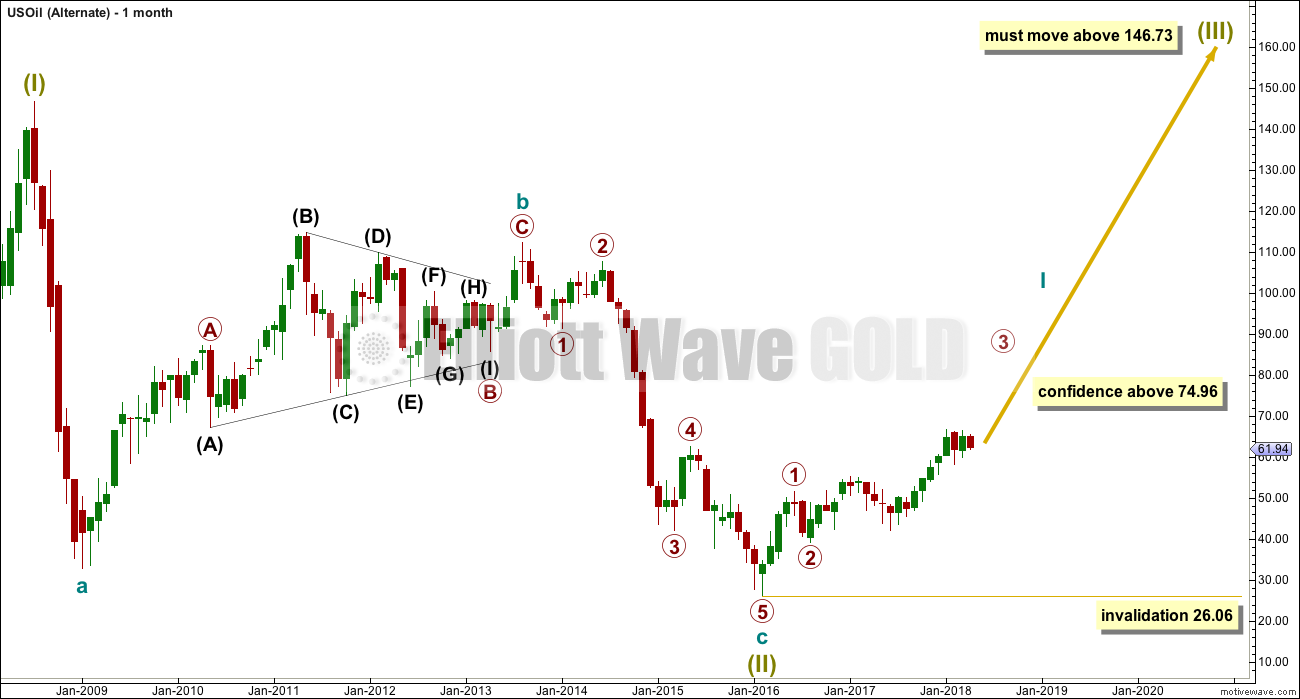
It is possible that the bear market for Oil is over and a new bull market is in the very early stages.
A huge zigzag down to the last low may be complete and is labelled here Super Cycle wave (II).
Cycle wave b must be seen as complete in August 2013 for this wave count to work. It cannot be seen as complete at the prior major swing high in May 2011.
Cycle wave b is seen as a zigzag, and within it primary wave B is seen as a running contracting triangle. These are fairly common structures, although nine wave triangles are uncommon. All subdivisions fit.
Primary wave C moves beyond the end of primary wave A, so it avoids a truncation. But it does not have to move above the price territory of primary wave B to avoid a truncation, which is an important distinction.
If cycle wave b begins there, then cycle wave c may be seen as a complete five wave impulse.
Super Cycle wave (III) must move beyond the end of Super Cycle wave (I). It must move far enough above that point to allow room for a subsequent Super Cycle wave (IV) to unfold and remain above Super Cycle wave (I) price territory.
WEEKLY CHART
Click chart to enlarge.
If a new bull market is in the very early stages for Oil, then it may have begun with two overlapping first and second waves at primary then at intermediate degree.
Primary wave 3 may only subdivide as an impulse, and within it intermediate wave (3) may be complete.
Intermediate wave (4) may not move into intermediate wave (1) price territory below 55.24. Intermediate wave (4) would most likely be incomplete. It may continue further sideways or lower.
Intermediate wave (2) is labelled as a double zigzag. To exhibit alternation intermediate wave (4) may most likely be a flat, combination or triangle. Intermediate wave (2) lasted 17 weeks. For good proportion and the right look, intermediate wave (4) may last a Fibonacci 13 or even 21 weeks in total. So far it has lasted only ten weeks.
DAILY CHART
Click chart to enlarge.
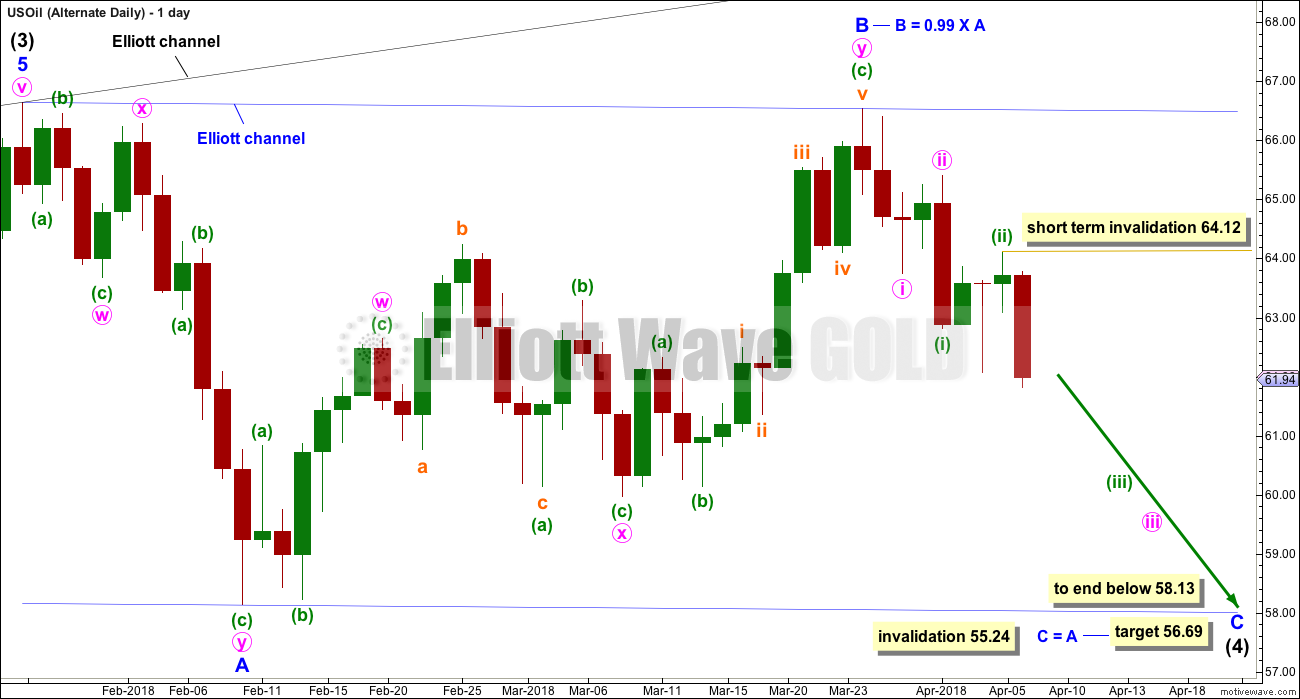
It would be unlikely that intermediate wave (4) would be over a the last low labelled minor wave A. That would be too brief.
If intermediate wave (4) is continuing, then it may be as a flat correction. If minor wave B is now over at 0.99 the length of minor wave A, then intermediate wave (4) may be a regular flat correction. Regular flats normally fit nicely into trend channels. The most likely Fibonacci ratio for minor wave C would be equality in length with minor wave A.
Minor wave C downwards must be a five wave structure.
Within minor wave C, two overlapping first and second waves may now be complete. This wave count also expects to see some increase in downwards momentum next week as the middle of a third wave down unfolds. Within the middle of the third wave, no second wave correction may move beyond its start above 64.12.
TECHNICAL ANALYSIS
MONTHLY CHART
Click chart to enlarge. Chart courtesy of StockCharts.com.
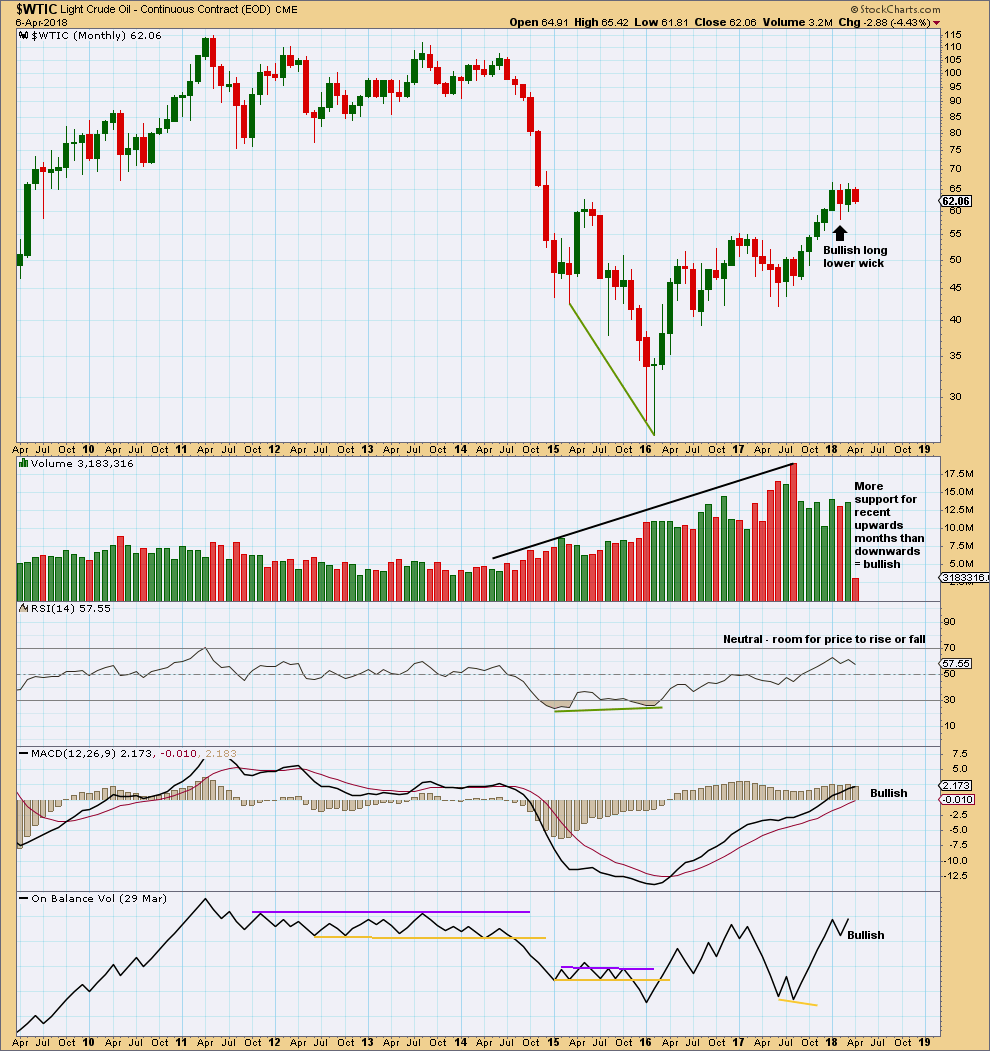
The strongest recent monthly volume is for the downwards month of August 2017. This is bearish.
For the last three months all now complete, the volume profile is bullish.
This chart is overwhelmingly bullish. It supports the alternate Elliott wave count.
DAILY CHART
Click chart to enlarge. Chart courtesy of StockCharts.com.
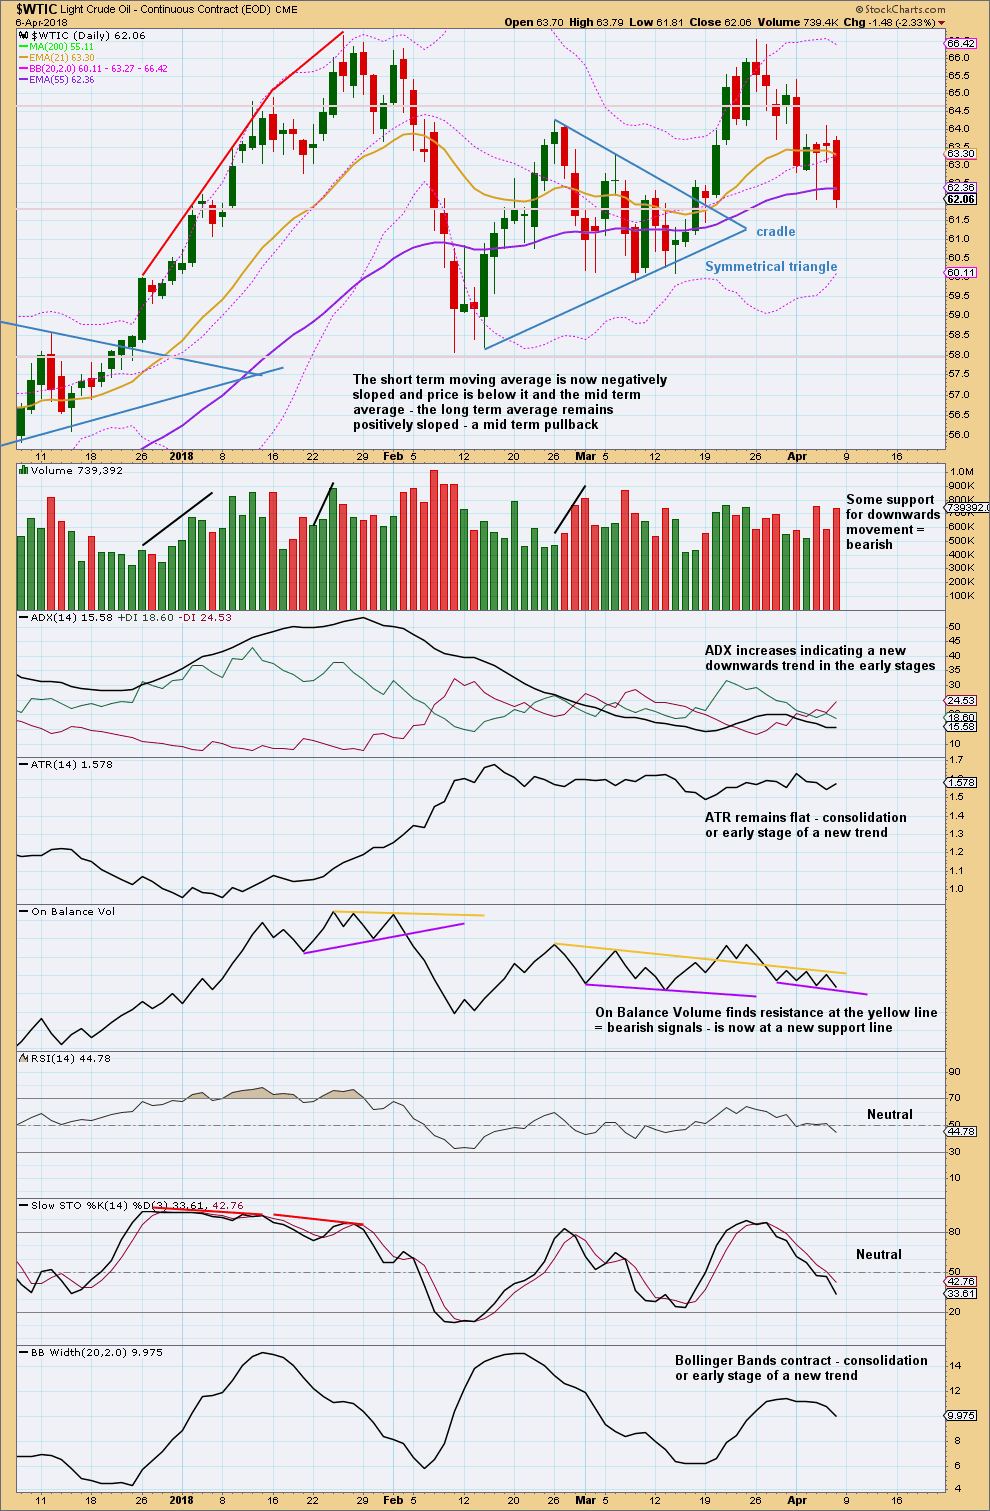
Oil is at support here about 61.85. The strong bearish candlestick for Friday along with support from volume indicates more downwards movement next week. This supports the short term expectation for both Elliott wave counts.
Watch On Balance Volume carefully next week. A breakout from the new small range would provide a signal.
Oil and $OVX Volatility Index currently have a positive correlation. There is a view within the trading community that they should have a negative correlation, and that any divergence may be a signal. At this time, that relationship is absent and $OVX is not providing signals, so it will not be used in this analysis at this time.
Published @ 10:10 p.m. EST on 8th April, 2018.
Thank you Lara for the updates below… very helpful to navigate this market!
Although I got stopped out today, I do think the expanded flat B wave is in play… we will soon find out… if this a third wave up after two series of 1-2 waves, we should be going higher from here.
Piercing the bollinger bands however, I doubt there’s much upside movement… same thing with gold and GDX. A correction in both markets is due at this time, unless a war breaks out in the Middle East 🙁
You’re welcome Ari.
Let’s see what the next session gives us and how the week closes…
Yes, Thank you for your updates Lara. I don’t always comment as I’m absorbing the information. Saw the video smart and gorgeous, we’re blessed.
Ari, Best of Luck to you as well! I appreciate reading your comments.
LOL Thanks for that Plinker. It’s always nerve wracking to put my actual face out there…. trying this morning to not get all down about a few thumbs down over on the YT channel. What? People don’t like my face? Must be the Elliott wave…
Bots. Or competitors. I hate to ask (I feel like the trouble kid in the class) but I am a bit confused as I just signed signed up. Is this service in the video different than what I have now? Did I sign up under an old plan or something? or am I just losing the weekly s&p update? Thank you!
It’s different and yeah, sorry, you’ll lose the one a week S&P update.
It’s been public for a few weeks to promote it, now it’s going to be a new paid analysis service.
You’ve signed up for daily analysis of Gold, with once a week Oil and Silver.
That’s designed for day traders who want hourly charts and focus on smaller movements. Which is most of this membership.
The new service is once a week only, only down to daily charts (no hourly charts) of the S&P, Gold and US Oil. It’s designed for investors and traders with a longer time horizon. It avoids looking at smaller hourly movements so that it focuses on the bigger picture.
Classic TA updated:
This chart is now overly bullish. But there is one concern (not noted on the chart):
Price has just today made a new high above the prior high of the 25th of January. But On Balance Volume has not made a corresponding new high.
This indicates weakness in price and may point to this upwards thrust being a B wave, as per the alternate daily chart posted below.
Alternate daily chart updated:
Remember, classic TA at the monthly chart level does favour this idea.
Perversely this upwards thrust, while fairly bullish for the main count, is not so bullish for this alternate count. The bullish count. If that all makes sense?
An expanded flat may be completing for intermediate (4). These are very common structures. Wave B moves beyond the start of wave A to make a new price extreme, then wave C moves below the end of wave A. Expanded flats are equivalent to a range bound consolidation period which moves sideways in an increasing range, with overshoots of resistance and support before the final breakout.
Updated daily chart:
For the main count there isn’t much room to move into for Oil.
If intermediate 4 is continuing then it should be within minor 5. So far minor 5 won’t fit as a diagonal (the overlapping suggests it) because the wave lengths wouldn’t work. So the only other structure is an impulse.
If minor 5 is an impulse then it has now begun with two overlapping first and second waves. The last 3 days of strong upwards movement may be the start of a strong third wave.
This conclusion is fairly bullish.
At the daily chart level the main count is now invalid.
It remains possible that at the weekly and monthly chart level primary 4 could be ending soon a bit higher.
But for that possibility to be valid I have to see if there could be an EW count for it. I’m working on it.
ALSO
The alternate is also valid. Oil is at a major decision point. That alternate needs a new high above 74.96 for good confidence.
Lara, how do you see the wave count after oil price action today? There was a very deep correction up to 65.85… I entered short at the highs of today, since invalidation is so very close, I thought it was a good risk/reward.
But this deep correction must be a minute ii of both the bullish and bearish wave counts?
As always, thanks for the analysis! It’s taken a lot of patience waiting for oil to play out… but I think I entered short at the right time, but ready to close my position above 66.65.
So much for that scenario. Got stopped out 🙂
I feel your pain. I’m having faith and holding on as it hasn’t violated the 66.54 WTI Cash price yet. Oil up, Gold up but I don’t think any of these price moves have violated Lara’s chart’s. Yet. Even one of my most trusted sources just put out a bull on gold with price counts. I’m hoping he’s just early and we’re just dragging out the dip. Who knows?
Well oil is at the upper bollinger band, and it did have a longer upper wick. Brent more so than WTI, but there is a chance it can turn around here. With a big inventory build not pushing price down, I’m skeptical about a turnaround here.
Best of luck!