
Another new low was expected. This is so far what is happening.
The bigger picture is updated today with a new weekly wave count.
Summary: In the first instance, look now for support at the black (2)-(4) trend line on the first weekly chart (zigzag). The target for this wave count is still above 1,398.41.
If price continues lower here and prints a full candlestick below that line, then the next weekly chart (triangle) will be preferred and the target would be 1,216 – 1,211.
While the situation is unclear (this is common for B waves), the classic technical analysis is now more bearish as prior divergence between price and Stochastics has all but disappeared today. Members may like to consider hedging about here.
Always trade with stops to protect your account. Risk only 1-5% of equity on any one trade.
New updates to this analysis are in bold.
Grand SuperCycle analysis is here.
There are multiple wave counts at this time at the weekly and monthly chart levels. In order to make this analysis manageable and accessible only two will be published on a daily basis, one bullish and one bearish. This does not mean the other possibilities may not be correct, only that publication of them all each day is too much to digest. At this stage, they do not diverge from the two possibilities below.
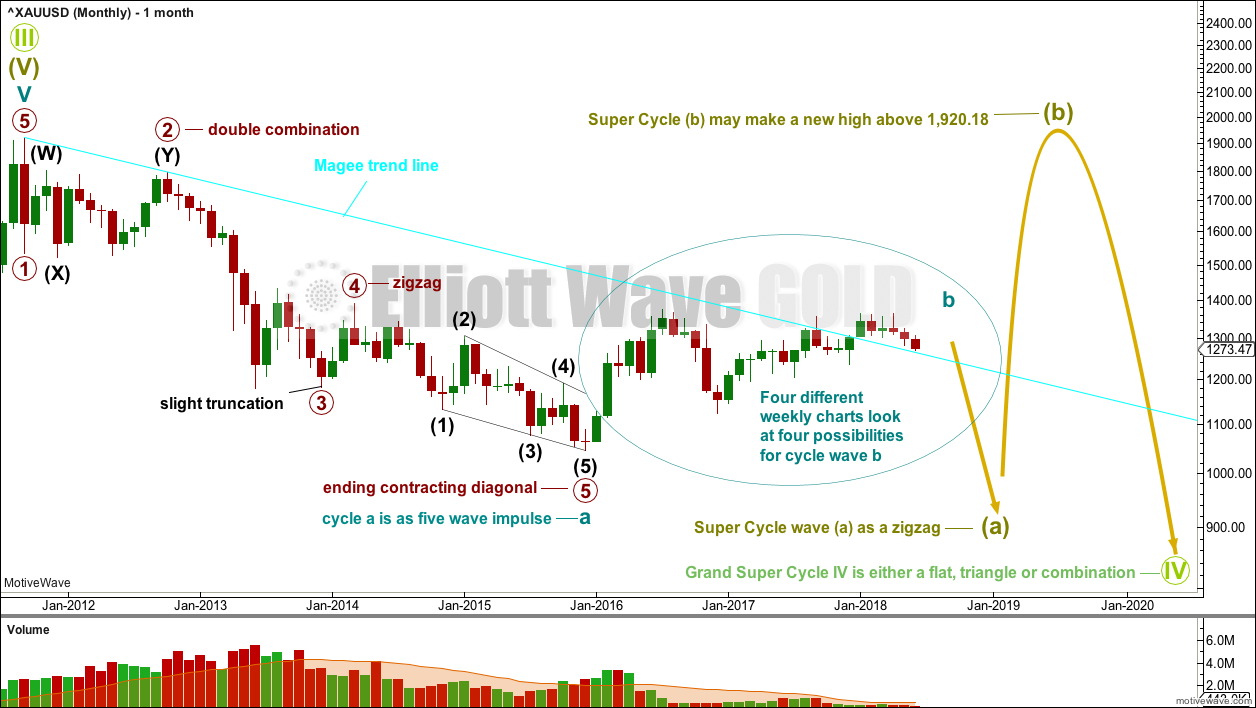
MAIN ELLIOTT WAVE COUNT
MONTHLY CHART
Click chart to enlarge.
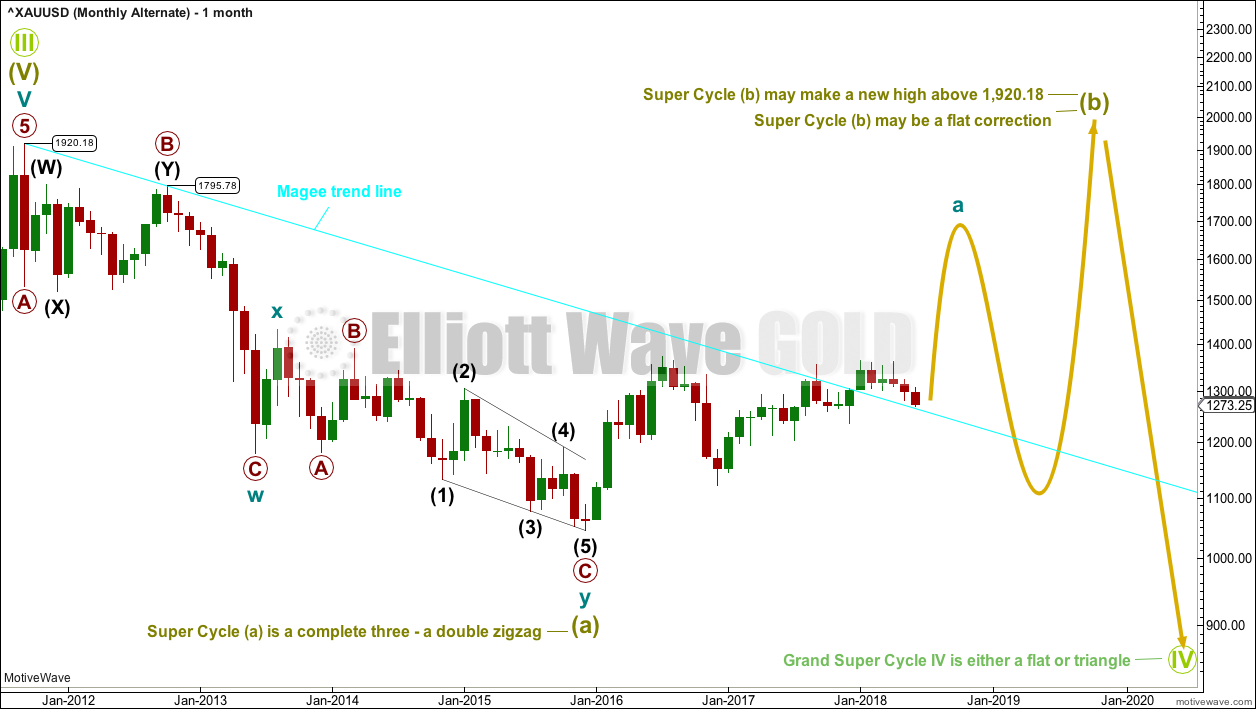
The main wave count will look at the large downwards wave from the all time high as a five wave impulse. For this main wave count, it will be labelled as cycle wave a, within a zigzag for Super Cycle wave (a).
It is also possible to move the degree of labelling up one degree and see this as a five wave structure complete for Super Cycle wave (a).
Both degrees of labelling would be valid, but in the interests of keeping charts and ideas to a manageable level only one shall be published at this stage. The difference will not be material for at least a year and probably more.
If cycle wave a is a five, then cycle wave b may not move beyond its start above 1,920.18.
Cycle wave b may be any one of more than 23 possible corrective structures. Four different ideas for cycle wave b will be considered this week on weekly charts: a zigzag, triangle, flat and a combination.
When cycle wave b is complete, then cycle wave c downwards should unfold. Cycle wave c would most likely reach about equality in length with cycle wave a.
If this wave count unfolds as expected, then a huge zigzag downwards may be complete when cycle wave c completes. That would then be expected to be followed by a huge three wave structure upwards, most likely another zigzag for Super Cycle wave (b), which may make a new all time high.
The larger structure for Grand Super Cycle wave (IV) would be starting out with a huge zigzag downwards, indicating either a flat, triangle or combination.
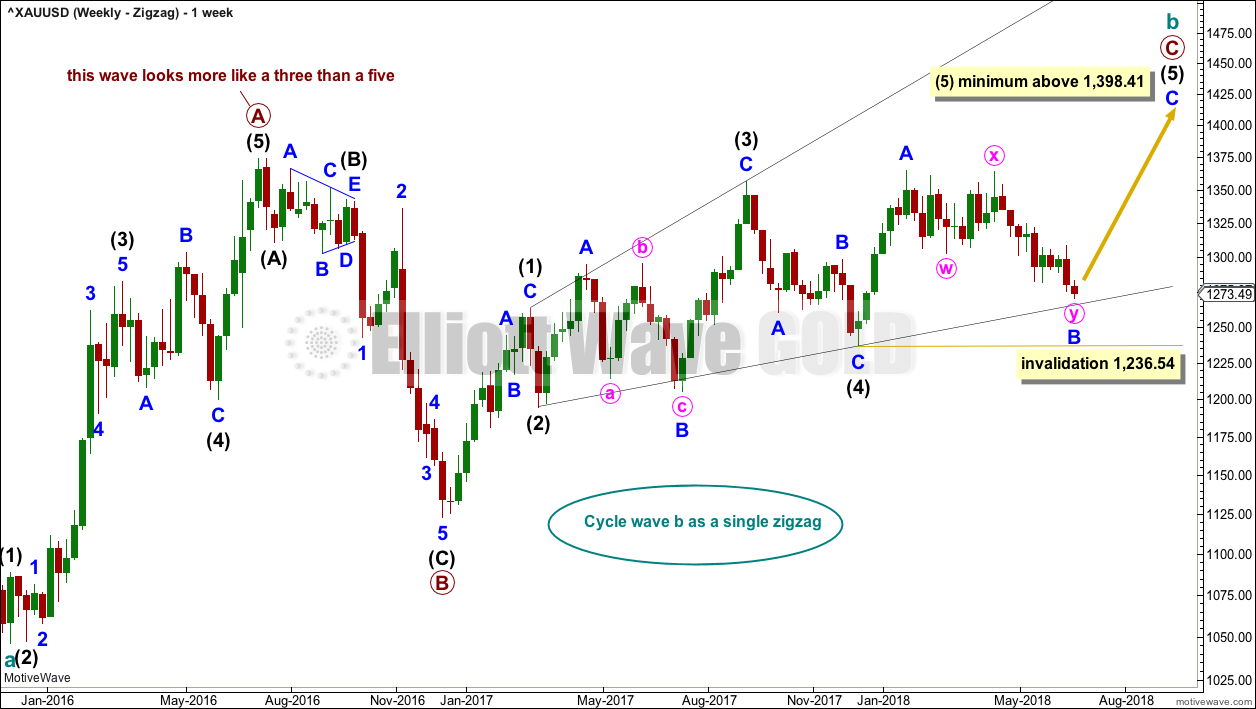
WEEKLY CHART – ZIGZAG
Click chart to enlarge.
Cycle wave b may be a single zigzag. Zigzags subdivide 5-3-5. Primary wave C must subdivide as a five wave structure and may be either an impulse or an ending diagonal. Overlapping at this stage indicates an ending diagonal.
Within an ending diagonal, all sub-waves must subdivide as zigzags. Intermediate wave (4) must overlap into intermediate wave (1) price territory. This diagonal is expanding: intermediate wave (3) is longer than intermediate wave (1) and intermediate wave (4) is longer than intermediate wave (2). Intermediate wave (5) must be longer than intermediate wave (3), so it must end above 1,398.41 where it would reach equality in length with intermediate wave (3).
Within the final zigzag of intermediate wave (5), minor wave B may not move beyond the start of minor wave A below 1,236.54. However, if it were now to turn out to be relatively deep, it should not get too close to this invalidation point as the lower (2)-(4) trend line should provide strong support. Diagonals normally adhere very well to their trend lines. If the (2)-(4) trend line is breached by a full daily candlestick below and not touching it, then this wave count will be discarded in favour of the triangle weekly wave count.
Within the diagonal of primary wave C, each sub-wave is extending in price and so may also do so in time. Within each zigzag, minor wave B may exhibit alternation in structure and may show an increased duration.
Within intermediate wave (1), minor wave B was a triangle lasting 11 days. Within intermediate wave (3), minor wave B was a regular flat lasting 60 days. Intermediate wave (5) is expected to be longer in price than intermediate wave (3), and it may also be longer in duration, and so minor wave B within it may also be longer in duration.
This first weekly chart sees the upwards wave labelled primary wave A as a five wave structure. It must be acknowledged that this upwards wave looks better as a three than it does as a five. The fifth weekly chart below will consider the possibility that it was a three.
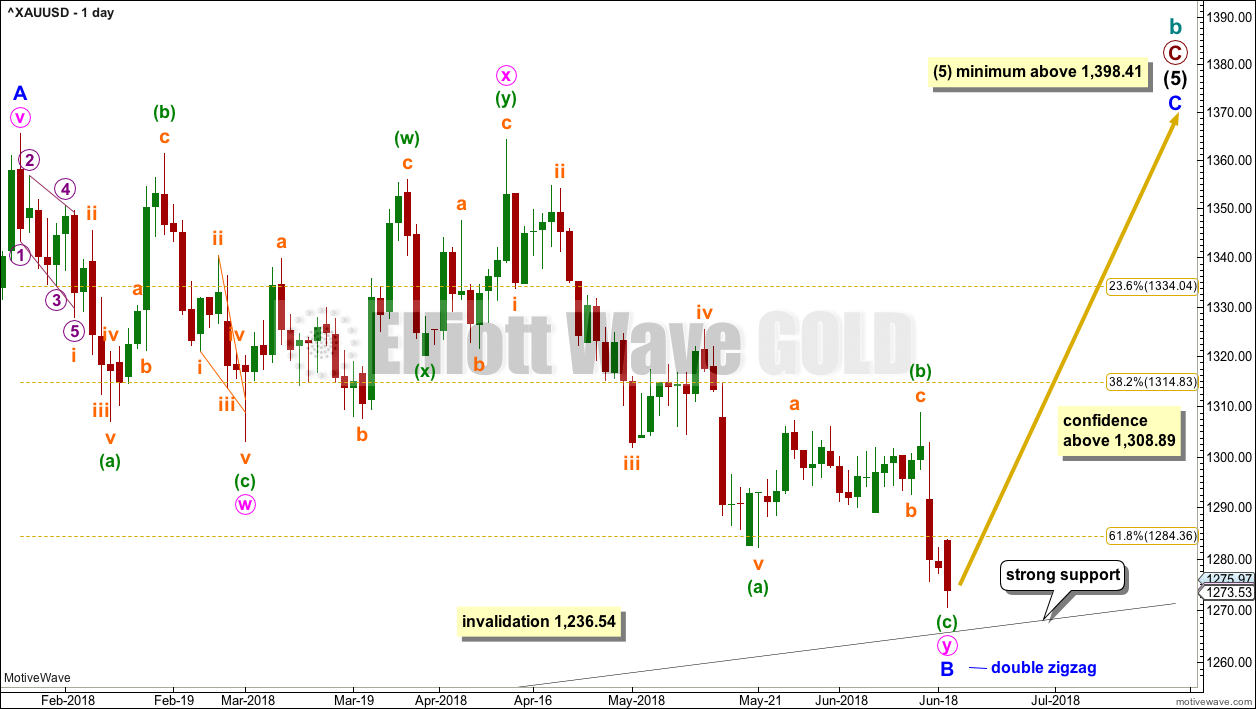
FIRST DAILY CHART
Click chart to enlarge.
Minor wave B may be a double zigzag, which may now be complete.
The first zigzag in the double is labelled minute wave w. The double is joined by a three in the opposite direction, a double zigzag labelled minute wave x. The second zigzag in the double is labelled minute wave y, and it is deepening the correction, which is the purpose of second zigzags.
Minute wave y may end at support at the lower black (2)-(4) trend line, which is copied over here from the weekly chart. This is the lower diagonal trend line.
At lower time frames, it looks like minuette wave (c) may now be complete. But if it moves lower, then look for strong support at the trend line.
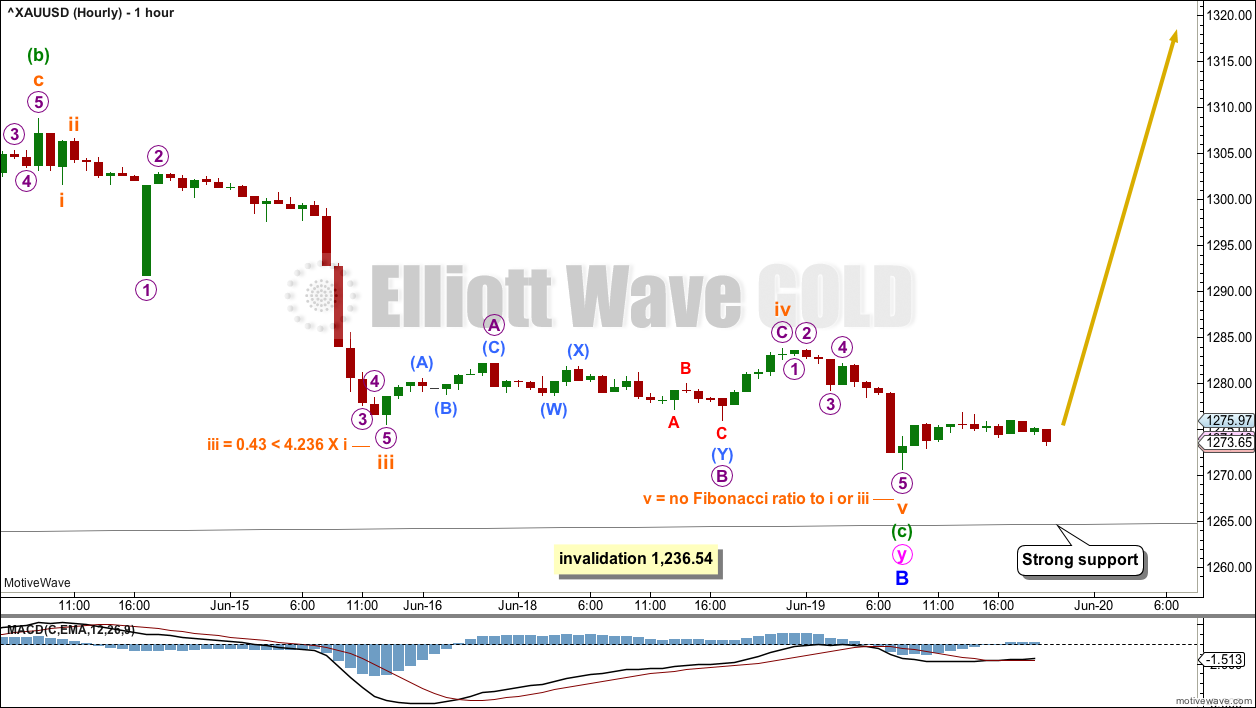
HOURLY CHART
Click chart to enlarge.
Minuette wave (c) may now be a complete five wave impulse for this wave count. If it moves any lower, it should find support at the black trend line that is now very close by.
There is strong bullish divergence between price and MACD at this time. While this remains, it supports this wave count.
WEEKLY CHART – TRIANGLE
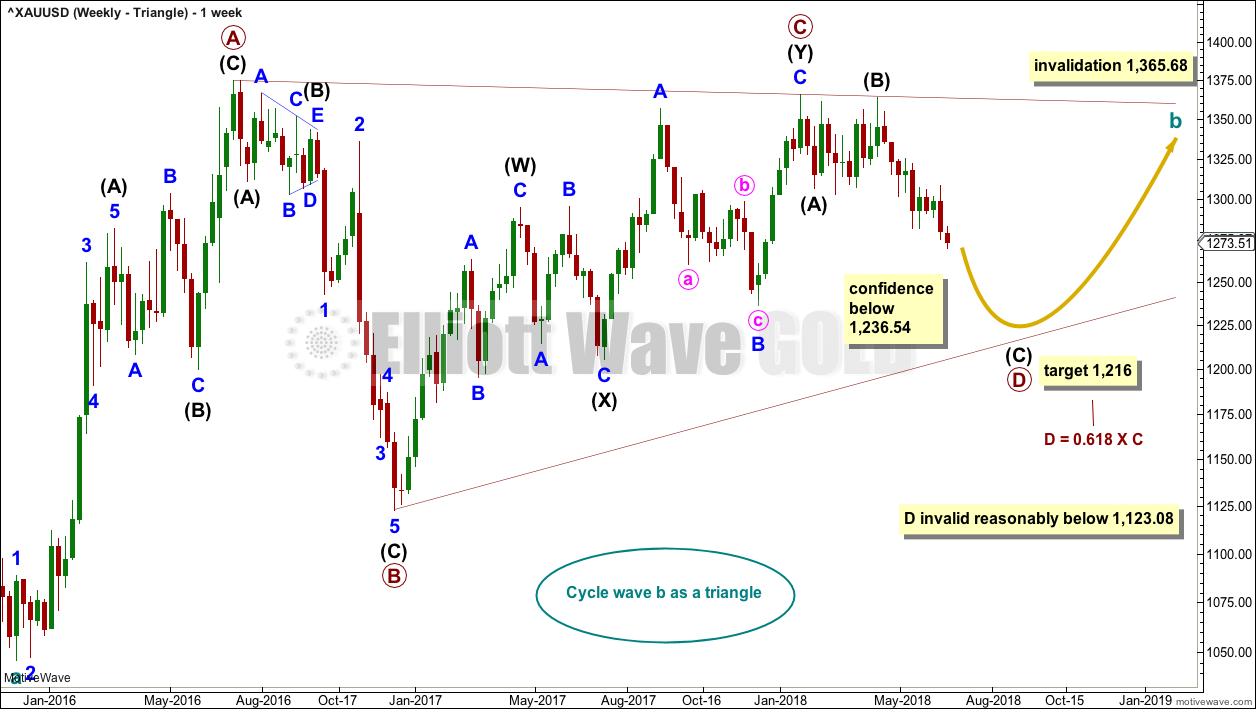
Click chart to enlarge.
This wave count is new. Thank you to Dreamer for posting a chart of this idea.
It is still possible that cycle wave b may be an incomplete triangle. The triangle may be a contracting or barrier triangle, with a contracting triangle looking much more likely because the A-C trend line does not have a strong slope. A contracting triangle could see the B-D trend line have a stronger slope, so that the triangle trend lines converge at a reasonable rate. A barrier triangle would have a B-D trend line that would be essentially flat, and the triangle trend lines would barely converge.
Within a contracting triangle, primary wave D may not move beyond the end of primary wave B below 1,123.08. Within a barrier triangle, primary wave D may end about the same level as primary wave B at 1,123.08, so that the B-D trend line is essentially flat. Only a new low reasonably below 1,123.08 would invalidate the triangle.
Within both a contracting and barrier triangle, primary wave E may not move beyond the end of primary wave C above 1,365.68.
Four of the five sub-waves of a triangle must be zigzags, with only one sub-wave allowed to be a multiple zigzag. Primary wave C is the most common sub-wave to subdivide as a multiple, and this is how primary wave C for this example fits best.
Primary wave D must be a single structure, most likely a zigzag.
One triangle sub-wave tends to be close to 0.618 the length of its predecessor; this gives a target for primary wave D.
There are no problems in terms of subdivisions or rare structures for this wave count. It has an excellent fit and so far a typical look.
DAILY CHART – TRIANGLE
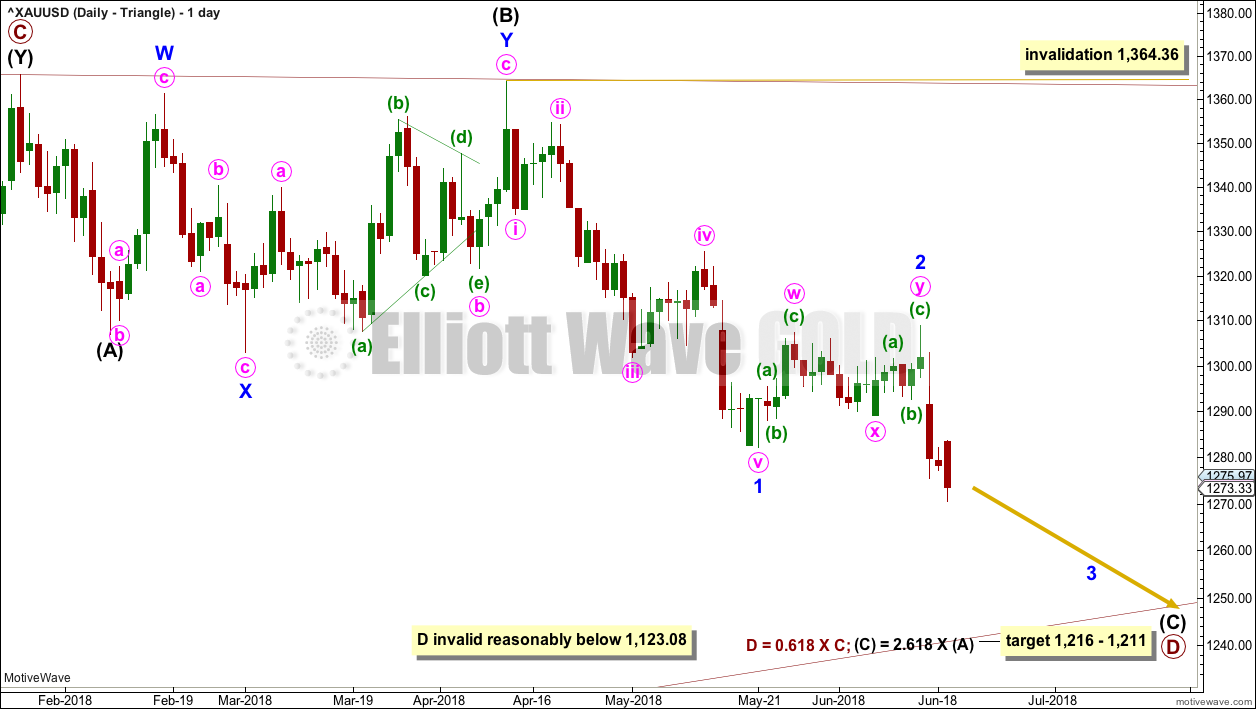
Click chart to enlarge.
Primary wave D may be unfolding lower as a single zigzag, and within it intermediate waves (A) and (B) may be complete.
The target is widened to a $5 zone calculated at two degrees. This should have a reasonable probability.
Within intermediate wave (C), it looks likely that minor wave 2 may now be over. However, it would have been shallow. It is possible that minor wave 2 may continue further as a flat correction. If minor wave 2 moves higher, it may not move beyond the start of minor wave 1 above 1,364.36.
This wave count now expects to see an increase in downwards momentum as a third wave unfolds.
WEEKLY CHART – FLAT
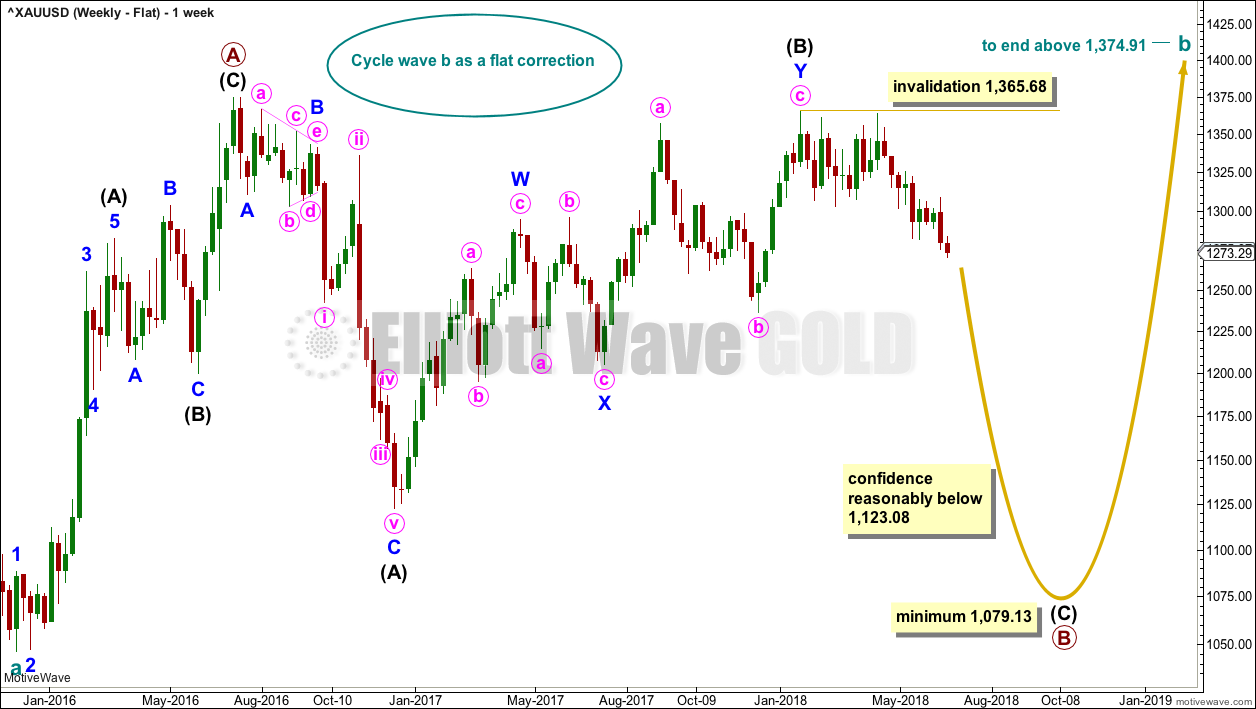
Click chart to enlarge.
It is essential when a triangle is considered to always consider alternates. Too many times over the years I have labelled a triangle as unfolding or even complete, only for it to be invalidated and the structure turning out to be something else.
It is possible that cycle wave b may be a flat correction. Within a flat correction, primary wave B must retrace a minimum 0.9 length of primary wave A at 1,079.13 or below. Primary wave B may make a new low below the start of primary wave A at 1,046.27 as in an expanded flat correction.
Primary wave B itself may be a flat correction, and within it intermediate wave (A) is a zigzag and intermediate wave (B) may have been a double zigzag. The problem of a rare triple (from the last analysis) is resolved; I have checked the subdivisions on the daily chart.
Only a new low reasonably below 1,123.08 would provide reasonable confidence in this wave count.
WEEKLY CHART – COMBINATION
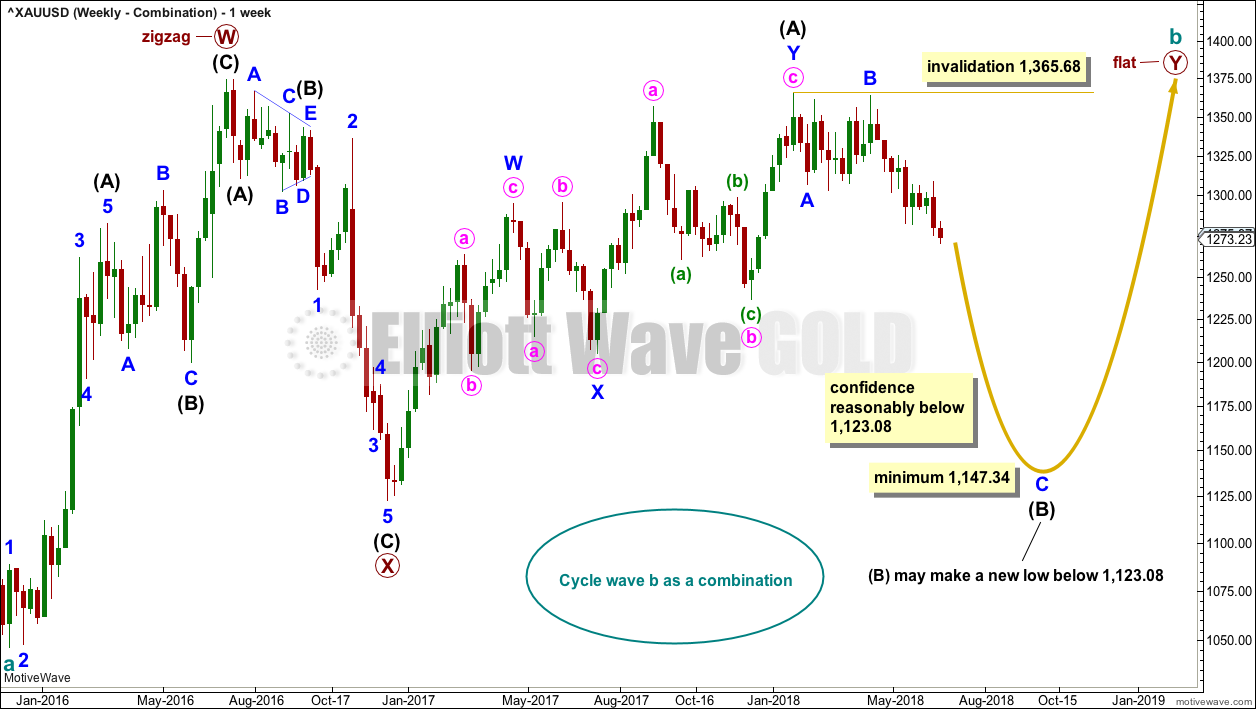
Click chart to enlarge.
When a triangle is invalidated, then the most common structure the correction turns out to be is a combination.
If cycle wave b is a combination, then the first structure in a double may be a complete zigzag labelled primary wave W.
The double may be joined by a three in the opposite direction, a zigzag labelled primary wave X.
The second structure in the double may be a flat correction labelled primary wave Y. It may also be a triangle, but that would expect essentially the same movement as the weekly triangle chart and so shall not yet be considered while there is no divergence in the expected pathway for price.
Within a flat correction for primary wave Y, the current downwards wave of intermediate wave (B) may be a single or multiple zigzag; for now it shall be labelled as a single. Intermediate wave (B) must retrace a minimum 0.9 length of intermediate wave (A) at 1,147.34. Intermediate wave (B) may move beyond the start of intermediate wave (A) as in an expanded flat.
When intermediate wave (B) is complete, then intermediate wave (C) would be expected to make at least a slight new high above the end of intermediate wave (A) at 1,365.68 to avoid a truncation. Primary wave Y would be most likely to end about the same level as primary wave W at 1,374.91, so that the whole structure takes up time and moves price sideways, as that is the purpose of double combinations.
While double combinations are very common, triples are extremely rare. When the second structure in a double is complete, then it is extremely likely that the whole correction is over.
ALTERNATE ELLIOTT WAVE COUNT
MONTHLY CHART
Click chart to enlarge.
The large wave down from September 2011 to November 2015 may also be seen as a three wave structure, a double zigzag.
If the big wave down is a multiple three wave structure, then Grand Super Cycle wave (IV) may be either a flat or triangle. It may not be a combination because they may not have multiples within multiples.
If Grand Super Cycle wave (IV) is a flat correction, then within it Super Cycle wave (b) must retrace a minimum 0.9 length of Super Cycle wave (a) at 1,832.79.
If Grand Super Cycle wave (IV) is a triangle, then there is no minimum requirement for Super Cycle wave (b). There is only the structural requirement that it should be a three wave structure.
Super Cycle wave (b) would most likely be a single or multiple zigzag and would most likely be reasonably deep.
If cycle wave a within Super Cycle wave (b) is a three wave structure, then Super Cycle wave (b) may be a flat correction. It could also be a triangle, but that would not be able to meet the expected depth.
SECOND ALTERNATE ELLIOTT WAVE COUNT
MONTHLY CHART
Click chart to enlarge.
It is possible that Grand Super Cycle wave IV is over. It would be rather brief though at only 4.25 years. However, Grand Super Cycle wave II in the Grand Super Cycle analysis is expected to have lasted only about 8 years, so this possibility should be accepted.
If there has been a trend change at Grand Super Cycle degree in the end of November 2015, then a new five wave structure upwards should develop from there at the monthly chart level.
Gold will often form long slow basing movements. Its first waves can be short and its second waves long lasting and deep.
Cycle waves I and II may be complete within Super Cycle wave (I).
Within cycle wave III, primary wave 1 may be unfolding as a leading diagonal. When it is complete, then primary wave 2 may not move beyond the start of primary wave 1 below 1,123.08.
TECHNICAL ANALYSIS
MONTHLY CHART
Click chart to enlarge. Chart courtesy of StockCharts.com.
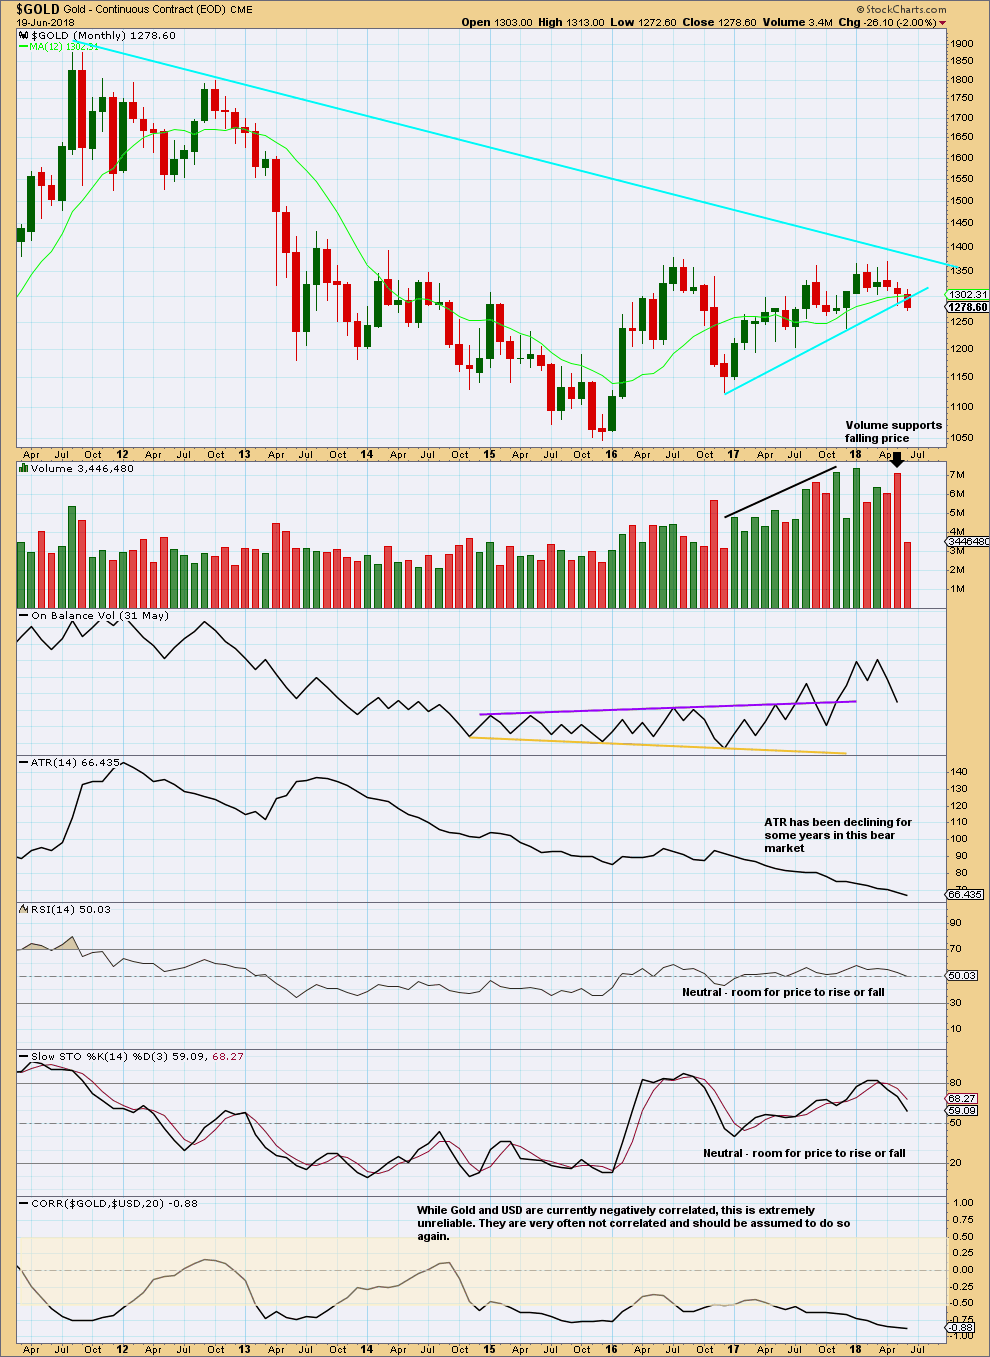
Taking a big step back to look at the monthly chart may assist in determining which Elliott wave count may be more likely at this time.
The rise in volume for the rise in price from December 2015 to April 2018 supports a bullish Elliott wave count, which could be either of the monthly alternate Elliott wave counts.
However, the month of May 2018 saw a fall in price with support from volume. This supports a bearish outlook short to mid term. This view is also supported by a breach of the upwards sloping trend line; this breach has occurred only in the last very few days.
The decline in ATR supports the view that all movement since the all time high in September 2011 may be a counter trend movement. This supports the idea of a Grand Super Cycle wave IV continuing.
Unfortunately, the situation for the long term is still unclear. What does look clear is price may reasonably be expected to fall further here.
WEEKLY CHART
Click chart to enlarge. Chart courtesy of StockCharts.com.
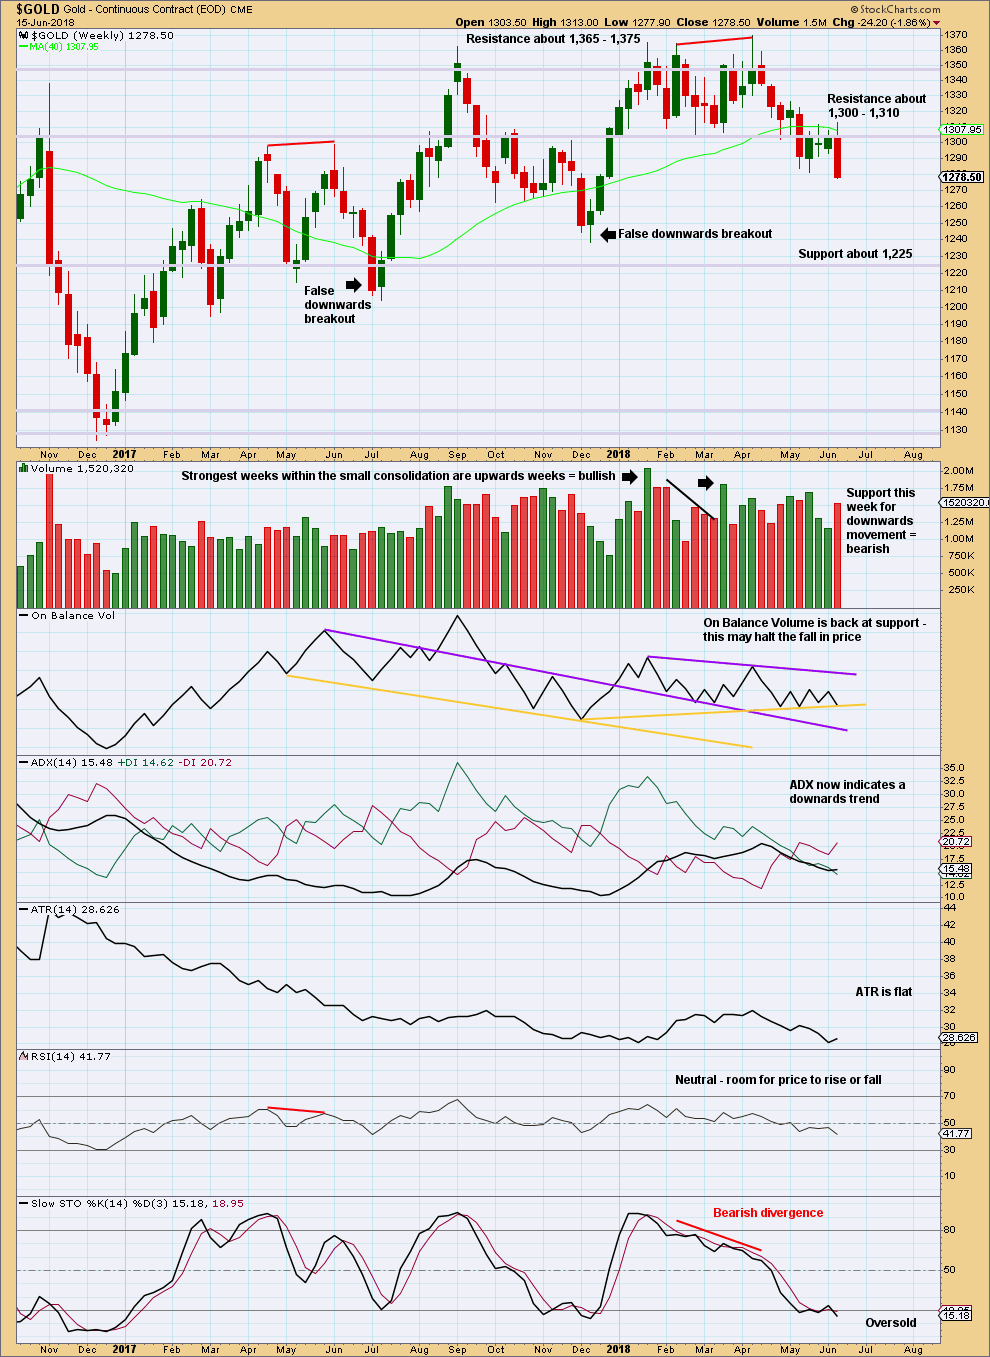
Of recent weeks, it is still an upwards week that has strongest volume.
On Balance Volume is right at support; this may halt the fall in price here.
However, this weekly candlestick is very strong; there is no bullish long lower wick. ADX now indicates a downwards trend in place here.
Overall, this chart is bearish. But volume and On Balance Volume still point to a possible false downwards breakout.
DAILY CHART
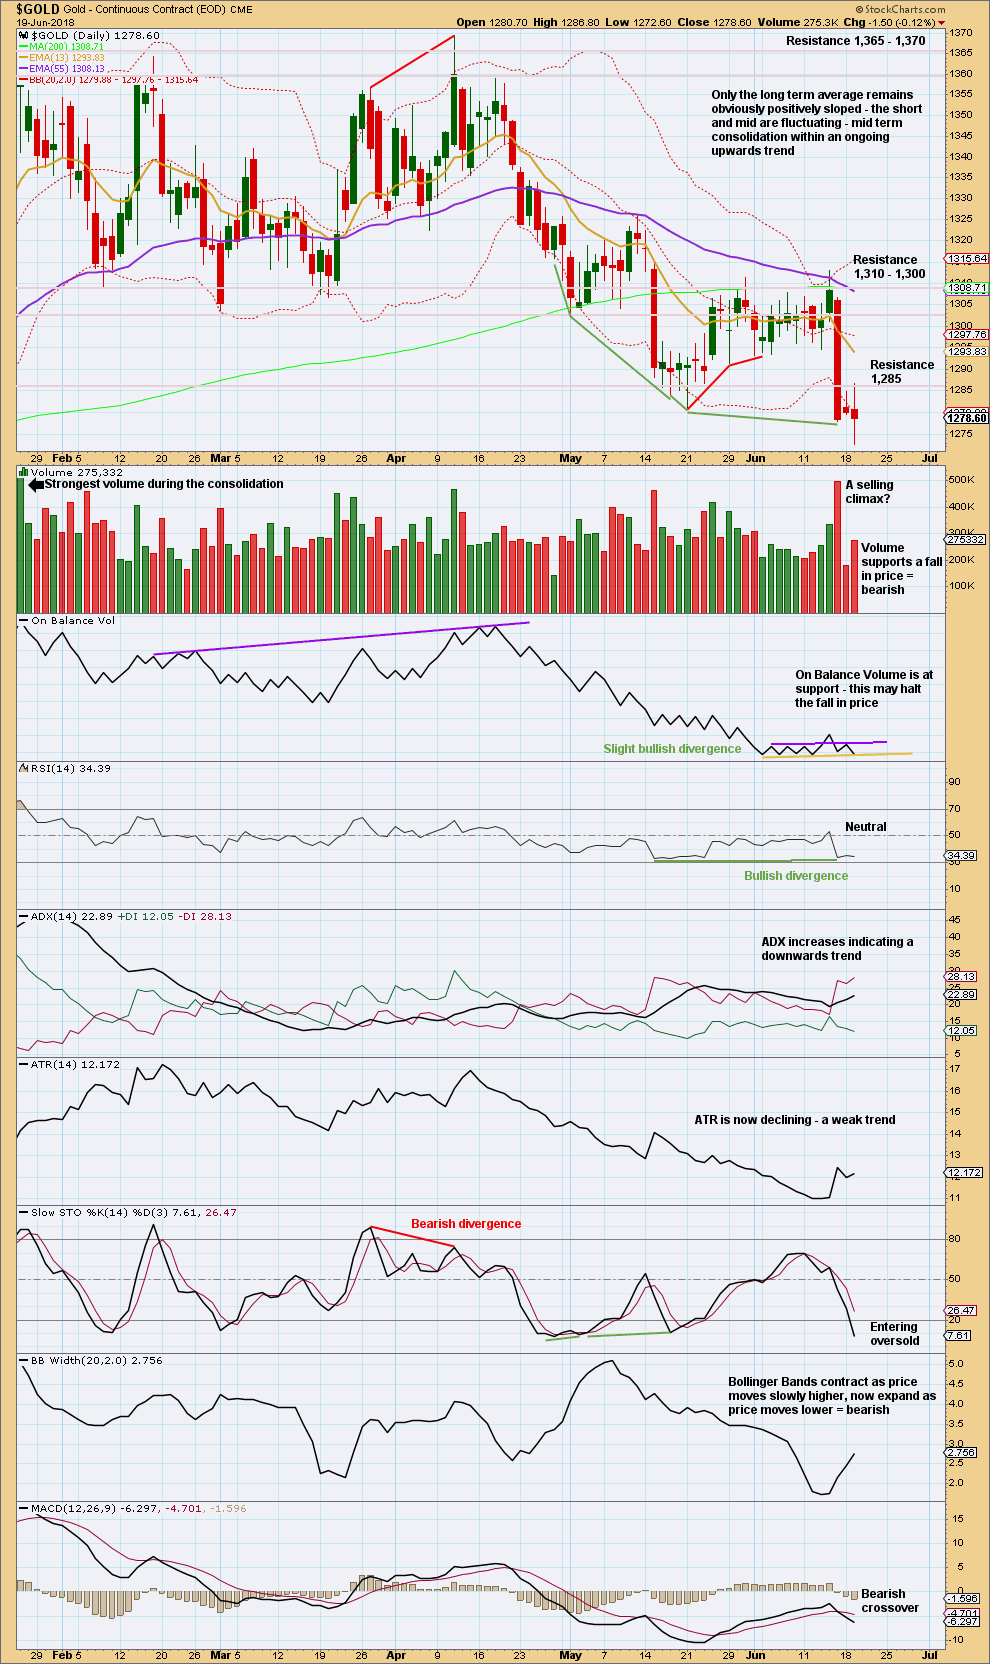
Click chart to enlarge. Chart courtesy of StockCharts.com.
It looks like the downwards breakout may still have been false, but before that can properly be concluded price needs to close back above 1,310. It has not done that yet.
Let us look back at major lows from November 2015 and see how price behaved in the days immediately after.
A major low was found on the 3rd of December, 2015. The following day for the 4th of December saw a strong Bullish Engulfing reversal pattern with support from volume, and it came with strong double bullish divergence between price and both of RSI and Stochastics. That low in hindsight looks fairly strong.
Another reasonable low was found on the 31st of May, 2016. There was no reasonable bullish divergence at the low between price and either of RSI or Stochastics. At the low, the candlestick had a bullish long lower wick (although with a reasonable upper wick, it is not properly a Hammer reversal pattern). The two days following the low for the 1st and 2nd of June were inconclusive; both closed red and could at the time have been considered a potential bear flag pattern developing; both had a balance of volume downwards but showed strongly declining volume. Not until the third day, with a very strong upwards day with support from volume to complete a very strong Bullish Engulfing reversal pattern, was a low set in place.
A major low was found on the 15th of December, 2016. At the low, the candlestick had a somewhat bullish long lower wick; volume for the last downwards day supported the fall in price; and, there was clear and strong bullish divergence between price and RSI and Stochastics. The next two days closed green but did not have support from volume. The following two days closed red and did have support from volume. At that stage, four days out from a major low, the short term volume profile was bearish and it looked like a bear flag pattern may be developing. It was not until seven days after the low on the 27th of December that a reasonable bullish day unfolded, and even then it did not have good support from volume. This low did not look clear.
The next low to study occurred on the 10th of March, 2017. That day was inconclusive, closing green, but the balance of volume was downwards and volume supported that downwards movement. At the low, there was no reasonable bullish divergence between price and either of RSI or Stochastics. It was not until three days after the low on the 15th of March that price bounced strongly to complete a strong Bullish Engulfing reversal pattern, which had good support from volume.
The next low to study occurred on the 9th of May, 2017. On that day RSI reached oversold, but there was no divergence between it and price nor price and Stochastics. Right up until six days after the low the short term volume profile could have been judged to be bearish; rising price did not have support from volume. It was clear a low was in place on the 17th of May as a very strong Bullish Engulfing reversal pattern unfolded with strong support from volume. The small bounce up until that date could have been judged to be a bounce within an ongoing downwards trend.
The next low to study occurred on the 10th of July, 2017. There was no divergence at the low between price and RSI, but there was strong clear bullish divergence between price and Stochastics. There were two candlesticks with bullish long lower wicks at the low, but volume remained lighter than the prior downwards day of the 9th of July. This looks like a selling climax in hindsight, but at the time it could have been judged to support downwards movement. Right up until the 14th of July, five days after the low, it could have been considered a bear flag pattern unfolding. On the 14th of July a strong Bullish Engulfing pattern unfolded with some support from volume.
The last low to study is a very important one on the 12th of December, 2017. This occurred after a downwards breakout below support, which was previously at 1,262. That downwards breakout was short lived; price remained below support for two weeks, and found a low only five days after the breakout. At the low, there was no bullish divergence between price and either of RSI or Stochastics. The first upwards day on the 13th of December had a wide range but a very small real body. It did have good support from volume, but volume remained lighter than most prior downwards days. After that low, price moved steadily higher for weeks, initially on light and declining volume. That low in hindsight was very difficult to pick.
Some conclusions may be drawn in relation to the current situation. The first and strongest conclusion is that lows for Gold (at least for the last two years and five months) are not always very clear at the time. Price can be weak in days immediately following lows; it can remain weak for about five to seven days following lows. Lows do not always come with divergence between price and RSI nor even price and Stochastics, but when they do that offers a clue.
A downwards trend is in place at this time. After a strong volume spike indicating a selling climax, a low may be reached not there but within a very few days. It is possible the low could be in today; On Balance Volume and a spinning top candlestick offer a little support to this view.
Up to yesterday, there was strong quadruple bullish divergence between price and Stochastics to support a bullish outlook. The divergence has mostly disappeared today. Any remaining bullish divergence is too weak now to be considered.
Overall, this chart is now more bearish than neutral or bullish. This supports the new triangle wave count.
GDX WEEKLY CHART
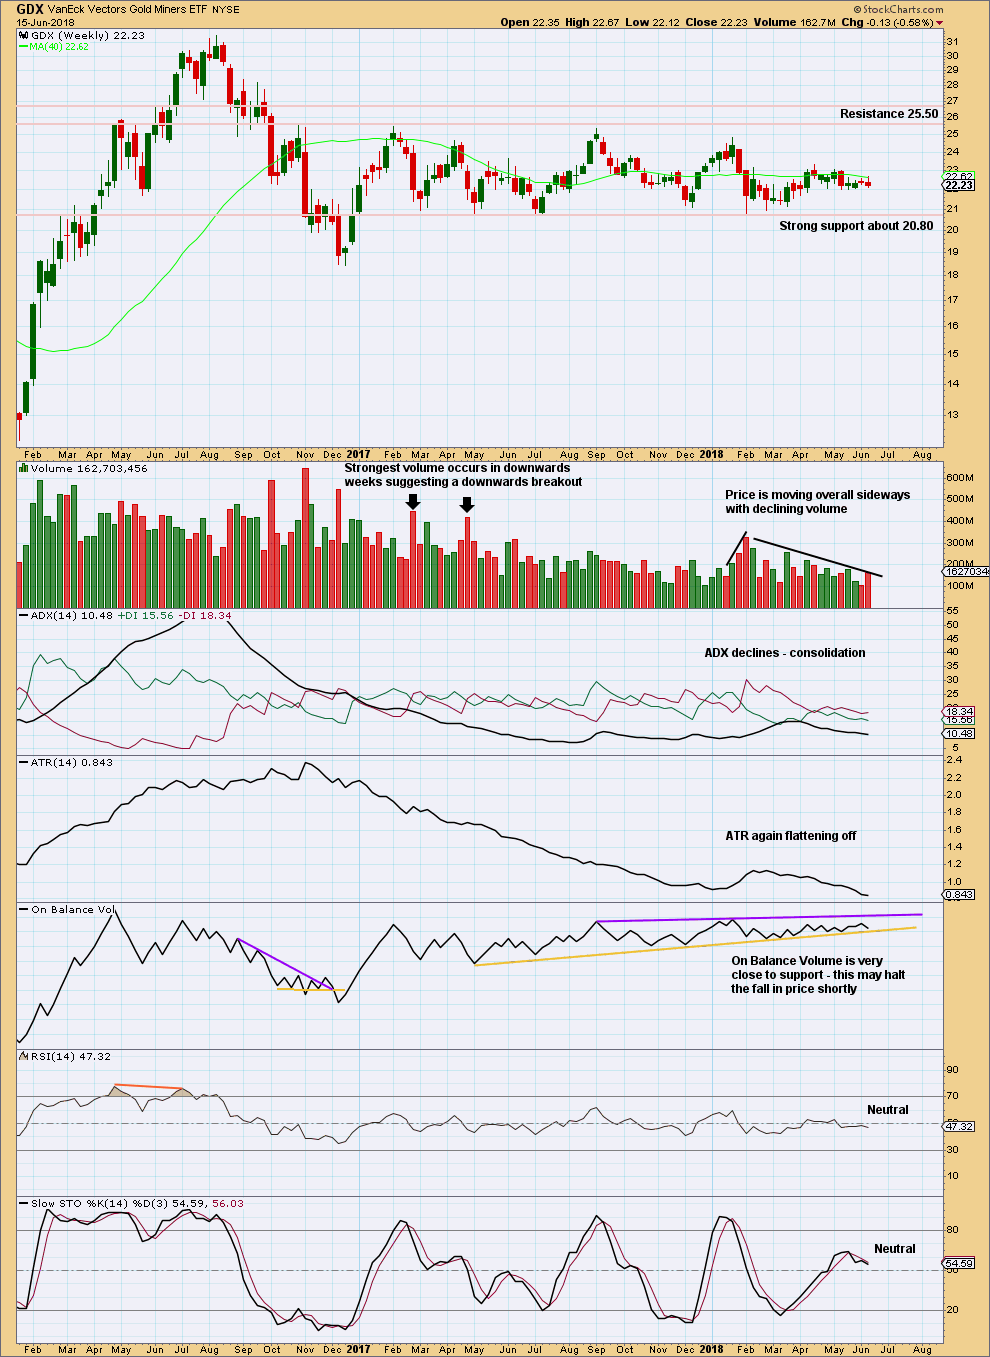
Click chart to enlarge. Chart courtesy of StockCharts.com.
Support about 20.80 has been tested about eight times and so far has held. The more often a support area is tested and holds, the more technical significance it has.
In the first instance, expect this area to continue to provide support. Only a strong downwards day, closing below support and preferably with some increase in volume, would constitute a downwards breakout from the consolidation that GDX has been in for a year now.
Resistance is about 25.50. Only a strong upwards day, closing above resistance and with support from volume, would constitute an upwards breakout.
Overall, a slow upwards swing may be underway. Do not expect it to move in a straight line; it may have downwards weeks within it.
GDX DAILY CHART
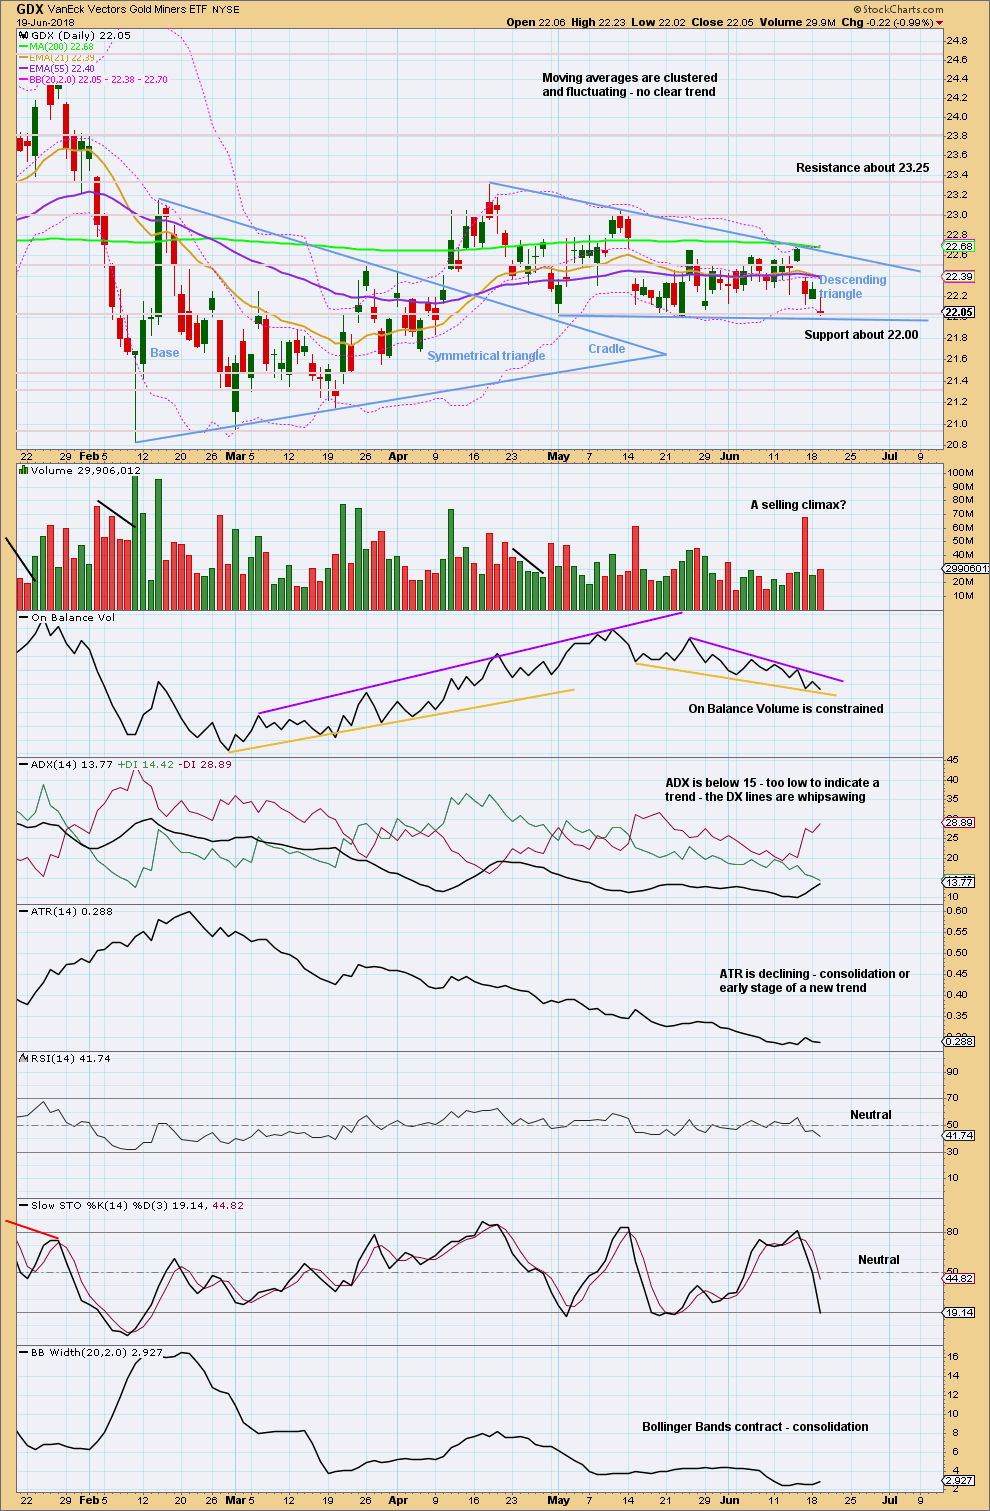
Click chart to enlarge. Chart courtesy of StockCharts.com.
The upper wick today is bearish. But with price and On Balance Volume at support, the fall in price may have ended here.
GDX needs to break out of the descending triangle by closing below 22.00 or above about 22.60. Once a breakout has occurred, then a target may be calculated.
Published @ 11:45 p.m. EST.
Hi everybody, we have a member who cannot view videos. He is using Windows 10, Chrome and Firefox. He cannot view our videos on either of these browsers.
I need to ask if any other members here are using Windows 10 and either of Chrome or Firefox? Can you play our videos with this setup?
I’m going to publish the zigzag and the triangle wave counts from here on, on a daily basis.
I’m not going to publish four weekly charts everyday, but they will all remain valid.
With today’s continuing downwards movement it is looking more and more likely that the triangle count (or any bearish count really, but lets go with that one first as it has a good look) is the right one, and the zigzag count now looks less likely.
For the zigzag count price is now extremely close to the lower (2)-(4) trend line. If price continues to move down from here then that line may be properly breached within a very few days.
If that line is breached, I’m discarding that count in favour of the triangle.
I define a breach very clearly: a full daily candlestick below and not touching the trend line, on the daily chart on a semi-log scale.
Triangle count updated:
Downwards movement, once it breaks support, should show an increase in momentum for a third wave.
Hi Dreamer.
I owe you a dollar!!!
🙂
Yep, price finally hit my buy zone for GDX and GDXJ, yet I don’t really see complete patterns yet to buy and there are more bearish options to consider. Frustrating…
I agree. Don’t see gold going higher at the moment…
Great analysis Lara!
Certainly not easy to trade right now…
Love the giant emoji Dreamer!
Thanks. That took some time…
I remember one lovely member back in 2015 saying he was looking forward to cycle a ending and cycle b beginning… and I was like, why? B waves are just the worst!
this one is proving to be no exception. choppy, overlapping, too many alternates… horrible.
I’m looking forward to it ending and cycle c beginning.