
A candlestick pattern on the daily chart in combination with volume analysis indicate the most likely scenario for early next week.
Summary: The short term target is at 1,227 for a multi day to multi week consolidation.
The mid term target is 1,216 – 1,211. Downwards movement may be limited to no lower than 1,123.08.
Always trade with stops to protect your account. Risk only 1-5% of equity on any one trade.
New updates to this analysis are in bold.
Grand SuperCycle analysis is here.
It is time again to update the historic analysis with several different possibilities for cycle wave b.
MAIN ELLIOTT WAVE COUNT
MONTHLY CHART
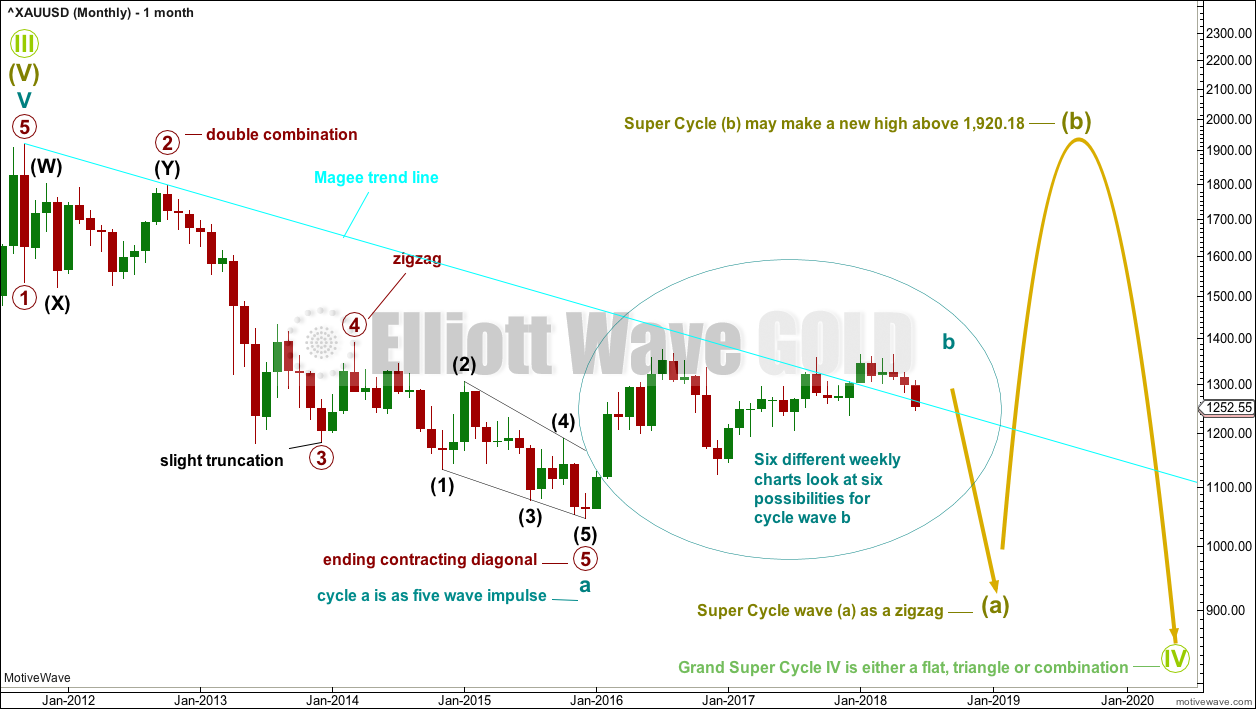
Click chart to enlarge.
The main wave count will look at the large downwards wave from the all time high as a five wave impulse. For this main wave count, it will be labelled as cycle wave a, within a zigzag for Super Cycle wave (a).
It is also possible to move the degree of labelling up one degree and see this as a five wave structure complete for Super Cycle wave (a).
Both degrees of labelling would be valid, but in the interests of keeping charts and ideas to a manageable level only one shall be published at this stage. The difference will not be material for at least a year and probably more.
If cycle wave a is a five, then cycle wave b may not move beyond its start above 1,920.18.
Cycle wave b may be any one of more than 23 possible corrective structures. Six different ideas for cycle wave b will be considered this week on weekly charts: a zigzag (with two charts), double zigzag, triangle, flat and a combination.
When cycle wave b is complete, then cycle wave c downwards should unfold. Cycle wave c would most likely reach about equality in length with cycle wave a.
If this wave count unfolds as expected, then a huge zigzag downwards may be complete when cycle wave c completes. That would then be expected to be followed by a huge three wave structure upwards, most likely another zigzag for Super Cycle wave (b), which may make a new all time high.
The larger structure for Grand Super Cycle wave (IV) would be starting out with a huge zigzag downwards, indicating either a flat, triangle or combination.
WEEKLY CHART – TRIANGLE
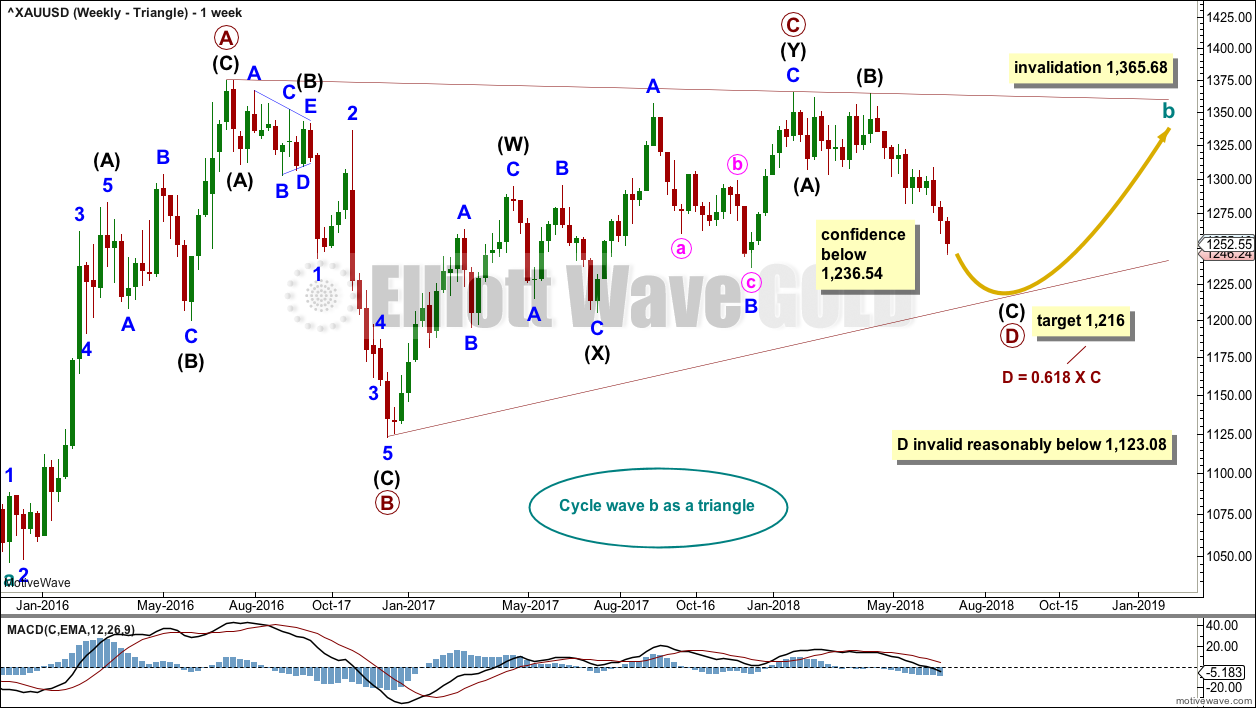
Click chart to enlarge.
The triangle so far has the best fit and look. If price shows a combination or flat may be more likely, then those ideas may be published on a daily basis. The flat and combination ideas expect movement reasonably below 1,123.08, or perhaps a new low below 1,046.27.
Cycle wave b may be an incomplete triangle. The triangle may be a contracting or barrier triangle, with a contracting triangle looking much more likely because the A-C trend line does not have a strong slope. A contracting triangle could see the B-D trend line have a stronger slope, so that the triangle trend lines converge at a reasonable rate. A barrier triangle would have a B-D trend line that would be essentially flat, and the triangle trend lines would barely converge.
Within a contracting triangle, primary wave D may not move beyond the end of primary wave B below 1,123.08. Within a barrier triangle, primary wave D may end about the same level as primary wave B at 1,123.08, so that the B-D trend line is essentially flat. Only a new low reasonably below 1,123.08 would invalidate the triangle.
Within both a contracting and barrier triangle, primary wave E may not move beyond the end of primary wave C above 1,365.68.
Four of the five sub-waves of a triangle must be zigzags, with only one sub-wave allowed to be a multiple zigzag. Primary wave C is the most common sub-wave to subdivide as a multiple, and this is how primary wave C for this example fits best.
Primary wave D must be a single structure, most likely a zigzag.
One triangle sub-wave tends to be close to 0.618 the length of its predecessor; this gives a target for primary wave D.
There are no problems in terms of subdivisions or rare structures for this wave count. It has an excellent fit and so far a typical look.
DAILY CHART – TRIANGLE
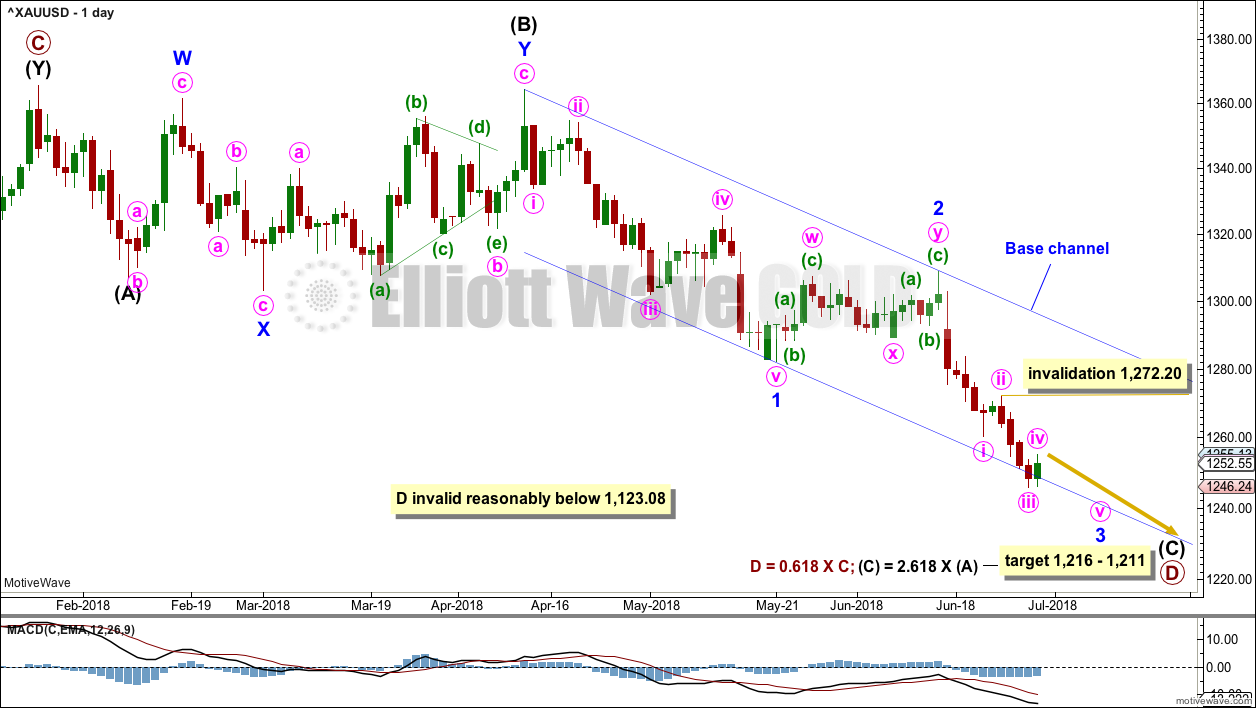
Click chart to enlarge.
Primary wave D may be unfolding lower as a single zigzag, and within it intermediate waves (A) and (B) may be complete.
The target is widened to a $5 zone calculated at two degrees. This should have a reasonable probability.
Within intermediate wave (C), it looks likely that minor wave 2 may now be over. Within minor wave 3, no second wave correction may move beyond the start of its first wave above 1,308.89.
This wave count now expects to see an increase in downwards momentum as a third wave unfolds.
Add a base channel about minor waves 1 and 2. Along the way down, bounces for lower degree second wave corrections may be expected to find resistance at the upper edge of the base channel. The middle to end of minor wave 3 may have the power to break below support at the lower edge of the base channel.
Gold, typical of commodities, often exhibits very swift and strong fifth waves. This tendency is particularly prevalent for its fifth waves to end third wave impulses. Look out for a possible selling climax to end one or both of minute wave iii and minor wave 3.
Within minute wave iii, no second wave correction may move beyond the start of its first wave above 1,272.20.
It is possible that minute wave iii was over at Thursday’s low as labelled, but it is also possible that minute wave iii may continue lower. The invalidation point must remain the same.
HOURLY CHART
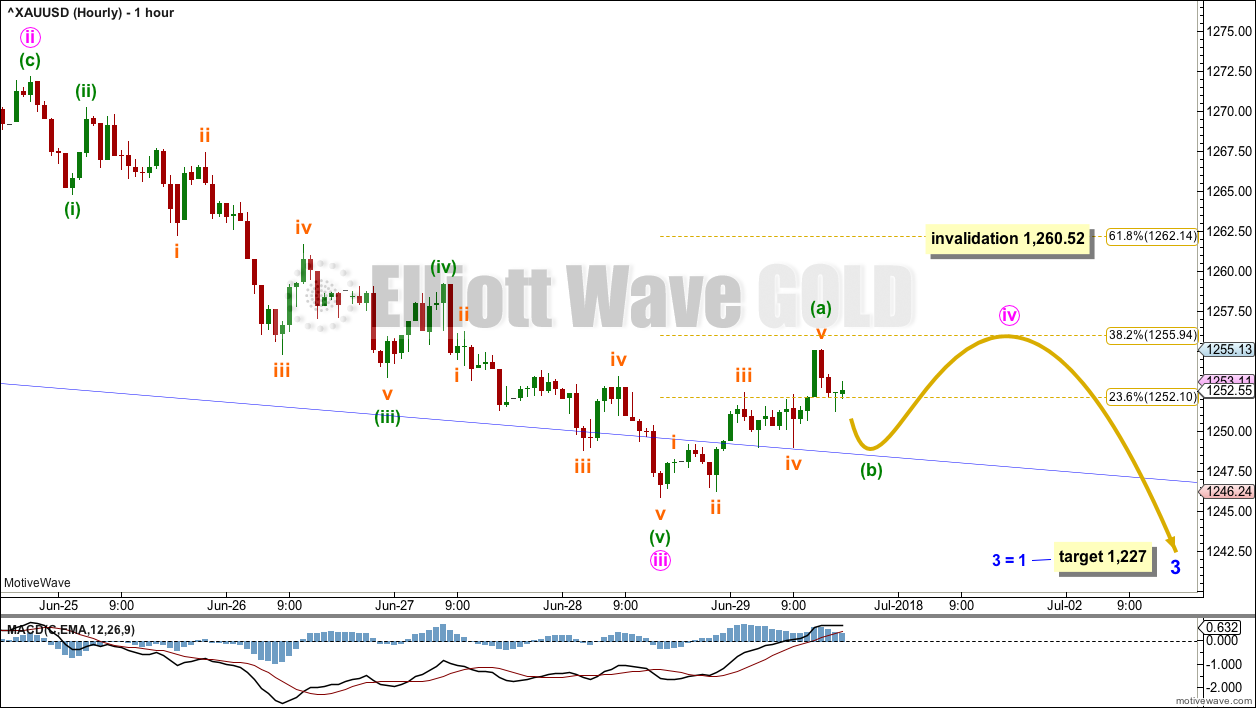
Click chart to enlarge.
The base channel on the daily chart is copied over to this hourly chart.
Minor wave 3 may only subdivide as an impulse. The target for minor wave 3 to end is equality in length with minor wave 1, because minor wave 2 was shallow. This target fits with the lower target for intermediate wave (C) to end.
Within minor wave 3, minute waves i, ii and now iii may be complete. If minute wave iii is over at the last low, then it would be shorter than minute wave i by 22.07. This limits minute wave v to no longer than equality in length than minute wave iii at 26.30 in length, so that minute wave iii is not the shortest actionary wave.
If minute wave iii is over at the last low, then minute wave iv may not move into minute wave i price territory above 1,260.52.
It is also possible to move the degree of labelling within minute wave iii down one degree; only minuette wave (i) may be over at the last low, and minuette wave (ii) may not move beyond the start of minuette wave (i) above 1,272.20.
Price may now be moving towards the end of minor wave 3. There will be the possibility for price to move very strongly lower as minor wave 3 comes to an end; fifth waves to end third wave impulses may be strong and sharp.
WEEKLY CHART – COMBINATION
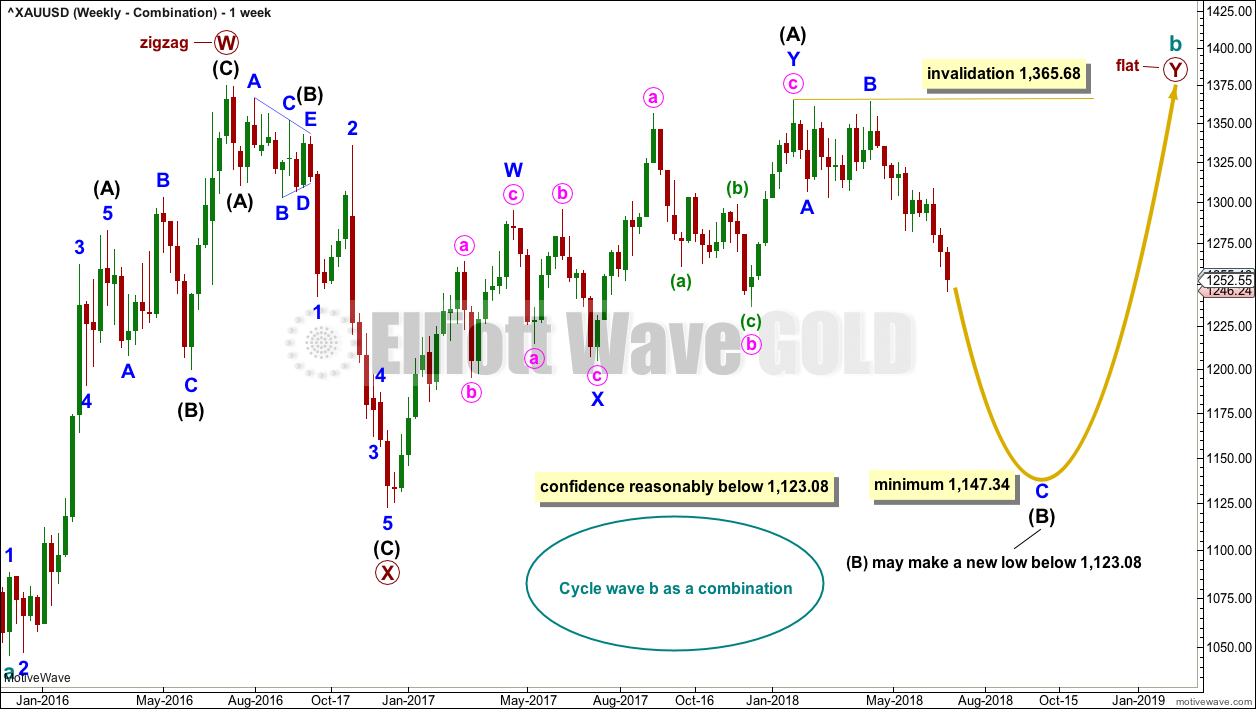
Click chart to enlarge.
It is essential when a triangle is considered to always consider alternates. Too many times over the years I have labelled a triangle as unfolding or even complete, only for it to be invalidated and the structure turning out to be something else.
When a triangle is invalidated, then the most common structure the correction turns out to be is a combination.
If cycle wave b is a combination, then the first structure in a double may be a complete zigzag labelled primary wave W.
The double may be joined by a three in the opposite direction, a zigzag labelled primary wave X.
The second structure in the double may be a flat correction labelled primary wave Y. It may also be a triangle, but that would expect essentially the same movement as the weekly triangle chart and so shall not yet be considered while there is no divergence in the expected pathway for price.
Within a flat correction for primary wave Y, the current downwards wave of intermediate wave (B) may be a single or multiple zigzag; for now it shall be labelled as a single. Intermediate wave (B) must retrace a minimum 0.9 length of intermediate wave (A) at 1,147.34. Intermediate wave (B) may move beyond the start of intermediate wave (A) as in an expanded flat.
When intermediate wave (B) is complete, then intermediate wave (C) would be expected to make at least a slight new high above the end of intermediate wave (A) at 1,365.68 to avoid a truncation. Primary wave Y would be most likely to end about the same level as primary wave W at 1,374.91, so that the whole structure takes up time and moves price sideways, as that is the purpose of double combinations.
While double combinations are very common, triples are extremely rare. When the second structure in a double is complete, then it is extremely likely that the whole correction is over.
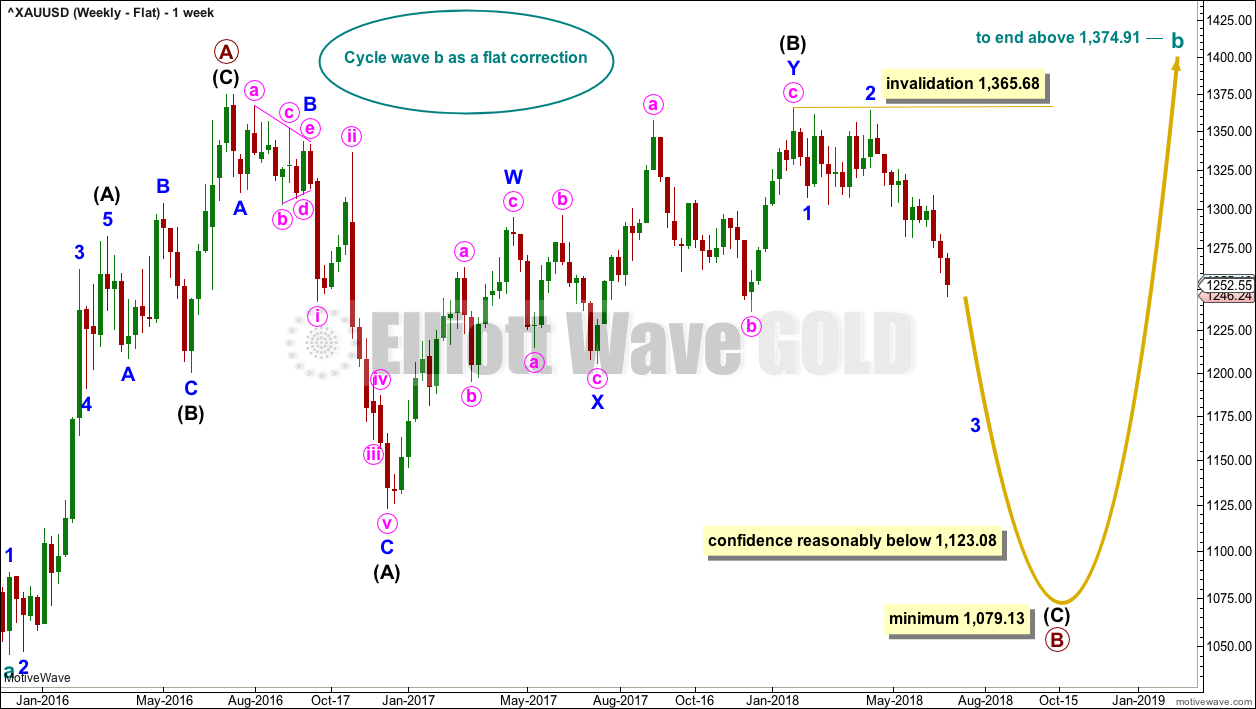
WEEKLY CHART – FLAT
Click chart to enlarge.
It is possible that cycle wave b may be a flat correction. Within a flat correction, primary wave B must retrace a minimum 0.9 length of primary wave A at 1,079.13 or below. Primary wave B may make a new low below the start of primary wave A at 1,046.27 as in an expanded flat correction.
Primary wave B itself may be a flat correction, and within it intermediate wave (A) is a zigzag and intermediate wave (B) may have been a double zigzag. The problem of a rare triple (from the last analysis) is resolved; I have checked the subdivisions on the daily chart.
Only a new low reasonably below 1,123.08 would provide reasonable confidence in this wave count.
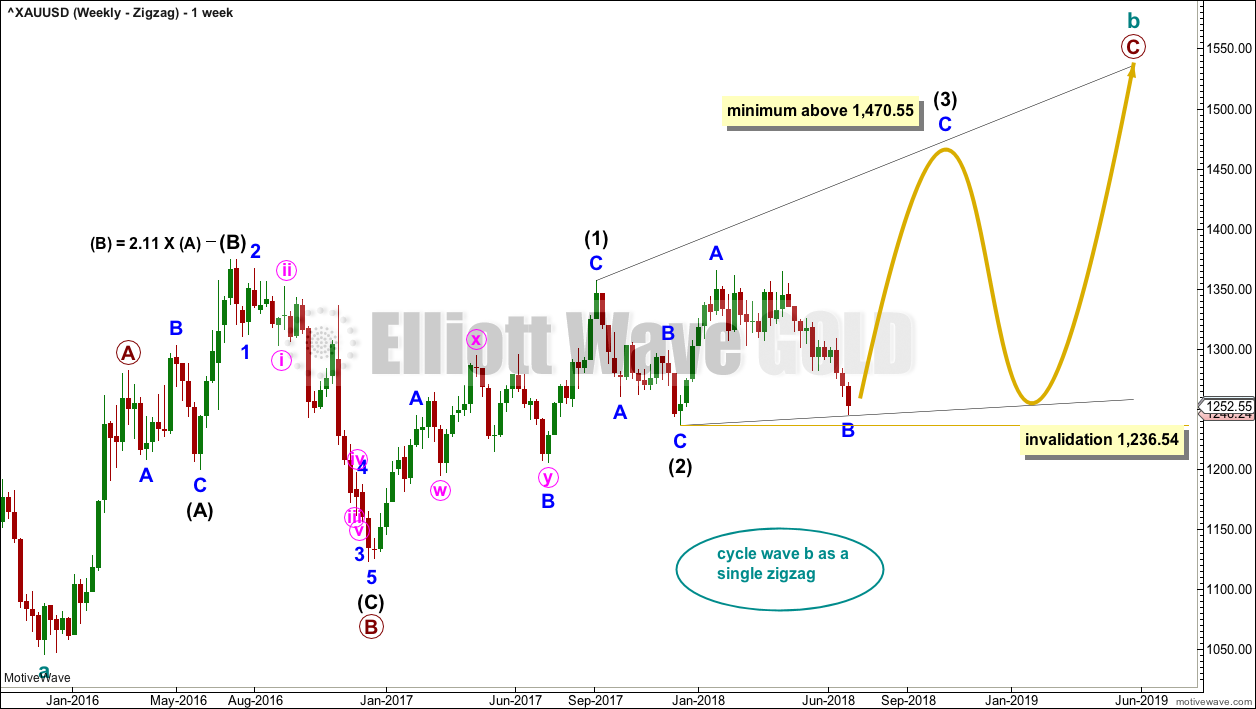
WEEKLY CHART – ZIGZAG
Click chart to enlarge.
This wave count is a new idea presented this week.
It is still possible that cycle wave b may be a zigzag. Primary wave A is seen as over earlier, resolving the prior problem of trying to see the first wave up as a five when it looks like a three. Primary wave B now fits well as an expanded flat.
A problem now exists at the start of intermediate wave (C) of primary wave B. At the start of that downwards wave is what looks like a perfect triangle. Because second waves do not subdivide with triangles as their sole corrective structure, the triangle must be ignored and this may be seen as a series of overlapping first and second waves, but ignoring the triangle there must reduce the probability of this wave count.
There is no maximum limit to the length of B waves within flats, but there is a convention within Elliott wave that states when the possible B wave reaches twice the length of the A wave, the idea of a flat should be discarded based upon a very low probability. This wave count sees intermediate wave (B) within primary wave B as a little longer than twice the length of intermediate wave (A). While this does not break any Elliott wave rules, it does reduce the probability of this wave count.
Primary wave C is seen as an ending diagonal. Within ending diagonals, all sub-waves must subdivide as zigzags. Diagonals, like triangles, normally adhere very well to their trend lines. For this example, the lower (2)-(4) trend line must show where minor wave B has found support, which would mean the diagonal must be expanding.
For an expanding diagonal, intermediate wave (3) must be longer in length then intermediate wave (1), so it must end above 1,470.55. Intermediate wave (4) must then be longer in length than intermediate wave (2), and finally intermediate wave (5) must be longer in length than intermediate wave (3). This wave count is extremely bullish.
This wave count expects a low in place and a quick reversal next week.
Within the zigzag of intermediate wave (3), minor wave B may not move beyond the start minor wave A below 1,236.54.
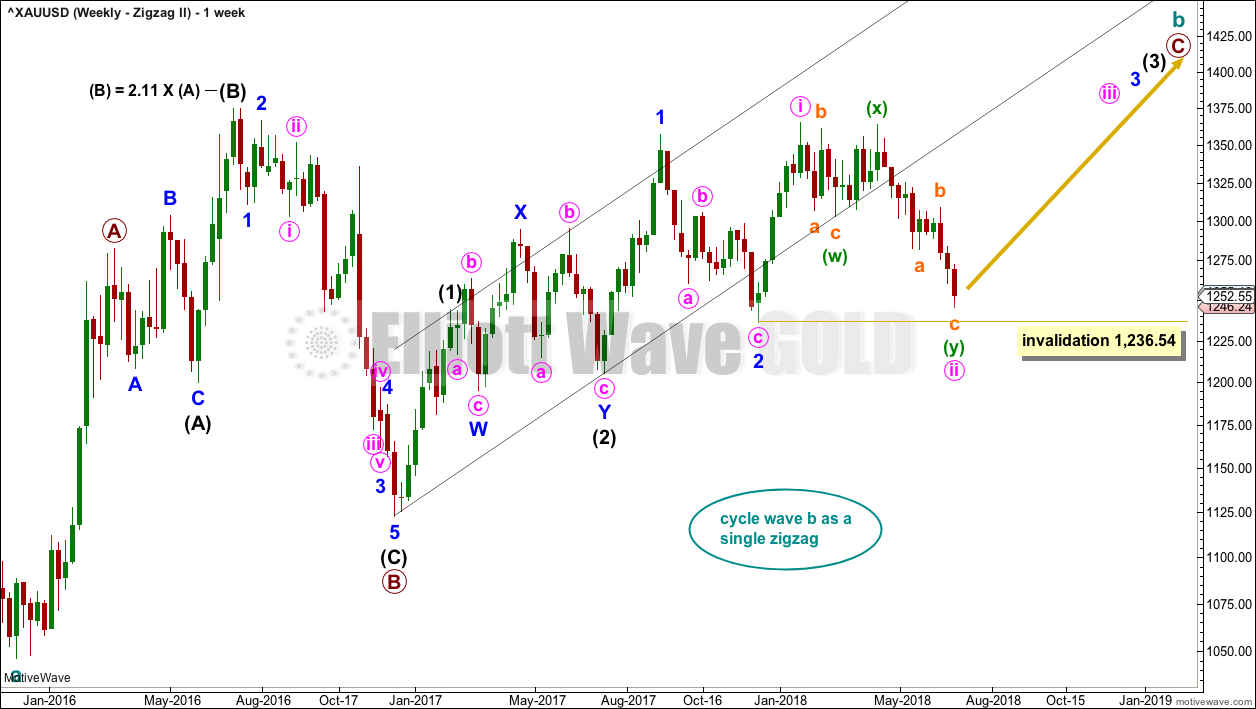
WEEKLY CHART – ZIGZAG II
Click chart to enlarge.
This weekly chart is identical to the first zigzag chart with the exception of the structure of primary wave C.
Primary wave C may be either an ending diagonal or an impulse. This second weekly chart considers the possibility of an impulse.
There may be so far a series of three overlapping first and second waves complete within primary wave C. This wave count is extremely bullish, expecting a quick reversal next week and very strong upwards movement as the middle of a third wave upwards begins.
Minute wave ii may not move beyond the start of minute wave i below 1,236.54.
This wave count suffers from the same problems as the first zigzag wave count. In addition to those problems, it also suffers from what looks like poor proportion of second wave corrections. Minute wave ii looks too be too large and deep for a lower degree second wave correction. Neither of minor wave 2 nor minute wave ii are contained within the black base channel drawn about intermediate waves (1) and (2); this further reduces the probability of this wave count. This wave count must be judged to have the lowest probability of all the weekly charts published here.
Low probability does not mean no probability.
WEEKLY CHART – DOUBLE ZIGZAG
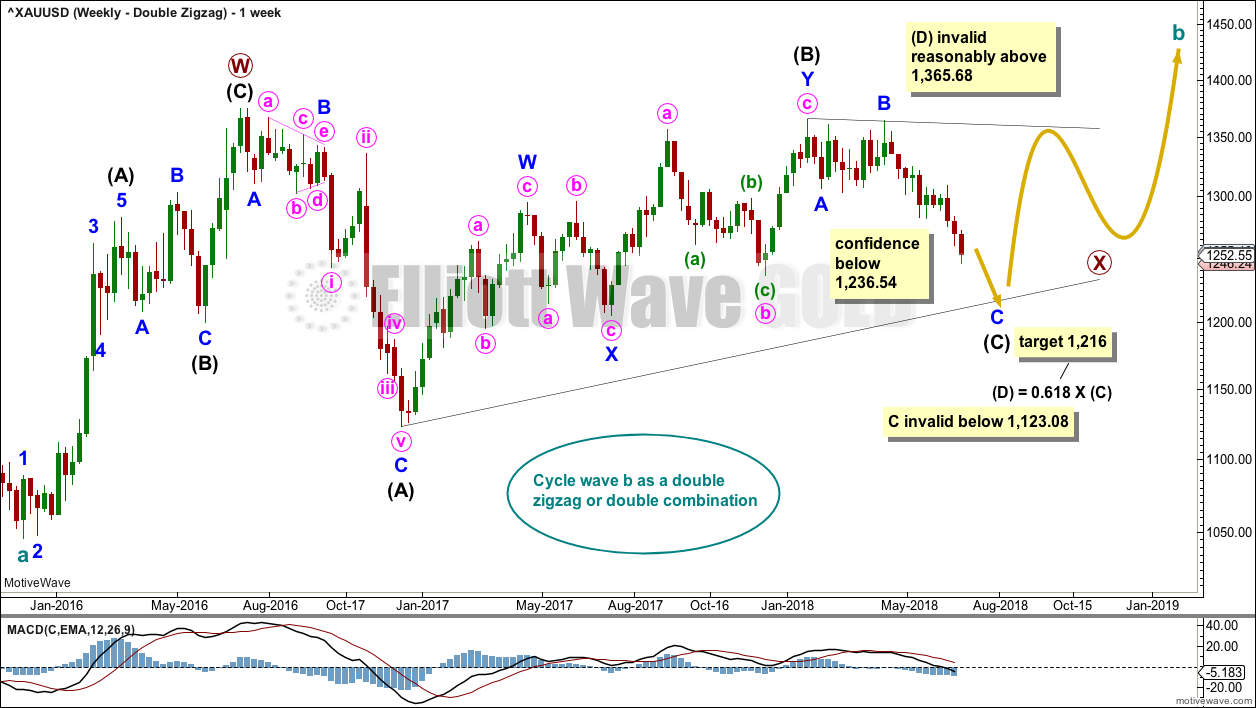
Click chart to enlarge.
Finally, it is also possible that cycle wave b may be a double zigzag or a double combination.
The first zigzag in the double is labelled primary wave W. This has a good fit.
The double may be joined by a corrective structure in the opposite direction, a triangle labelled primary wave X. The triangle would be only a little over halfway through.
This wave count may now expect choppy overlapping movement in an ever decreasing range for several more weeks yet. After the triangle is complete, then an upwards breakout would be expected from it.
Primary wave Y would most likely be a zigzag because primary wave X would be shallow; double zigzags normally have relatively shallow X waves.
Primary wave Y may also be a flat correction if cycle wave b is a double combination, but combinations normally have deep X waves. This would be less likely.
This wave count has good proportions and no problems in terms of subdivisions.
ALTERNATE ELLIOTT WAVE COUNT
MONTHLY CHART
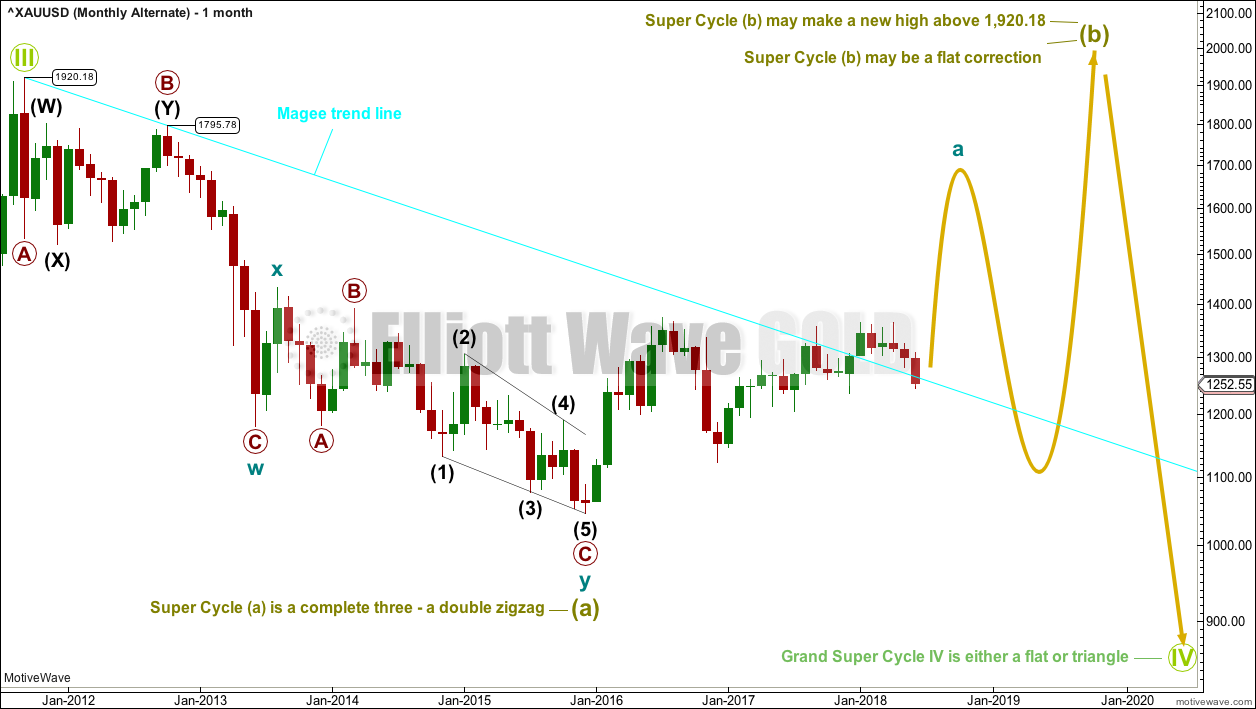
Click chart to enlarge.
The large wave down from September 2011 to November 2015 may also be seen as a three wave structure, a double zigzag.
If the big wave down is a multiple three wave structure, then Grand Super Cycle wave (IV) may be either a flat or triangle. It may not be a combination because they may not have multiples within multiples.
If Grand Super Cycle wave (IV) is a flat correction, then within it Super Cycle wave (b) must retrace a minimum 0.9 length of Super Cycle wave (a) at 1,832.79.
If Grand Super Cycle wave (IV) is a triangle, then there is no minimum requirement for Super Cycle wave (b). There is only the structural requirement that it should be a three wave structure.
Super Cycle wave (b) would most likely be a single or multiple zigzag and would most likely be reasonably deep.
If cycle wave a within Super Cycle wave (b) is a three wave structure, then Super Cycle wave (b) may be a flat correction. It could also be a triangle, but that would not be able to meet the expected depth.
SECOND ALTERNATE ELLIOTT WAVE COUNT
MONTHLY CHART
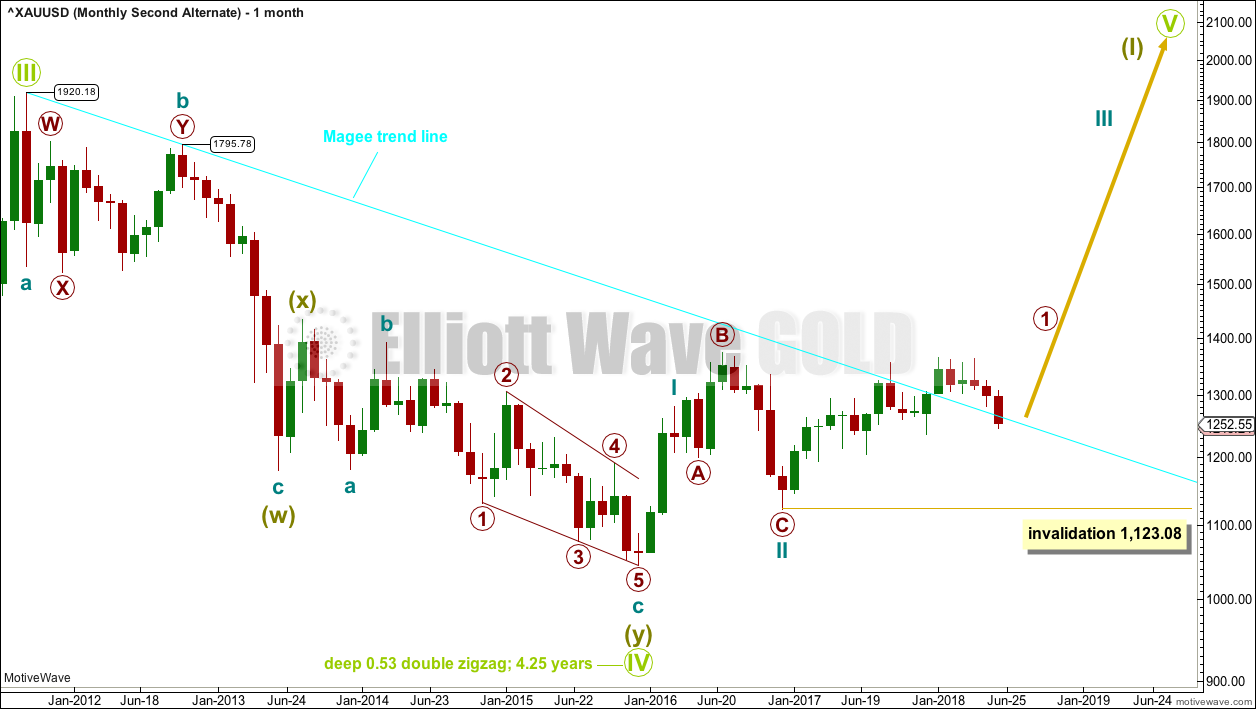
Click chart to enlarge.
It is possible that Grand Super Cycle wave IV is over. It would be rather brief though at only 4.25 years. However, Grand Super Cycle wave II in the Grand Super Cycle analysis is expected to have lasted only about 8 years, so this possibility should be accepted.
If there has been a trend change at Grand Super Cycle degree in the end of November 2015, then a new five wave structure upwards should develop from there at the monthly chart level.
Gold will often form long slow basing movements. Its first waves can be short and its second waves long lasting and deep.
Cycle waves I and II may be complete within Super Cycle wave (I).
Within cycle wave III, primary wave 1 may be unfolding as a leading diagonal. When it is complete, then primary wave 2 may not move beyond the start of primary wave 1 below 1,123.08.
At the weekly chart level, the subdivisions for this idea must be seen in the same way as the zigzag charts above. This is because a zigzag subdivides 5-3-5, exactly the same as 1-2-3 of an impulse. This wave count would suffer from the same problems as the two weekly zigzag charts above.
TECHNICAL ANALYSIS
WEEKLY CHART
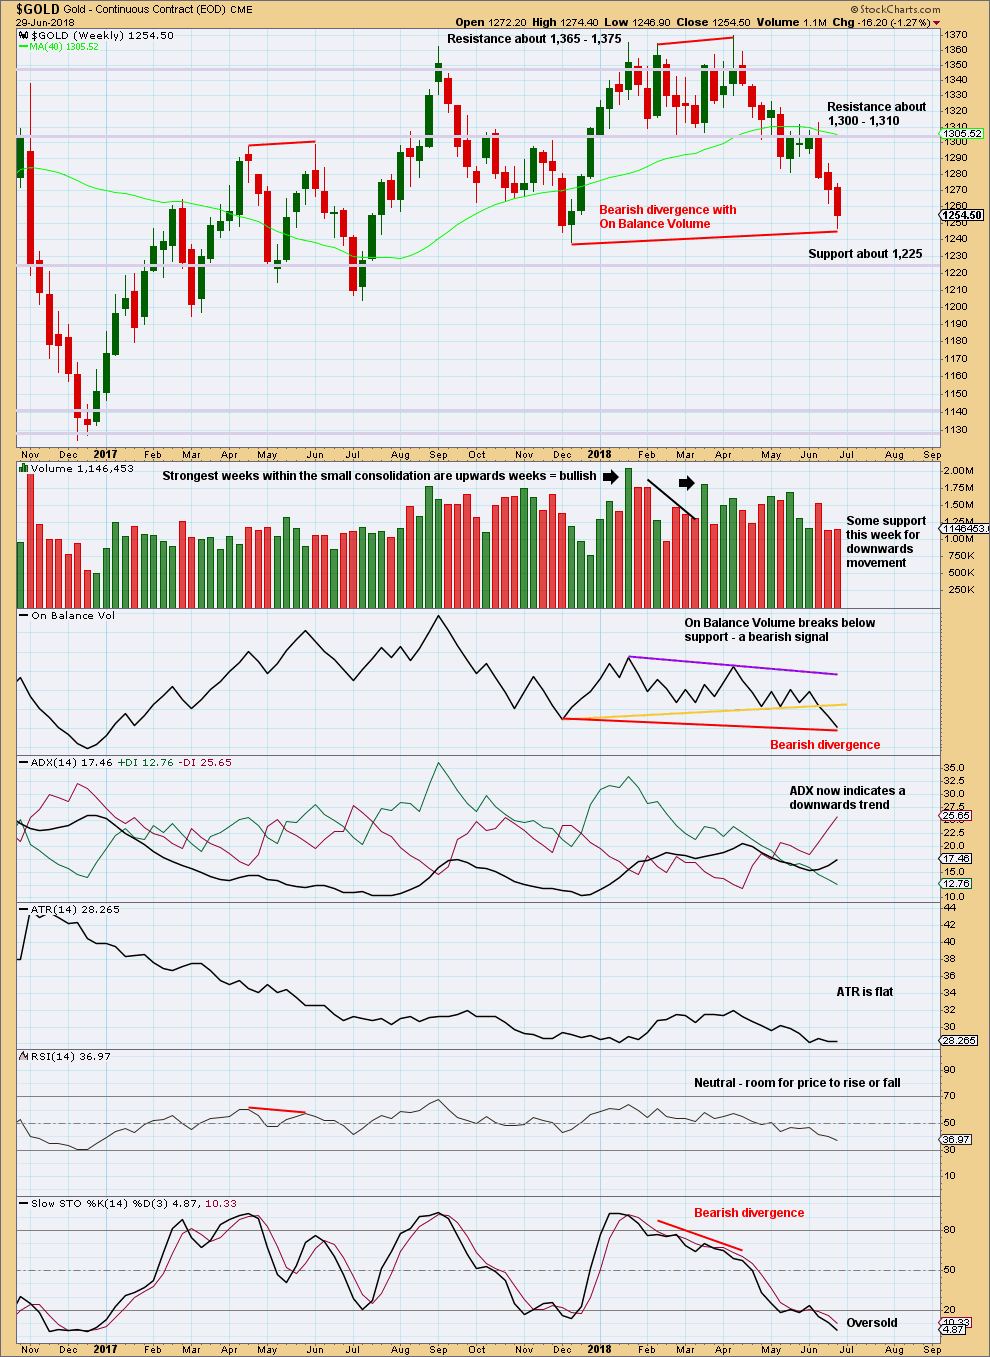
Click chart to enlarge. Chart courtesy of StockCharts.com.
On Balance Volume has made a new swing low this week below the prior swing low, but price has not. On Balance Volume should be read as a leading indicator, so this is bearish and indicates price may likely follow through with a new swing low below 1,238.30.
The long lower wick on this weekly candlestick is a little bullish, but it is not long enough to expect a low is likely to be in place here.
DAILY CHART
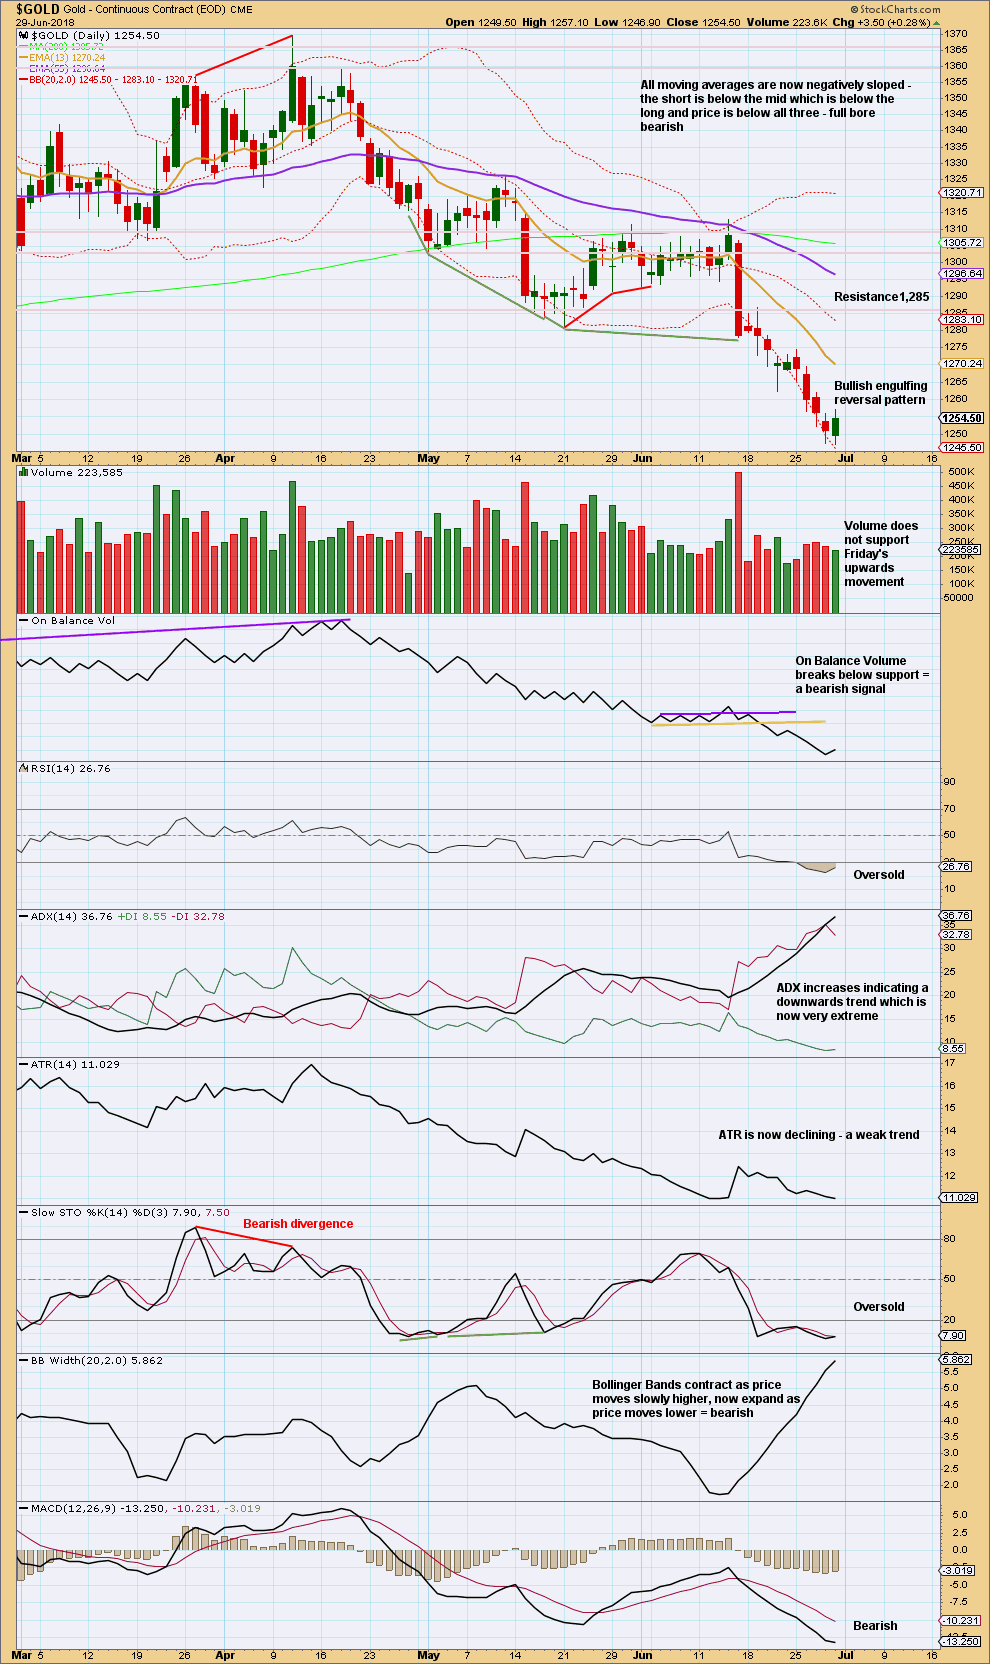
Click chart to enlarge. Chart courtesy of StockCharts.com.
A bullish reversal pattern after a strong decline indicates a low may now be in place, at least for the short term. Candlestick reversal patterns make no comment on the direction of the next movement (sideways or a full reversal) nor for how long the next movement may last (from a few days to a new trend).
One to a very few days of consolidation may resolve RSI being oversold and ADX reaching very extreme.
Overall, this chart remains bearish, but the trend is now very extreme and an end to the trend may be approaching. However, Gold can maintain very extreme indicators for a reasonable period of time, and price can move a considerable distance before it finally ends.
GDX WEEKLY CHART
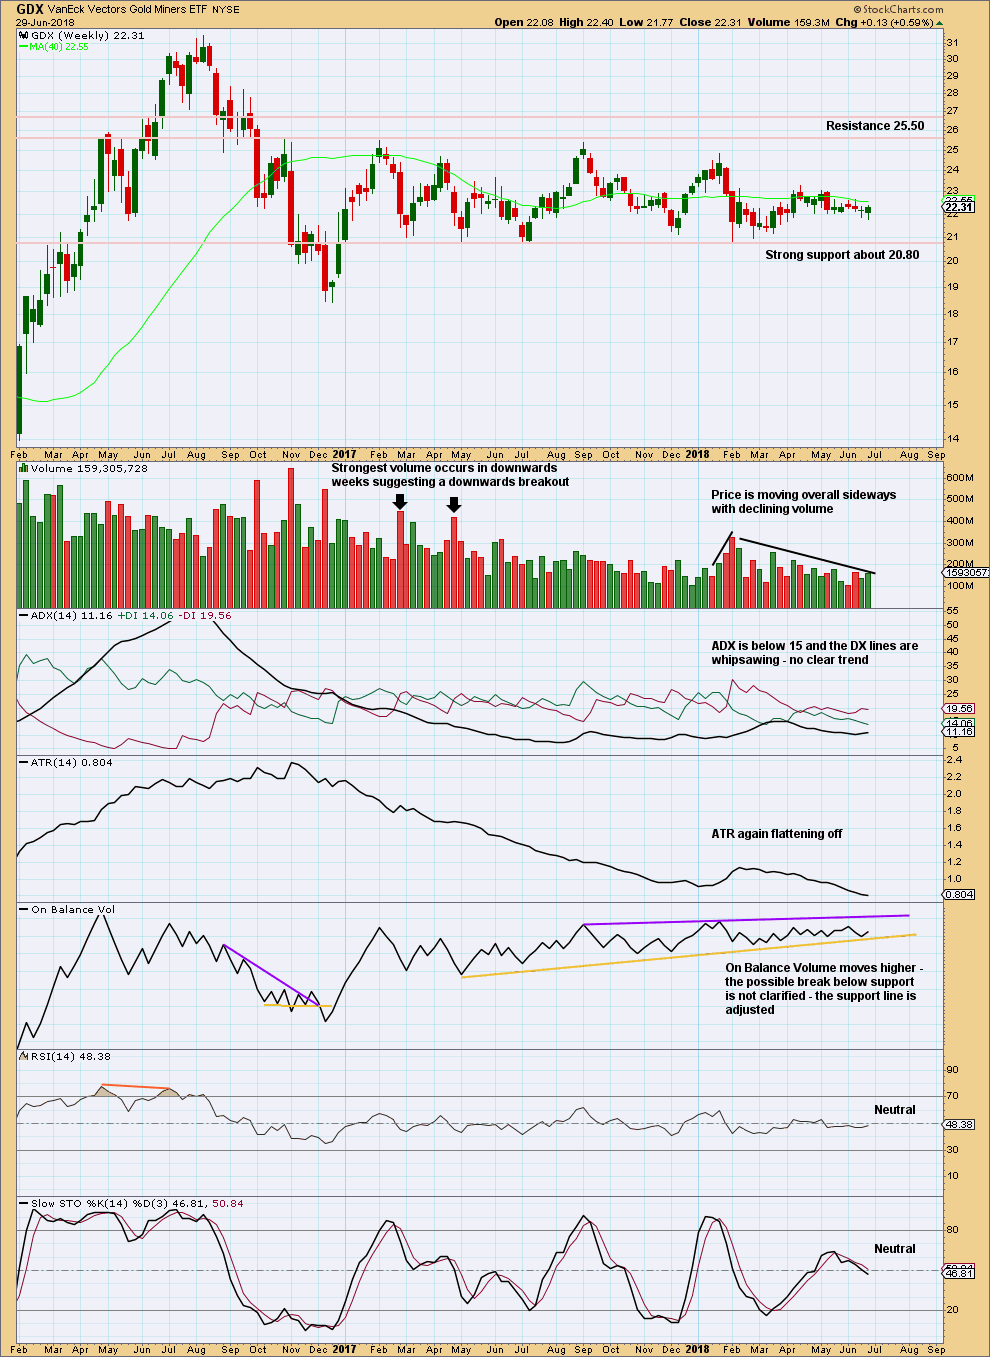
Click chart to enlarge. Chart courtesy of StockCharts.com.
Support about 20.80 has been tested about eight times and so far has held. The more often a support area is tested and holds, the more technical significance it has.
In the first instance, expect this area to continue to provide support. Only a strong downwards day, closing below support and preferably with some increase in volume, would constitute a downwards breakout from the consolidation that GDX has been in for a year now.
Resistance is about 25.50. Only a strong upwards day, closing above resistance and with support from volume, would constitute an upwards breakout.
An upwards week this week has some support from volume and a long lower wick. It looks likely that GDX may move higher next week.
GDX DAILY CHART
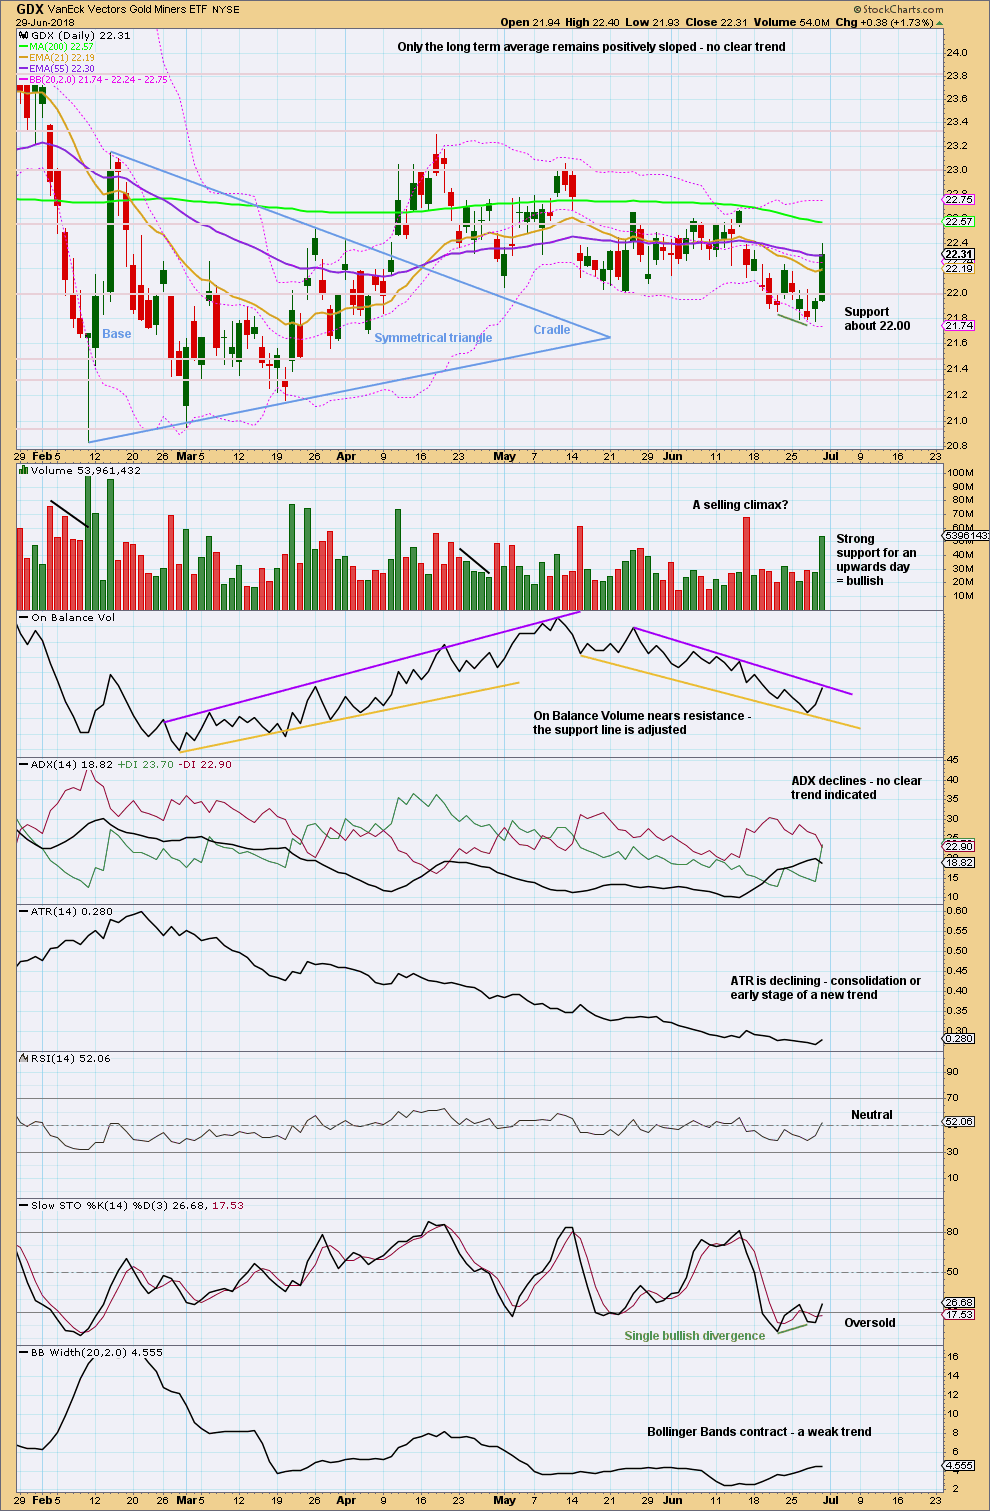
Click chart to enlarge. Chart courtesy of StockCharts.com.
With price returning back into what was noted as a descending triangle, the downwards breakout is proven false. The structure is not a descending triangle.
GDX is again range bound.
On Balance Volume may provide a signal for the short to mid term.
Published @ 03:40 a.m. EST on 30th June, 2018.
hourly chart updated:
the correction was over, on down now to the target
look out for a potential selling climax with very strong downwards movement in the next day or two
has anyone else got massive movements in gold and Oil?
Hi. Cant say about massive movement in gold and oil. But certainly when Gold price broke below 1306 some time ago I had in mind a downside target of 1278.8/1264.7. Gold price has since been there and done that and is presently in highly oversold territory but Imo looks unlikely for any reversal when occur to get past 1250-59 on a rebound with downside 1233-1225/1222.6 to still look out for. Who knows lol 🙂
Refreshing to read your comment after a long silence.
Thanks Syed!