

S&P 500
A small inside day, closing red, mostly fits the Elliott wave count for the short term.
Price remains above the invalidation point, which is very close by.
Summary: Upwards movement looks most likely next week. The short term target is about 2,844, where a larger pullback may develop.
Overall, an upwards trend is still expected to be developing.
The mid to longer term target is at 2,922 (Elliott wave) or 3,045 (classic analysis). Another multi week to multi month correction is expected at one of these targets.
The final target for this bull market to end remains at 3,616.
Pullbacks are an opportunity to join the trend.
Always practice good risk management. Always trade with stops and invest only 1-5% of equity on any one trade.
The biggest picture, Grand Super Cycle analysis, is here.
Last historic analysis with monthly charts is here, video is here.
ELLIOTT WAVE COUNT
WEEKLY CHART
Click chart to enlarge.
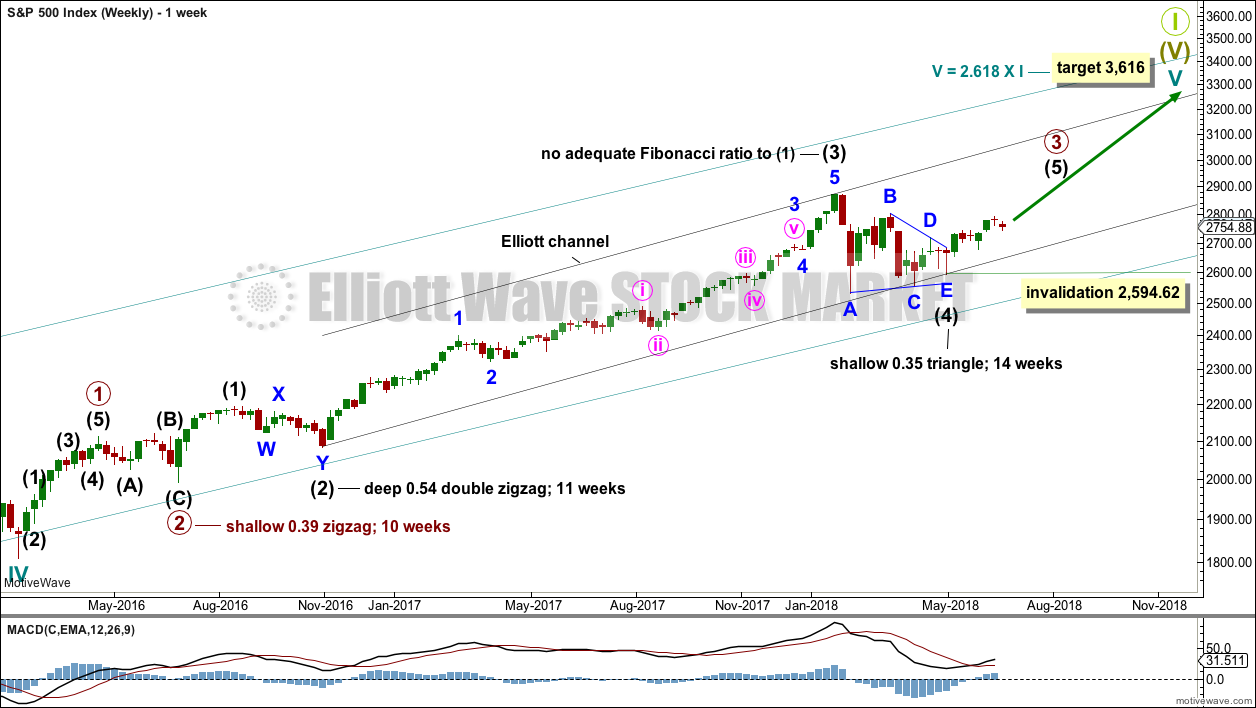
Cycle wave V must complete as a five structure, which should look clear at the weekly chart level and also now at the monthly chart level. It may only be an impulse or ending diagonal. At this stage, it is clear it is an impulse.
Within cycle wave V, the third waves at all degrees may only subdivide as impulses.
Intermediate wave (4) has breached an Elliott channel drawn using Elliott’s first technique. The channel is redrawn using Elliott’s second technique: the first trend line from the ends of intermediate waves (2) to (4), then a parallel copy on the end of intermediate wave (3). Intermediate wave (5) may end either midway within the channel, or about the upper edge.
Intermediate wave (4) may now be a complete regular contracting triangle lasting fourteen weeks, one longer than a Fibonacci thirteen. There is perfect alternation and excellent proportion between intermediate waves (2) and (4).
Within intermediate wave (5), no second wave correction may move beyond the start of its first wave below 2,594.62.
DAILY CHART
Click chart to enlarge.
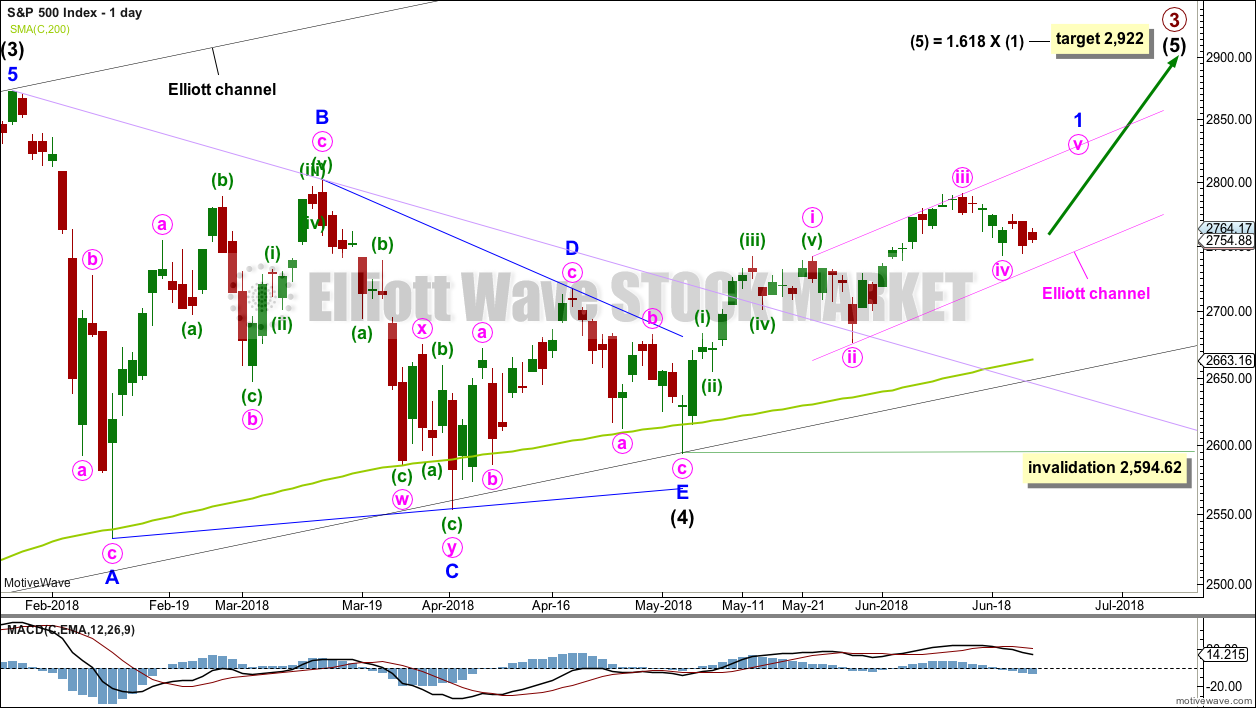
It is possible that intermediate wave (4) is a complete regular contracting triangle, the most common type of triangle. Minor wave E may have found support just below the 200 day moving average and ending reasonably short of the A-C trend line. This is the most common look for E waves of triangles.
Intermediate wave (3) exhibits no Fibonacci ratio to intermediate wave (1). It is more likely then that intermediate wave (5) may exhibit a Fibonacci ratio to either of intermediate waves (1) or (3). The most common Fibonacci ratio would be equality in length with intermediate wave (1), but in this instance that would expect a truncation. The next common Fibonacci ratio is used to calculate a target for intermediate wave (5) to end.
Price has clearly broken out above the upper triangle B-D trend line. This indicates that it should now be over if the triangle is correctly labelled.
A trend line in lilac is added to this chart. It is the same line as the upper edge of the symmetrical triangle on the daily technical analysis chart. Price found support about this line.
Minor wave 3 may only subdivide as an impulse, and within it the subdivisions of minute waves ii and iv may show up as one or more red daily candlesticks or doji.
The preferred way now to see upwards movement from the end of intermediate wave (4) is as an incomplete five wave impulse for minor wave 1. Within the impulse, minute wave iii is shorter than minute wave i by 32.96 points, which limits minute wave v to no longer than equality in length with minute wave iii at 2,857.85, so that minute wave iii is not the shortest actionary wave within the impulse and a core Elliott wave rule is met. A target for minute wave v to complete minor wave 1 may be about 2,844.
When minor wave 1 is a complete five wave impulse, then a longer lasting pullback for minor wave 2 may be expected. A breach of the Elliott channel about minor wave 1 by a full daily candlestick below and not touching the lower trend line would provide confidence that minor wave 1 should then be over and minor wave 2 should then have begun.
TECHNICAL ANALYSIS
WEEKLY CHART
Click chart to enlarge. Chart courtesy of StockCharts.com.
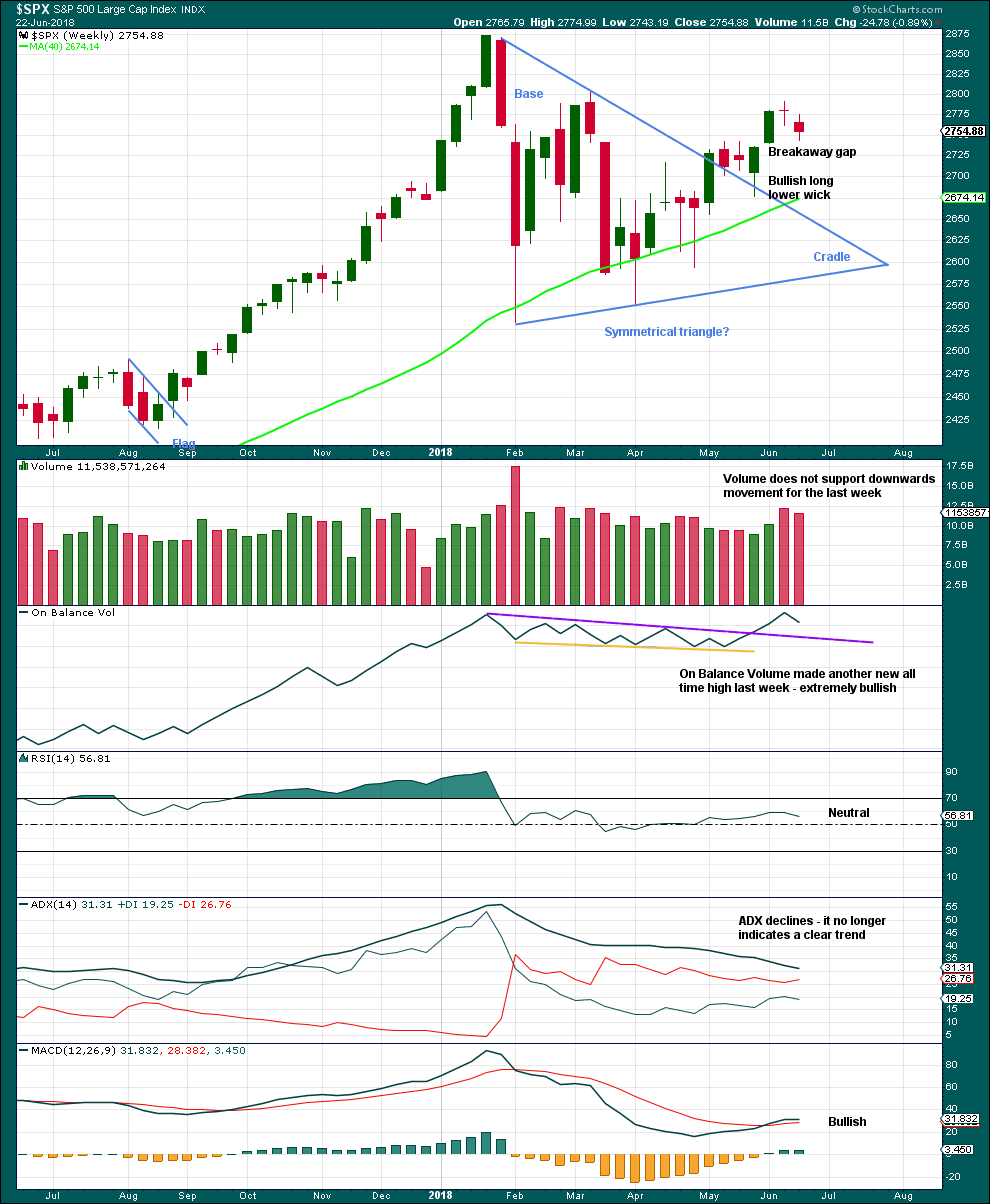
This week’s spinning top candlestick pattern again signals a balance of bulls and bears this week. With volume not supporting downwards movement this week, it looks like bears may be tiring.
This chart is very bullish.
DAILY CHART
Click chart to enlarge. Chart courtesy of StockCharts.com.
The symmetrical triangle may now be complete. The base distance is 340.18. Added to the breakout point of 2,704.54 this gives a target at 3,044.72. This is above the Elliott wave target at 2,922, so the Elliott wave target may be inadequate.
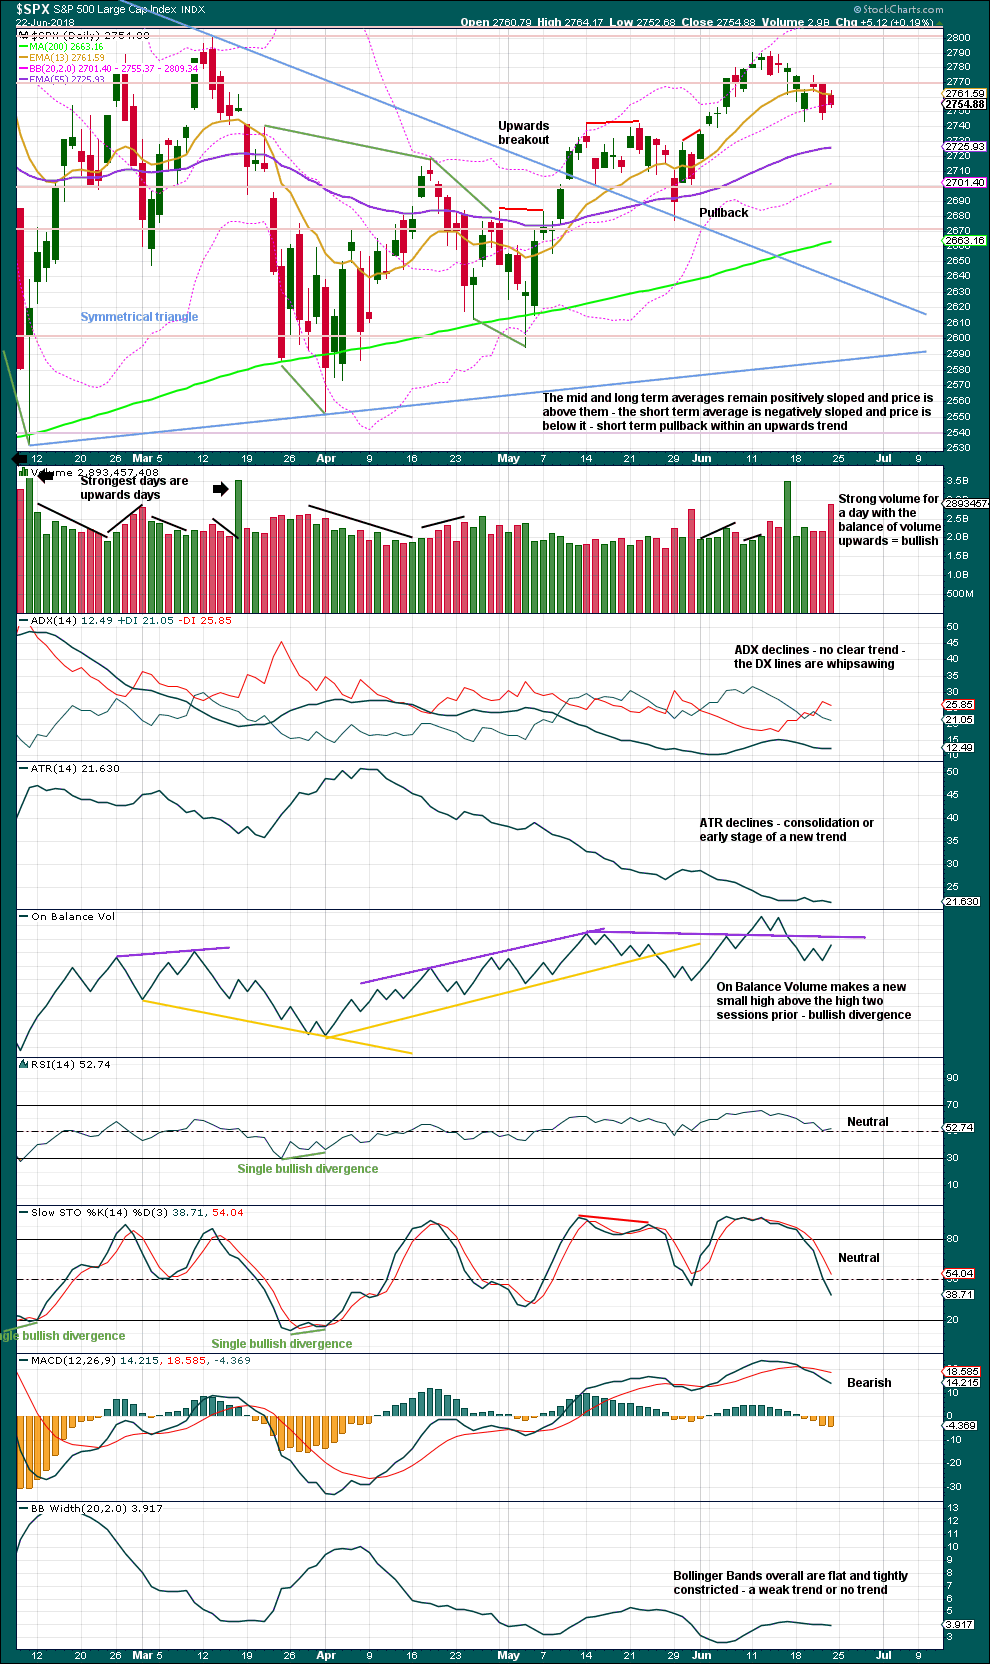
The balance of volume for Friday was upwards and the candlestick was an inside day. Volume strongly supported upwards movement during Friday’s session.
With Stochastics now well back into neutral territory, there is again plenty of room now for price to continue higher.
VOLATILITY – INVERTED VIX CHART
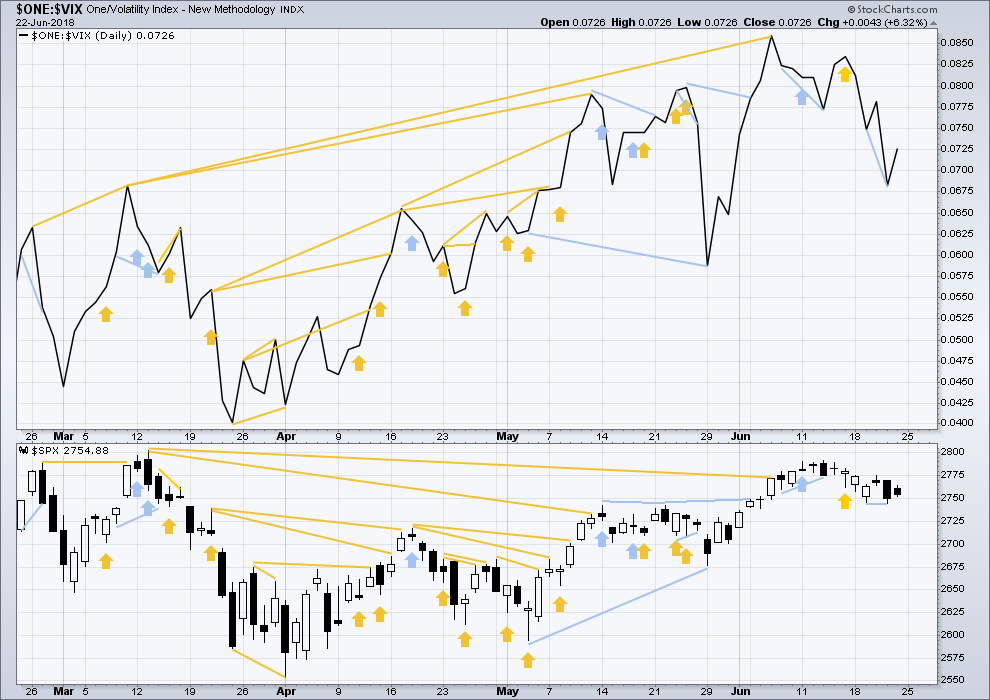
Click chart to enlarge. Chart courtesy of StockCharts.com. So that colour blind members are included, bearish signals
will be noted with blue and bullish signals with yellow.
Normally, volatility should decline as price moves higher and increase as price moves lower. This means that normally inverted VIX should move in the same direction as price.
Inverted VIX has made a new high above the prior swing high of the 9th of March, but price has not made a corresponding new swing high about the same point yet. This divergence is bullish. Inverted VIX is still a little way off making a new all time high.
Bearish divergence noted in last analysis between price and inverted VIX has now been followed by one red daily candlestick. It may now be resolved, or it may need another downwards day to resolve it. There is no new divergence for Friday.
BREADTH – AD LINE
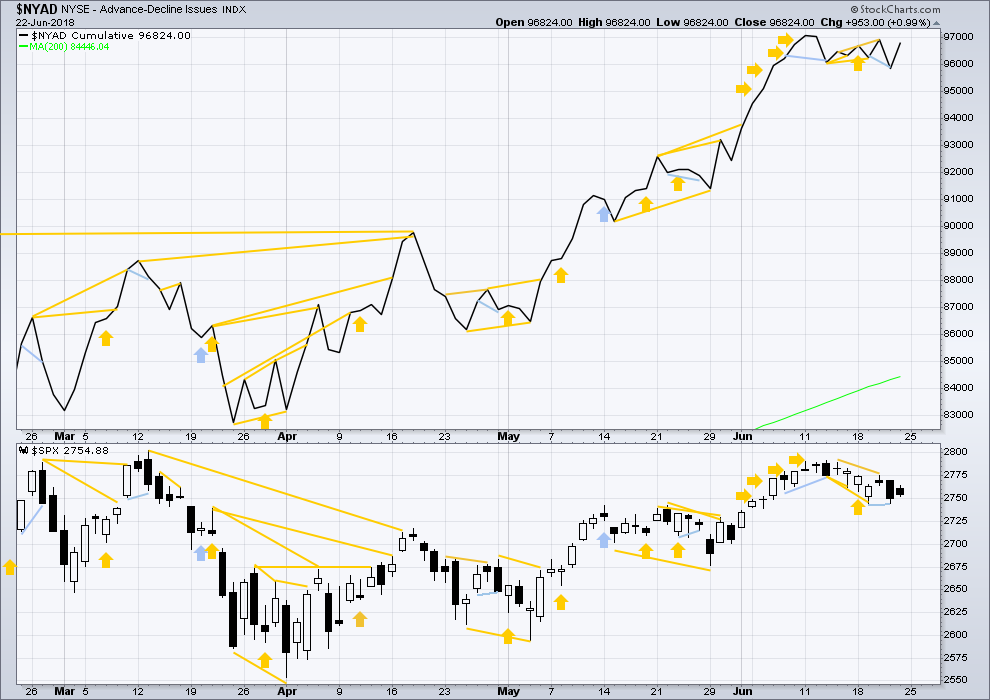
Click chart to enlarge. Chart courtesy of StockCharts.com.
There is normally 4-6 months divergence between price and market breadth prior to a full fledged bear market. This has been so for all major bear markets within the last 90 odd years. With no longer term divergence yet at this point, any decline in price should be expected to be a pullback within an ongoing bull market and not necessarily the start of a bear market. New all time highs from the AD line means that any bear market may now be an absolute minimum of 4 months away. It may of course be a lot longer than that. My next expectation for the end of this bull market may now be October 2019.
Small caps and mid caps have both recently made new all time highs. It is large caps that usually lag in the latter stages of a bull market, so this perfectly fits the Elliott wave count. Expect large caps to follow to new all time highs.
Breadth should be read as a leading indicator.
Bearish divergence noted in last analysis between price and the AD line has now been followed by a red daily candlestick. It may now be resolved, or it may need another downwards day to resolve it. There is no new divergence for Friday.
Overall, the AD line still remains mostly bullish as it has made more than one new all time high last week. Price may reasonably be expected to follow through in coming weeks.
DOW THEORY
The following lows need to be exceeded for Dow Theory to confirm the end of the bull market and a change to a bear market:
DJIA: 23,360.29.
DJT: 9,806.79.
S&P500: 2,532.69.
Nasdaq: 6,630.67.
Only Nasdaq at this stage is making new all time highs. DJIA and DJT need to make new all time highs for the ongoing bull market to be confirmed.
GOLD
A small bounce was expected for Friday. A small green daily candlestick moves price slightly higher, fitting expectations.
Summary: The triangle wave count is now preferred. Next week may begin with a small bounce up to about 1,279, which may last a very few days. Thereafter, look for overall downwards movement over the next few weeks to a target at 1,216 – 1,211 as fairly likely.
The zigzag wave count will be discarded if price prints a full daily candlestick below the black (2)-(4) trend line on the zigzag’s daily chart.
For the short term, look for a bounce here. A downwards trend is now in place. Bounces are an opportunity to join the trend. The bounce may end about either 1,279 (more likely) or 1,290 (slightly less likely).
The target for this downwards wave is 1,216, and downwards movement may be limited to no lower than 1,123.08.
Always trade with stops to protect your account. Risk only 1-5% of equity on any one trade.
Grand SuperCycle analysis is here.
Last historic analysis with several monthly and weekly charts is here, video is here.
At this time, for the main monthly wave count, there are four weekly wave counts looking at cycle wave b as four different possible structures. Only two shall be published each day, one bearish and one bullish.
WEEKLY CHART – TRIANGLE
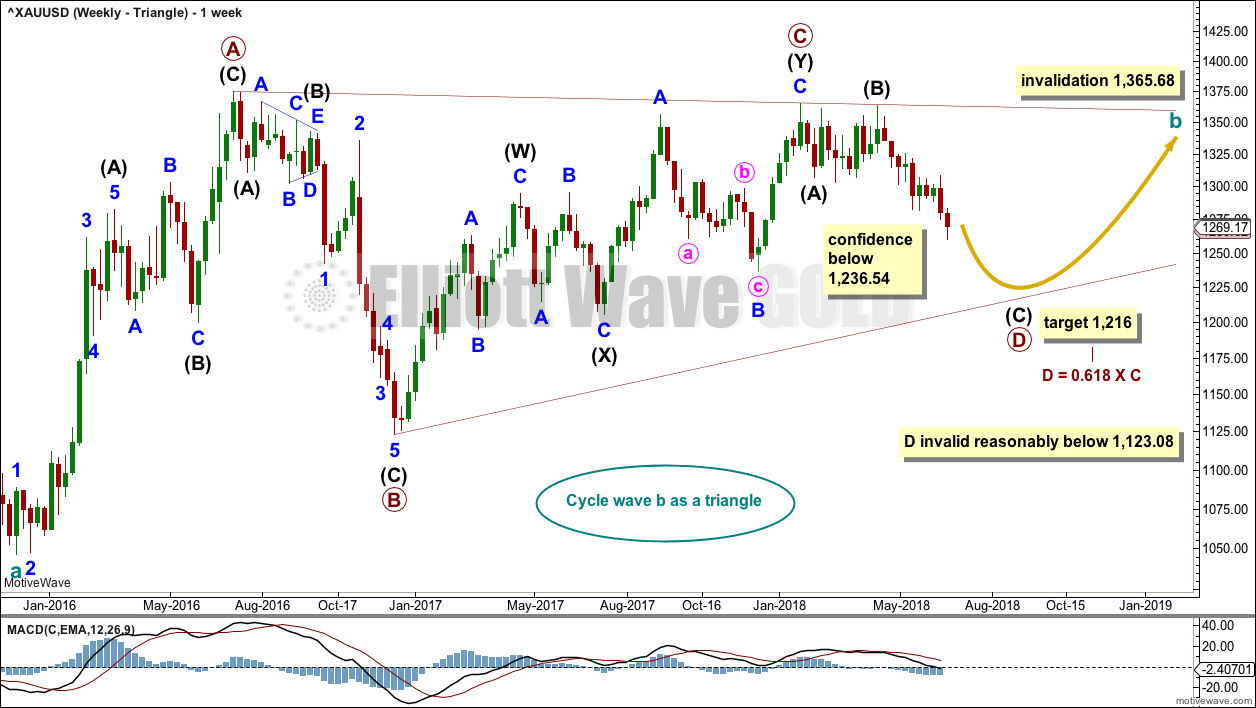
Click chart to enlarge.
It is possible that cycle wave b may be an incomplete triangle. The triangle may be a contracting or barrier triangle, with a contracting triangle looking much more likely because the A-C trend line does not have a strong slope. A contracting triangle could see the B-D trend line have a stronger slope, so that the triangle trend lines converge at a reasonable rate. A barrier triangle would have a B-D trend line that would be essentially flat, and the triangle trend lines would barely converge.
Within a contracting triangle, primary wave D may not move beyond the end of primary wave B below 1,123.08. Within a barrier triangle, primary wave D may end about the same level as primary wave B at 1,123.08, so that the B-D trend line is essentially flat. Only a new low reasonably below 1,123.08 would invalidate the triangle.
Within both a contracting and barrier triangle, primary wave E may not move beyond the end of primary wave C above 1,365.68.
Four of the five sub-waves of a triangle must be zigzags, with only one sub-wave allowed to be a multiple zigzag. Primary wave C is the most common sub-wave to subdivide as a multiple, and this is how primary wave C for this example fits best.
Primary wave D must be a single structure, most likely a zigzag.
One triangle sub-wave tends to be close to 0.618 the length of its predecessor; this gives a target for primary wave D.
There are no problems in terms of subdivisions or rare structures for this wave count. It has an excellent fit and so far a typical look.
DAILY CHART – TRIANGLE
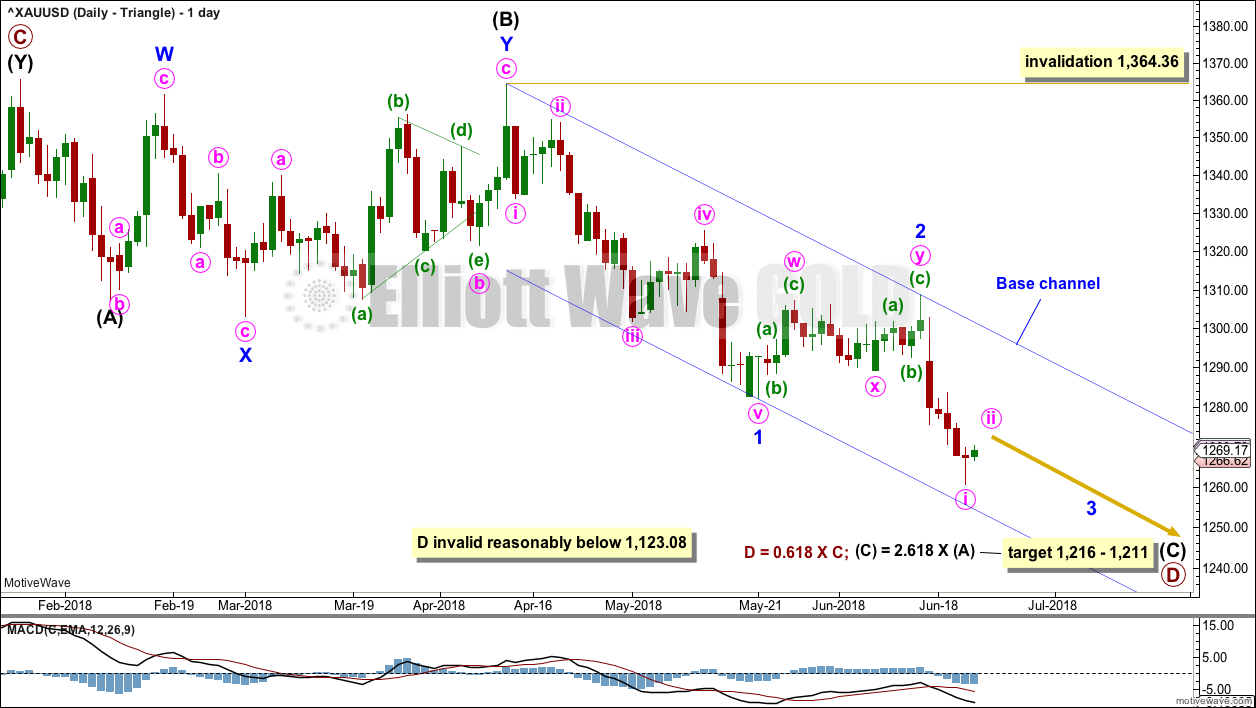
Click chart to enlarge.
Primary wave D may be unfolding lower as a single zigzag, and within it intermediate waves (A) and (B) may be complete.
The target is widened to a $5 zone calculated at two degrees. This should have a reasonable probability.
Within intermediate wave (C), it looks likely that minor wave 2 may now be over. However, it would have been shallow. It is possible that minor wave 2 may continue further as a flat correction. If minor wave 2 moves higher, it may not move beyond the start of minor wave 1 above 1,364.36.
This wave count now expects to see an increase in downwards momentum as a third wave unfolds.
Another bearish signal from On Balance Volume increases the probability of this wave count (or any bearish wave count). This wave count at this time will be the preferred wave count.
Add a base channel about minor waves 1 and 2. Along the way down, bounces for lower degree second wave corrections may be expected to find resistance at the upper edge of the base channel.
WEEKLY CHART – ZIGZAG
Click chart to enlarge.
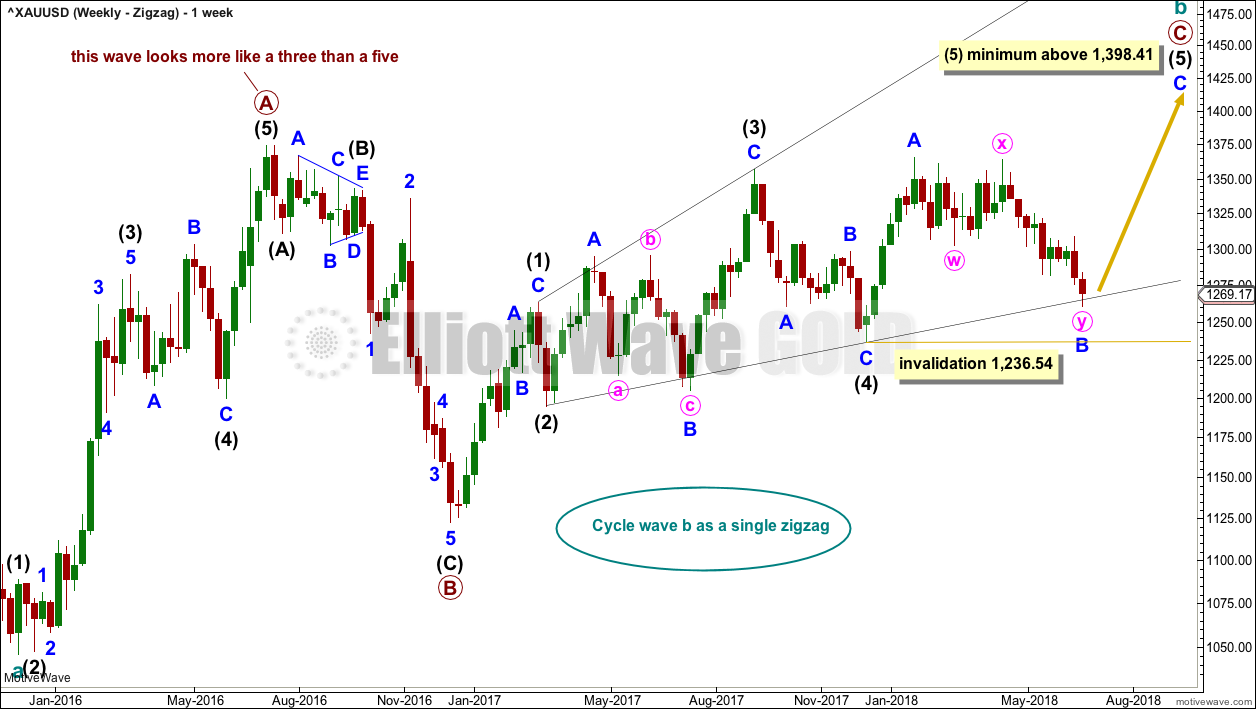
Cycle wave b may be a single zigzag. Zigzags subdivide 5-3-5. Primary wave C must subdivide as a five wave structure and may be either an impulse or an ending diagonal. Overlapping at this stage indicates an ending diagonal.
Within an ending diagonal, all sub-waves must subdivide as zigzags. Intermediate wave (4) must overlap into intermediate wave (1) price territory. This diagonal is expanding: intermediate wave (3) is longer than intermediate wave (1) and intermediate wave (4) is longer than intermediate wave (2). Intermediate wave (5) must be longer than intermediate wave (3), so it must end above 1,398.41 where it would reach equality in length with intermediate wave (3).
Within the final zigzag of intermediate wave (5), minor wave B may not move beyond the start of minor wave A below 1,236.54. However, if it were now to turn out to be relatively deep, it should not get too close to this invalidation point as the lower (2)-(4) trend line should provide strong support. Diagonals normally adhere very well to their trend lines. If the (2)-(4) trend line is breached by a full daily candlestick below and not touching it, then this wave count will be discarded in favour of the triangle weekly wave count.
Within the diagonal of primary wave C, each sub-wave is extending in price and so may also do so in time. Within each zigzag, minor wave B may exhibit alternation in structure and may show an increased duration.
Within intermediate wave (1), minor wave B was a triangle lasting 11 days. Within intermediate wave (3), minor wave B was a regular flat lasting 60 days. Intermediate wave (5) is expected to be longer in price than intermediate wave (3), and it may also be longer in duration, and so minor wave B within it may also be longer in duration.
This weekly chart sees the upwards wave labelled primary wave A as a five wave structure. It must be acknowledged that this upwards wave looks better as a three than it does as a five.
DAILY CHART
Click chart to enlarge.
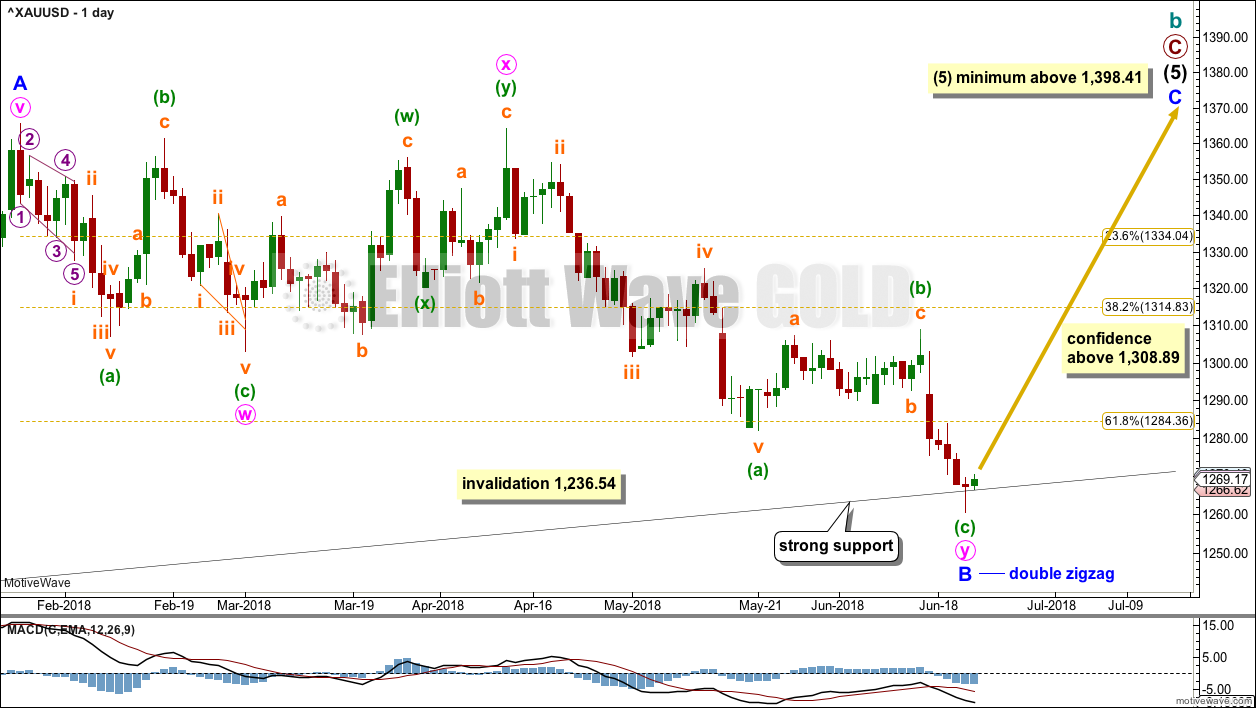
Minor wave B may be a double zigzag, which may now be complete.
The first zigzag in the double is labelled minute wave w. The double is joined by a three in the opposite direction, a double zigzag labelled minute wave x. The second zigzag in the double is labelled minute wave y, and it is deepening the correction, which is the purpose of second zigzags.
Minute wave y may end at support at the lower black (2)-(4) trend line, which is copied over here from the weekly chart. This is the lower diagonal trend line.
Thursday’s candlestick has a long lower wick overshooting the (2)-(4) trend line. This is acceptable for this wave count, but a breach of this line is not. If a full daily candlestick prints below the line and does not touch it, then this wave count will be discarded.
TECHNICAL ANALYSIS
WEEKLY CHART
Click chart to enlarge. Chart courtesy of StockCharts.com.
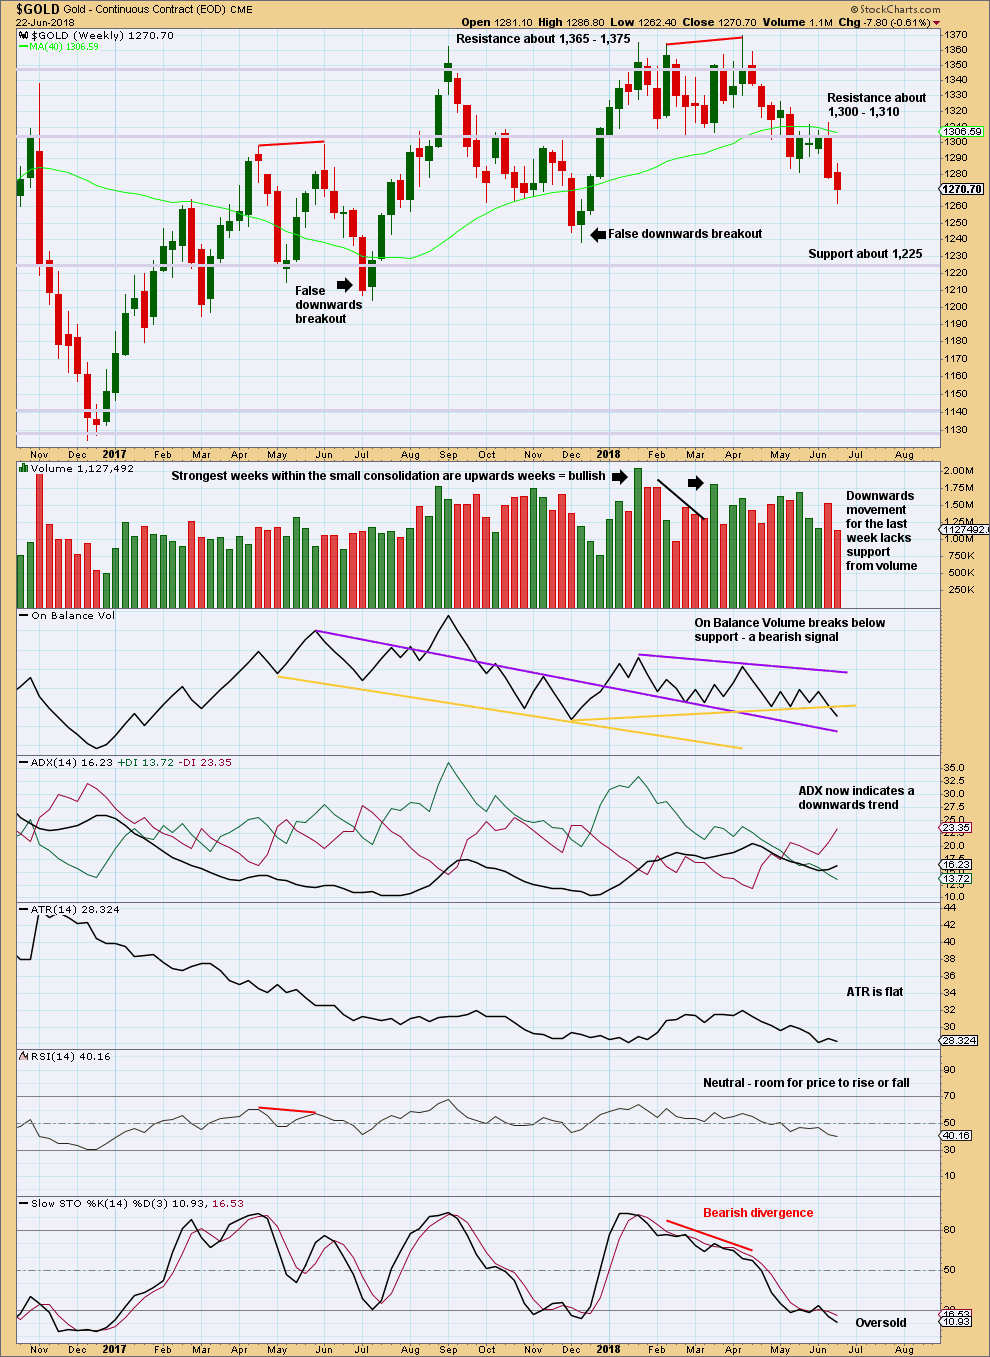
On Balance Volume gives a reasonable bearish signal this week. The yellow support line, which is breached, has reasonable technical significance: it is reasonably long held, has been tested at least three times before, and has a shallow slope. This supports the new Elliott wave count, which expects more downwards movement from price here.
Stochastics may remain oversold for several weeks when Gold has a strong bear trend. There is a good example of this on the left hand side of the chart. Only would Stochastics indicate an end to the trend when it has been oversold and then exhibits bullish divergence with price. That is not the case here.
DAILY CHART
Click chart to enlarge. Chart courtesy of StockCharts.com.
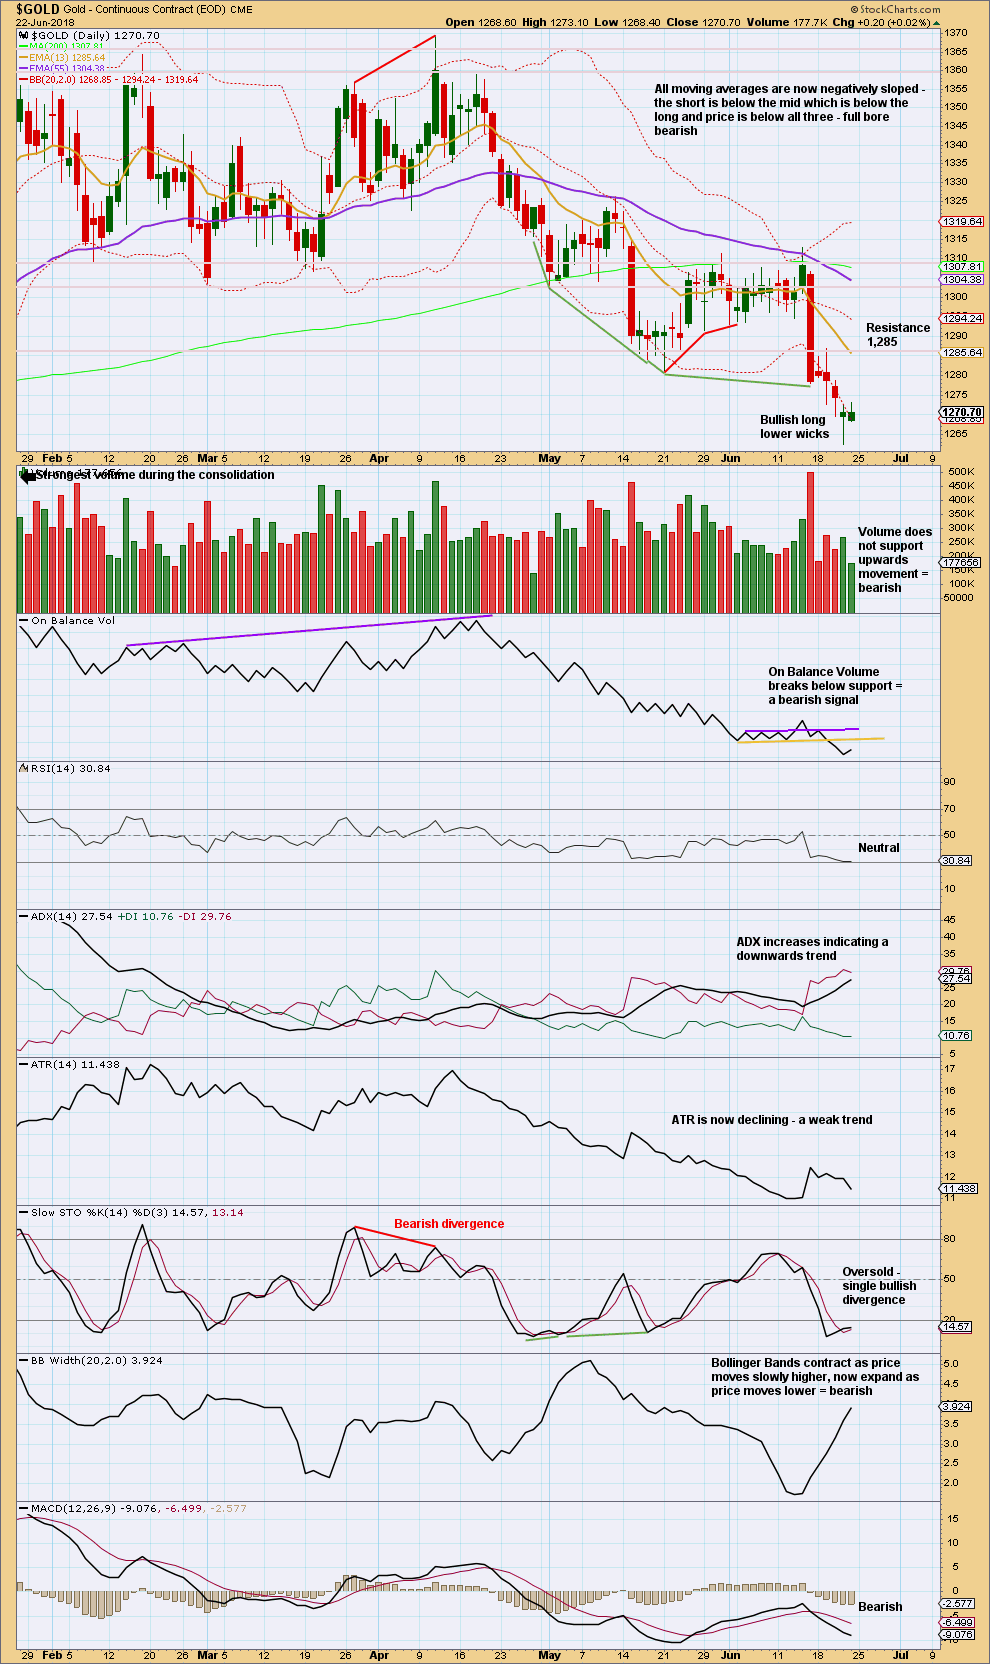
With a bearish signal from On Balance Volume at the weekly chart level, it now looks like the downwards breakout this time may be true and not false.
The long lower candlestick wick from Thursday is bullish for the short term. Expect a small bounce here. Resistance is about 1,285.
On Balance Volume at the daily chart level remains bearish and supports the new Elliott wave count.
GDX WEEKLY CHART
Click chart to enlarge. Chart courtesy of StockCharts.com.
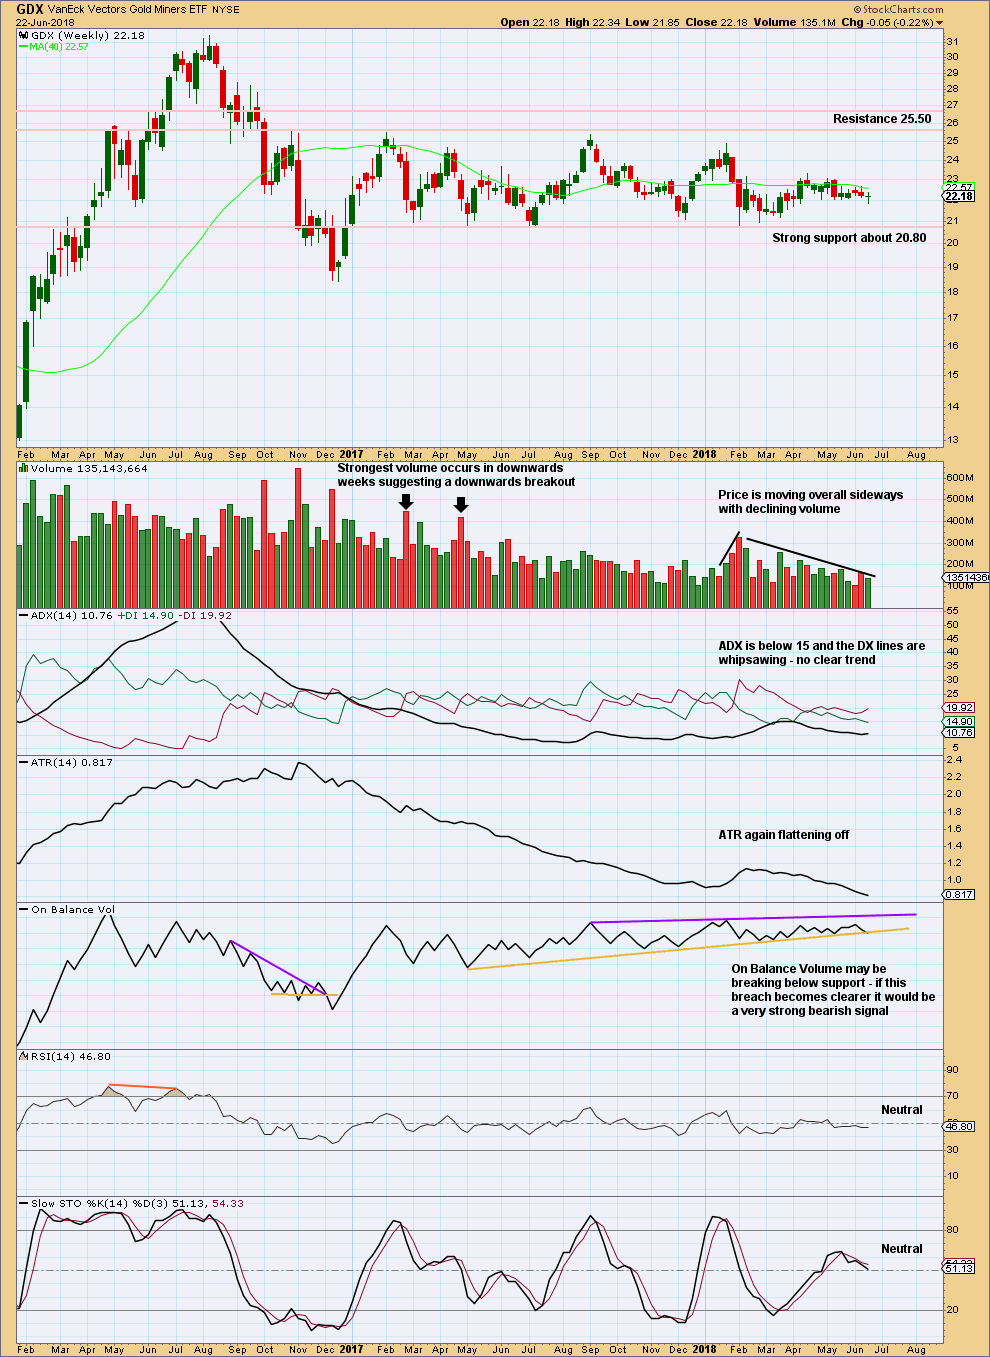
Support about 20.80 has been tested about eight times and so far has held. The more often a support area is tested and holds, the more technical significance it has.
In the first instance, expect this area to continue to provide support. Only a strong downwards day, closing below support and preferably with some increase in volume, would constitute a downwards breakout from the consolidation that GDX has been in for a year now.
Resistance is about 25.50. Only a strong upwards day, closing above resistance and with support from volume, would constitute an upwards breakout.
A downwards week this week completes a small green doji. Overall, this is neutral.
The yellow support line on On Balance Volume has a reasonable slope, but it is very long held and has been tested multiple times. This line has very strong technical significance. If it is clearly breached next week, that would provide a very strong bearish signal for GDX.
GDX DAILY CHART
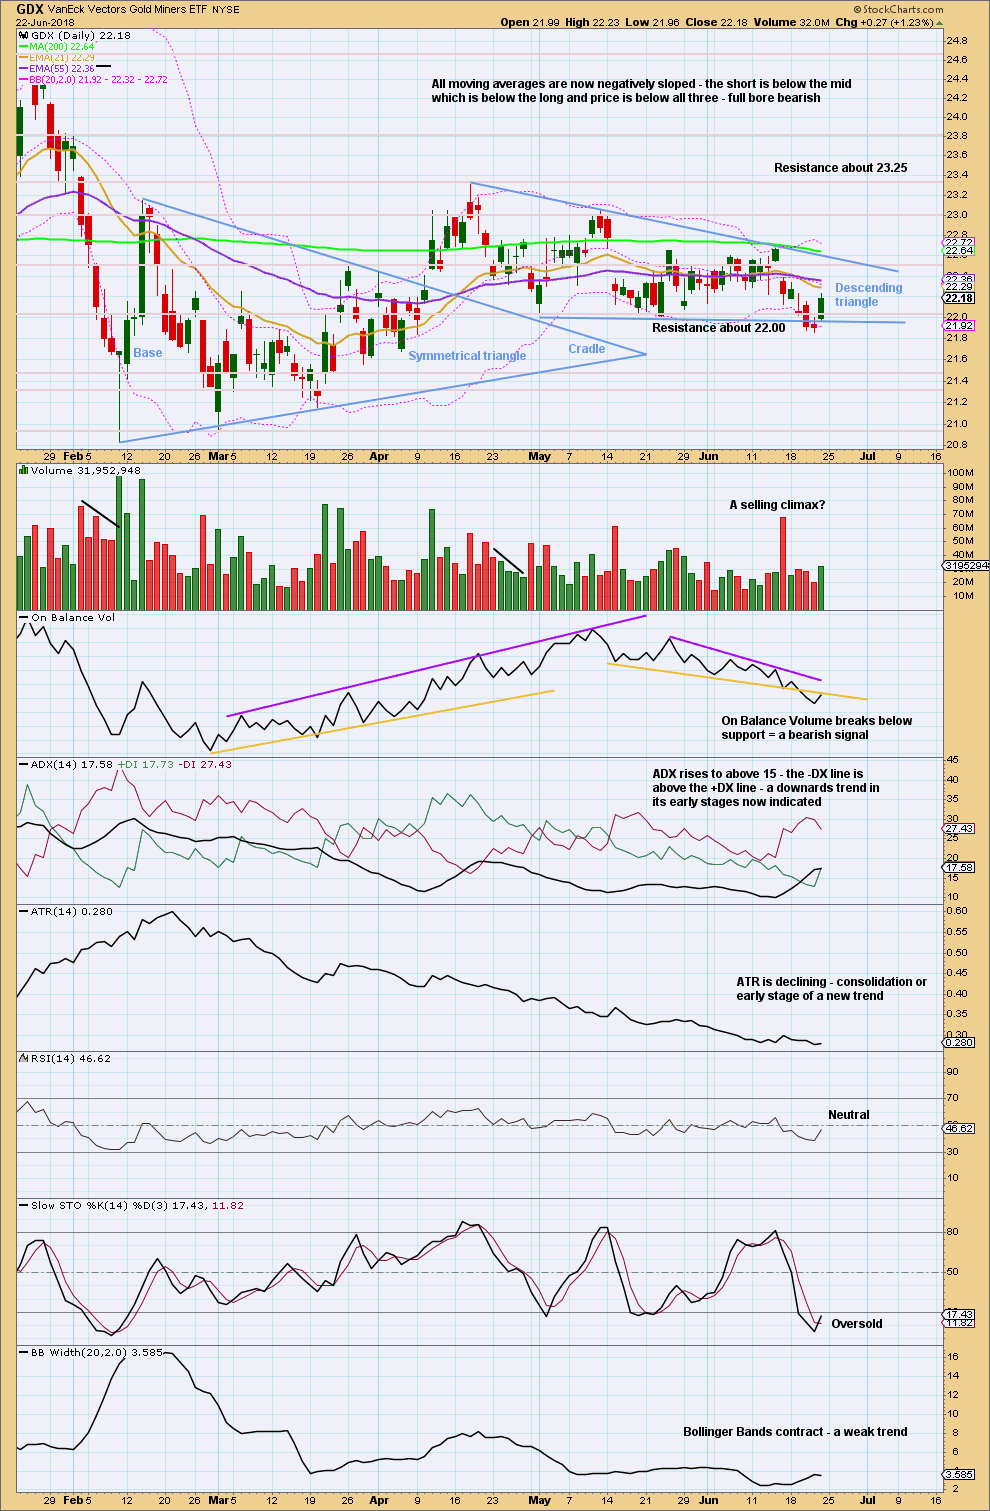
Click chart to enlarge. Chart courtesy of StockCharts.com.
With price returning back above the support line of the descending triangle, Thursday’s breakout is now false.
On Balance Volume is bearish at the daily chart level.
Overall, this chart is bearish to neutral.
US OIL
Last analysis expected that US Oil had entered a large consolidation, with support about 61.0 and resistance about 72.5 to 73.0. Price remains within this zone, beginning now to swing up to resistance.
Summary: A deeper and longer lasting consolidation may have begun, which may last about 13 to 21 weeks in total. It should remain above 55.24, and the target is about 61.12. The consolidation will not move in a straight line; it may swing from resistance to support and back again in large swings. Once resistance and support are identified, then a swing trading system may be employed by more experienced traders. Support may now be about 63.0 and resistance may be as high as 72.5 to 73.0.
Always practice good risk management as the most important aspect of trading. Always trade with stops and invest only 1-5% of equity on any one trade. Failure to manage risk is the most common mistake new traders make.
MAIN WAVE COUNT
MONTHLY CHART
Click chart to enlarge.
It is possible that the bear market for Oil is over and a new bull market is in the very early stages.
A huge zigzag down to the last low may be complete and is labelled here Super Cycle wave (II).
Cycle wave b must be seen as complete in August 2013 for this wave count to work. It cannot be seen as complete at the prior major swing high in May 2011.
Cycle wave b is seen as a zigzag, and within it primary wave B is seen as a running contracting triangle. These are fairly common structures, although nine wave triangles are uncommon. All subdivisions fit.
Primary wave C moves beyond the end of primary wave A, so it avoids a truncation. But it does not have to move above the price territory of primary wave B to avoid a truncation, which is an important distinction.
If cycle wave b begins there, then cycle wave c may be seen as a complete five wave impulse.
Super Cycle wave (III) must move beyond the end of Super Cycle wave (I). It must move far enough above that point to allow room for a subsequent Super Cycle wave (IV) to unfold and remain above Super Cycle wave (I) price territory.
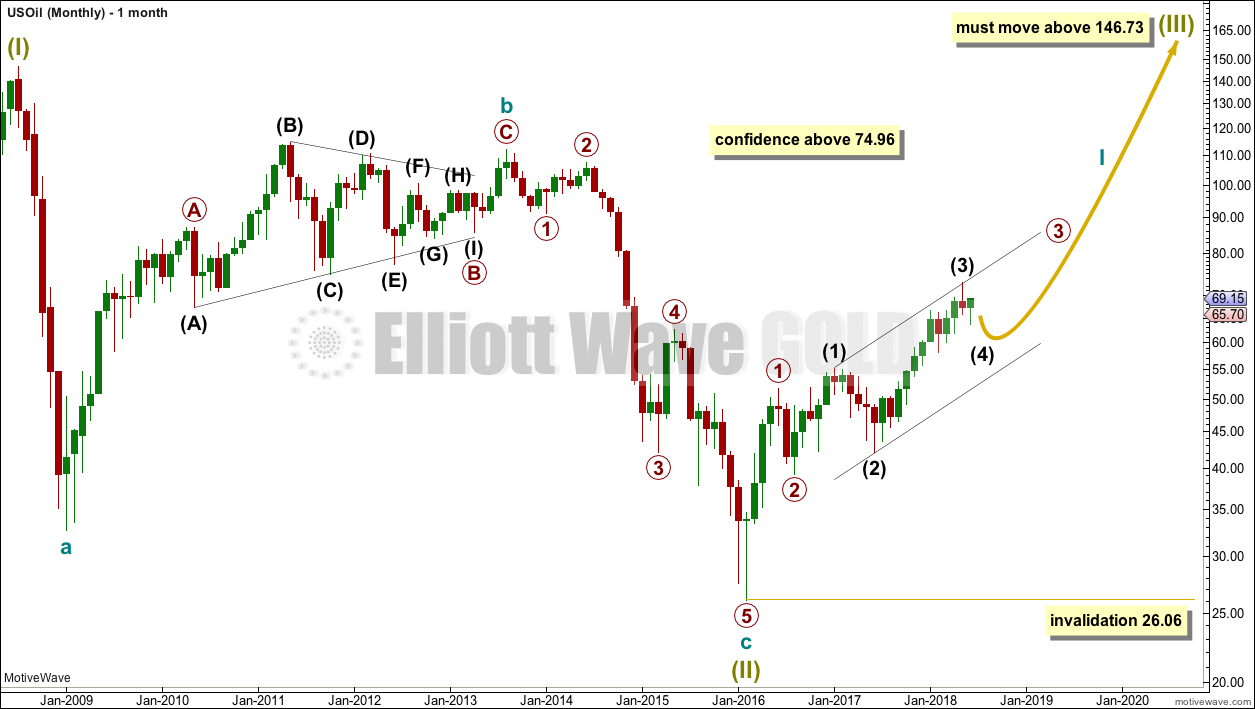
Cycle wave I may be incomplete. It may be unfolding as an impulse and may have now moved through the middle portion. Commodities have a tendency to exhibit swift strong fifth waves, and this tendency is especially prevalent for third wave impulses. Intermediate wave (5) to end primary wave 3 may be very swift and strong, ending with a blow off top.
When cycle wave I is complete, then cycle wave II may be a deep correction that may not move beyond the start of cycle wave I below 26.06.
Data from FXCM for USOil does not go back to the beginning of Super Cycle wave (I). Without an accurate known length of Super Cycle wave (I) a target cannot be calculated for Super Cycle wave (III) to end using Fibonacci ratios. The target for Super Cycle wave (III) may be calculated when cycle waves I, II, III and IV within it are complete. That cannot be done for many years.
WEEKLY CHART
Click chart to enlarge.
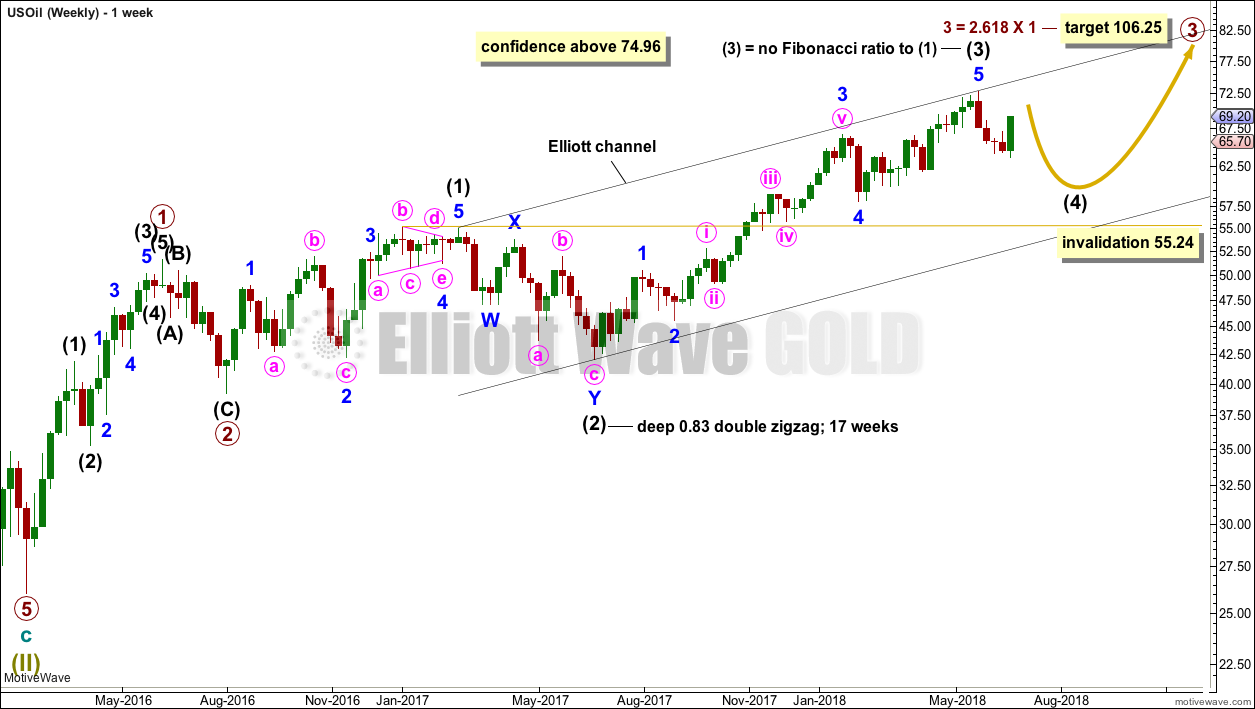
Intermediate wave (3) may now be complete. There is no Fibonacci ratio between intermediate waves (1) and (3), and intermediate wave (3) is longer than 1.618 the length of intermediate wave (1).
This wave count fits with classic technical analysis at the monthly and daily chart levels.
Intermediate wave (2) was a deep double zigzag. Given the guideline of alternation, intermediate wave (4) may be expected to most likely be a shallow flat, triangle or combination. It may be about even in duration with intermediate wave (2), or it may be a little longer because triangles and combinations are more time consuming structures.
In the first instance, a Fibonacci 13 weeks may be expected for intermediate wave (4). If about that time the structure is incomplete, then the next Fibonacci number in the sequence at 21 will be expected.
Intermediate wave (4) may find support about the lower edge of the black Elliott channel. It may end within the price territory of the fourth wave of one lesser degree; minor wave 4 has its territory from 66.65 to 59.13.
DAILY CHART
Click chart to enlarge.
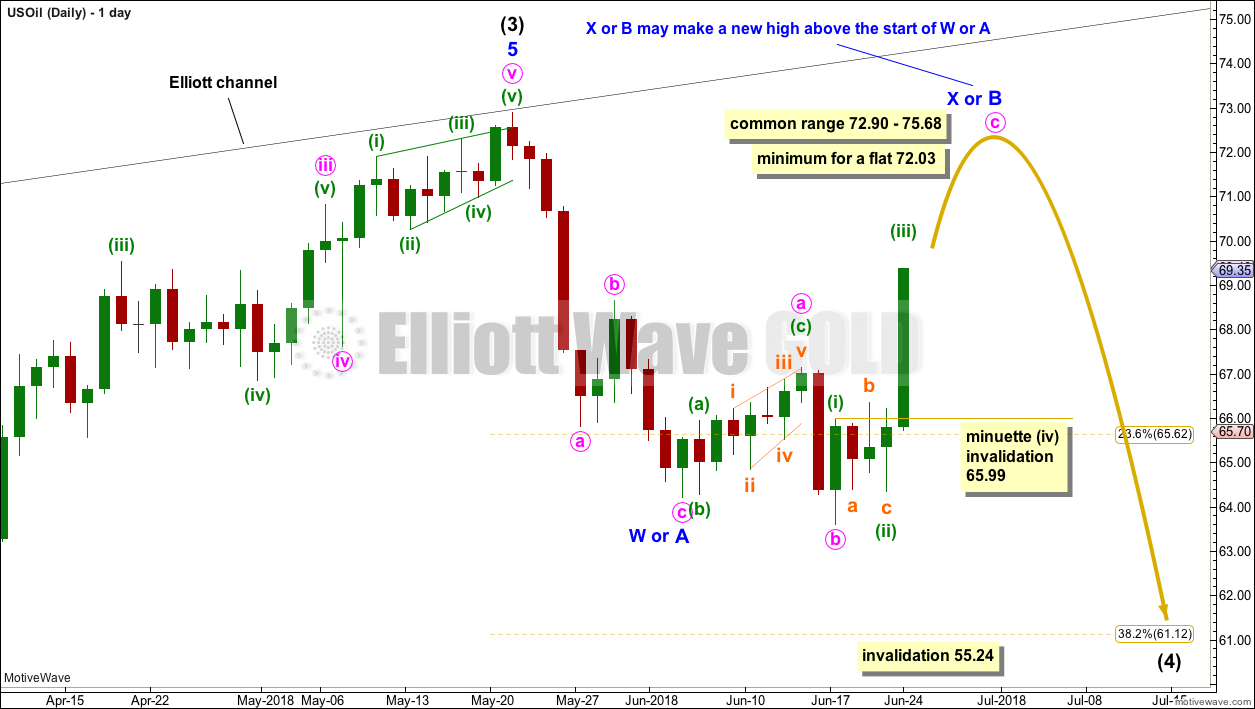
If intermediate wave (4) unfolds as a double combination, flat or triangle, then the first wave down within it would be a three wave structure and most likely a zigzag.
All of a flat, combination or triangle may have within them a new high above the start of intermediate wave (4) at 72.90 as in an expanded flat, running triangle or wave X of a double combination. There can be no upper invalidation point for this reason.
This analysis will require alternate daily wave counts over the next few weeks. It is impossible at this stage to tell which of several possible structures intermediate wave (4) may be, only that it is least likely to be a single or multiple zigzag. Focus will be on identifying when intermediate wave (4) may be over.
Strong upwards movement to end this week shows that the last wave down is a completed zigzag. The zigzag down may be minor wave A within a flat or triangle for intermediate wave (4), or it may be a zigzag within a double combination for intermediate wave (4).
The movement labelled minor wave B or X looks like an incomplete expanded flat correction that is likely to move higher next week; along the way up, there may be another small consolidation for minuette wave (iv) that must remain above minuette wave (i) price territory.
If intermediate wave (4) is unfolding as a flat correction, then within it minor wave B must retrace a minimum 0.9 length of minor wave A.
If intermediate wave (4) is unfolding as a triangle, then there is no minimum requirement for minor wave B within it.
If intermediate wave (4) is unfolding as a combination, then there is no minimum nor maximum length required for minor wave X.
The labelling within intermediate wave (4) may need to be moved down one degree in coming weeks. This movement so far may only be the start of minor wave A or W as a flat correction.
Intermediate wave (4) may not move into intermediate wave (1) price territory below 55.24.
ALTERNATE WAVE COUNT
MONTHLY CHART
Click chart to enlarge.
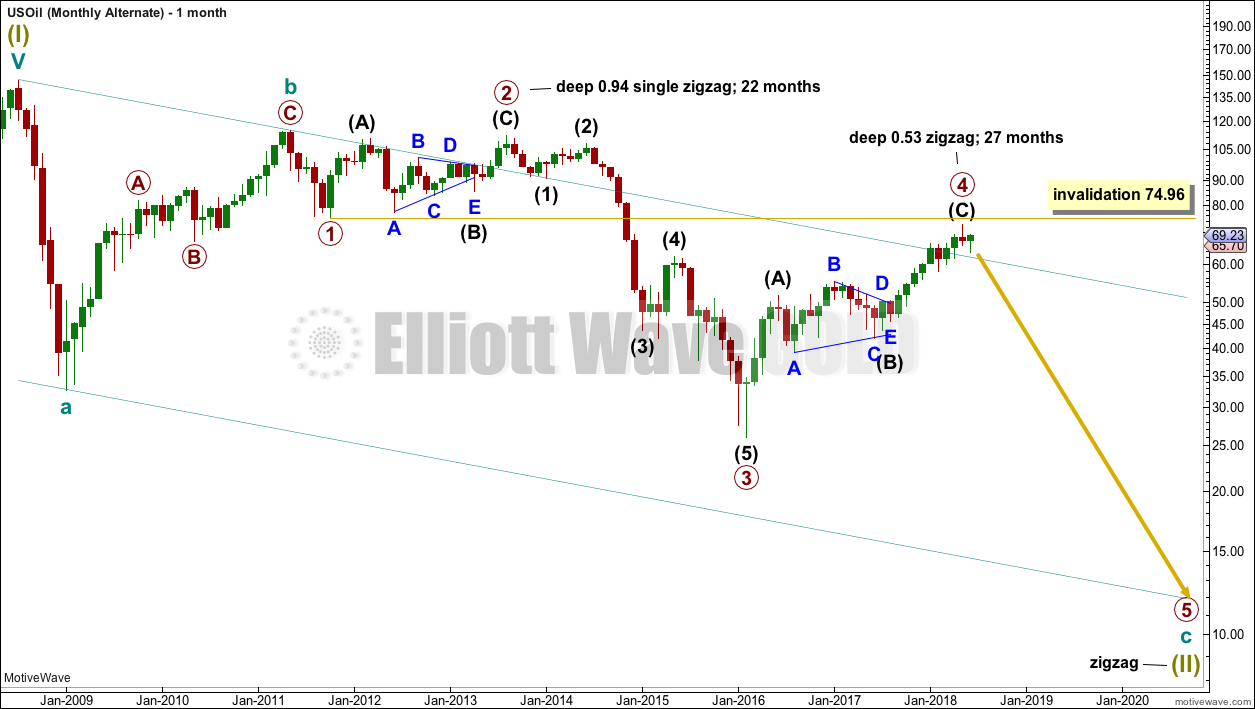
Within the bear market, cycle wave b is seen as ending in May 2011. Thereafter, a five wave structure downwards for cycle wave c begins.
Primary wave 1 is a short impulse lasting five months. Primary wave 2 is a very deep 0.94 zigzag lasting 22 months. Primary wave 3 is a complete impulse with no Fibonacci ratio to primary wave 1. It lasted 30 months.
There is now little alternation in depth between primary waves 2 and 4. Primary wave 2 is very deep, but primary wave 4 is also now deep. There is inadequate alternation in structure, both are zigzags. The lack of alternation in this wave count must reduce its probability. So far primary wave 4 has lasted 27 months. At this stage, there is still reasonable proportion between primary waves 2 and 4.
Primary wave 4 may not move into primary wave 1 price territory above 74.96.
The wider Elliott channel (teal) about this whole movement may offer support to primary wave 5.
WEEKLY CHART
Click chart to enlarge.
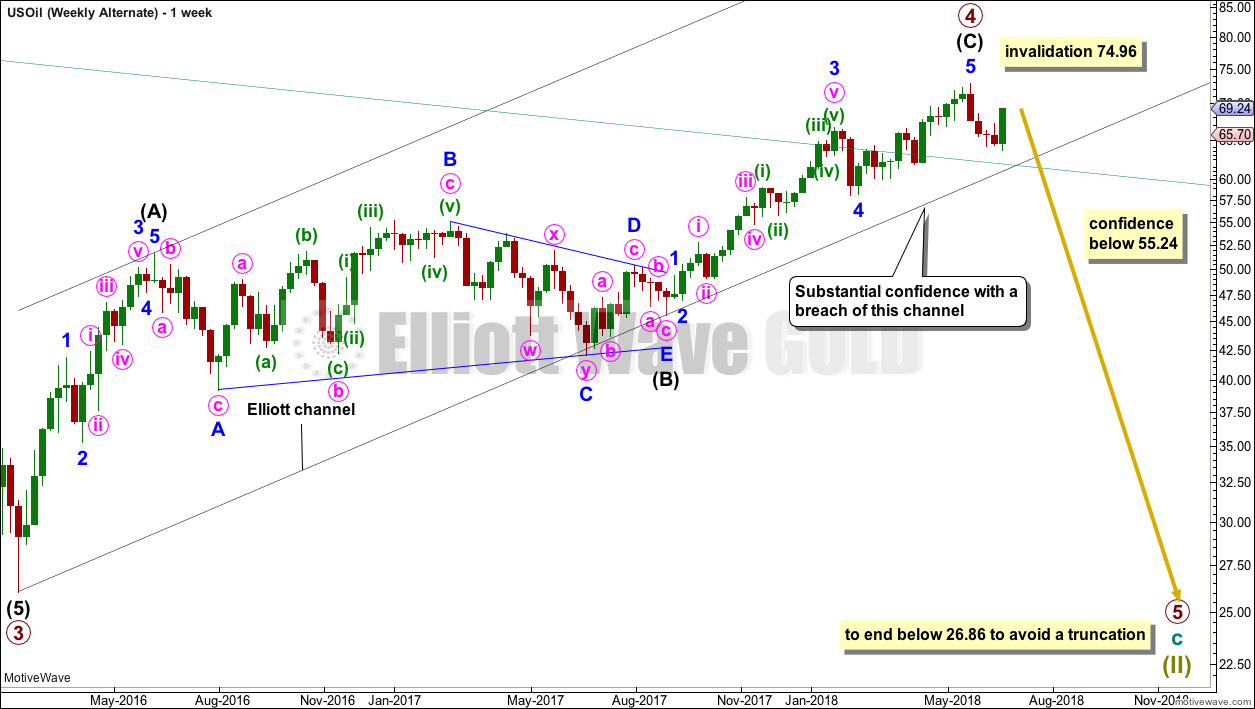
This wave count now expects a huge trend change for a new wave down for primary wave 5, which may last about a year or so. Primary wave 5 would be likely to make at least a slight new low below 26.86 to move below the end of primary wave 3 and avoid a truncation.
An Elliott channel is added to this possible zigzag for primary wave 4. A breach of the lower edge of this channel would provide a very strong indication that primary wave 4 should be over and primary wave 5 should be underway. Look out for some support on the way down, perhaps a short term bounce about the lower edge of the channel.
A new low now below 55.24 would invalidate the main wave count and in turn offer some confidence to this alternate.
DAILY CHART
Click chart to enlarge.
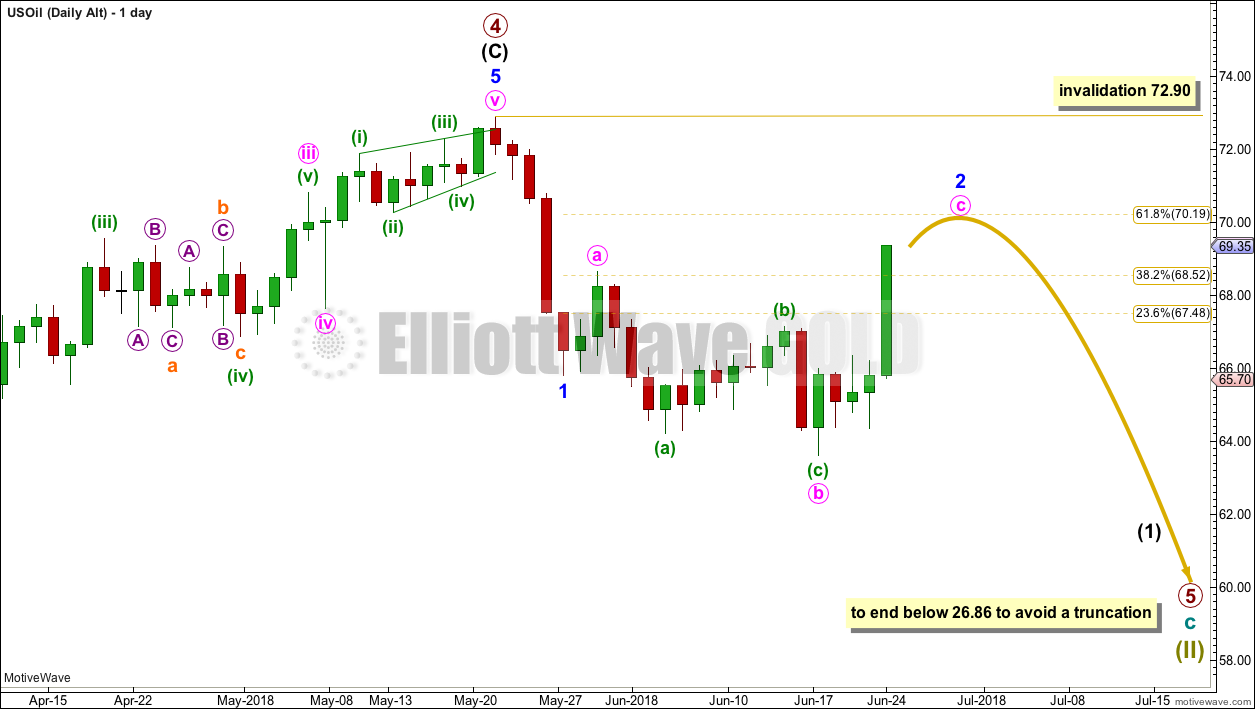
This wave count now expects a new wave down at primary degree. That should begin with a five down on the daily chart. Within the new wave down, minor wave 2 may not move beyond the start of minor wave 1 above 72.90.
Minor wave 2 may be unfolding as an expanded flat correction. These are very common structures.
Within minor wave 2, minute wave b is a 1.78 length of minute wave a. This is longer than the common range of up to 1.38, but still within the allowable limit of up to 2.
Within minor wave 2, minute wave c has now moved above the end of minute wave a avoiding a truncation and a very rare running flat. Minute wave c may end about the 0.618 Fibonacci ratio.
TECHNICAL ANALYSIS
MONTHLY CHART
Click chart to enlarge. Chart courtesy of StockCharts.com.
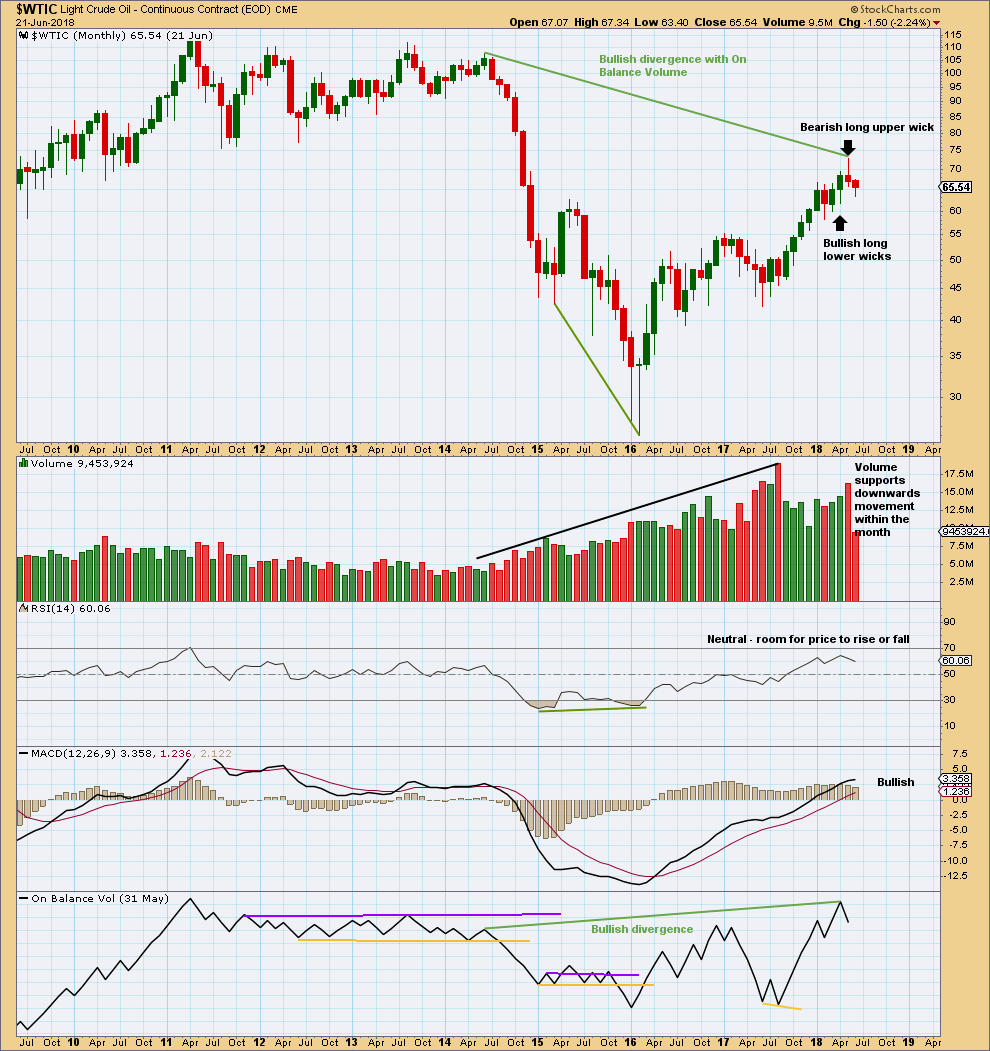
The candlestick now completed for the month of May is very bearish. Although price moved higher, the candlestick closed red and the long upper wick is very bearish. Support from volume for downwards movement within the month is bearish.
However, there remains strong bullish divergence between price and On Balance Volume. With On Balance Volume a leading indicator and making new highs above prior highs back in June 2014, price may be likely to follow with new highs above this date.
The larger trend still may be upward, but here a reasonable consolidation may have begun. It is for this reason that the Elliott wave count expects an intermediate degree correction just beginning.
DAILY CHART
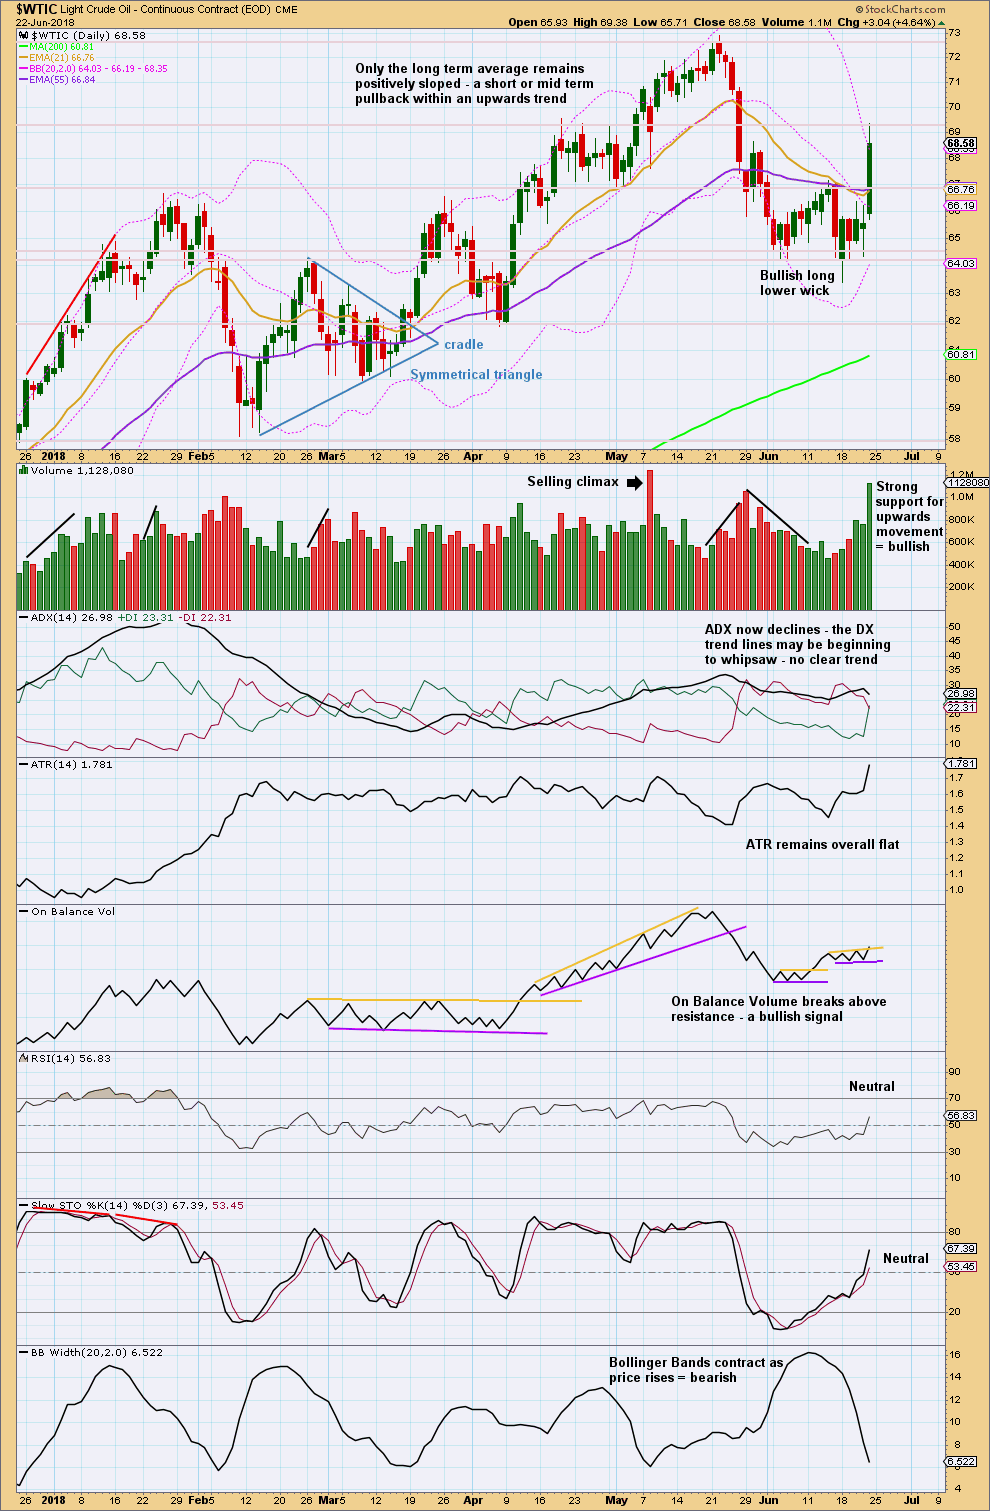
Click chart to enlarge. Chart courtesy of StockCharts.com.
Upwards movement is very bullish. On Balance Volume may be breaking above a new resistance line, and may be giving another bullish signal. It looks like price from here may continue higher until resistance, which may be about 73.0.
Another idea for the S&P500 (I have three ideas at this time) would see minor 1 ending earlier and minor 2 moving lower tomorrow as an expanded flat. Expanded flats are very common.
It is a bit early to say but I think todays market is looking like the scenario you were seeing yesterday as a third idea. I would not have the confidence to be in this market without the guidance provided by your analysis. Thank you.
You’re very welcome. And thank you to you and all members for your continued support of my work.
I am privileged to be able to do this everyday, because I love it so much!
Yes on the S&P
Is the chart below your new wave count?
Thanks very much for that. It is different from the weekend post
Yes, it’s different for the upwards portion.
I have this idea too, which I may switch over to the main count.
The bigger picture remains the same, an upwards trend. Pullbacks should still be used as opportunities to join that trend. So far since 2nd April price has made a series of higher highs and higher lows, the definition of an upwards trend. While it remains above the last swing low, that trend may be assumed to be developing.
We may see another spike lower tomorrow (or not). I expect the current pullback is over today or with just one more low.
I like this count better than the other one (on June 26th)… Minor wave 1 of the chart of June 26th does not look like a five wave impulse.
Lara
If you have adjusted the labeling of the daily chart to reflect this weeks price action, is it possible that the weekly members could get a copy of that chart before the weekend
Thanks for your consideration
Rich
If it makes a material difference, yes, I should do that.
I assume you’re referring to the S&P500?
Hi Laura, It appear that your SPX channel has broken down today as we appear to have started an impulsive move lower. Is is possible that Wave 4 is not yet done and that it might not complete until later this summer in July or Aug (see attached chart).
The breach of that base channel lends be to consider that this may not be a lower degree second wave correction. I may have to adjust my degrees and labelling of the move up out of the big triangle.
In technical terms, the trend line breached today by downwards movement is not long held, not often tested (it only has one anchor point) and has a reasonable slope, so it has very little (almost no) technical significance.
So the breach of that line today should not be taken as a strong bearish signal, because it just can’t be.
Hi Laura, For a long SPX position, do you have any suggested stop level in mind? I was thinking 2,674.50 which is your wave ii on your chart. Any recommendations?
Ideally, for a longer term position (looking at the bigger picture which is what I’m trying to do here for Lara’s Weekly) stops should be just below the swing low of the 3rd of May at 2,594.62, the invalidation point on the daily chart.
Reduce position size so that you’re risking only 1-5% of equity.
As I explained in the video, with an overlap of minute (pink, circle) iv into minute i price territory, I’m now going to label this downwards move today as another second wave correction.
I’m also going to look now at the possibility that minor 1 could have been over at the last high, and this deeper pullback today may be minor 2.
Either way, the bigger picture for the S&P remains very bullish because of the strong bullish new all time highs from the AD line and On Balance Volume. And the Elliott wave count.
Thanks Lara for great analysis.
It seems to me the best trending market is the SPX or equities. This lends itself to easier trading and longer term investing. Oil has a couple of alternates which make it less certain in the long term. Gold is in a triangle which can prove difficult to trade.
I agree. Of the three markets followed here I am most confident of an overall upwards trend for the S&P500.