

S&P 500
Overall, upwards movement was expected from the main Elliott wave count.
Summary: It is still possible that before this pullback is done one more low may be seen Monday or Tuesday.
A new high above 2,757.12 would provide confidence that a low is in place. The target would then be about 2,849; a consolidation lasting about two weeks may be expected at about this target.
The invalidation point must remain at 2,594.62.
The mid to longer term target is at 2,922 (Elliott wave) or 3,045 (classic analysis). Another multi week to multi month correction is expected at one of these targets.
The final target for this bull market to end remains at 3,616.
Pullbacks are an opportunity to join the trend.
Always practice good risk management. Always trade with stops and invest only 1-5% of equity on any one trade.
The biggest picture, Grand Super Cycle analysis, is here.
Last historic analysis with monthly charts is here, video is here.
ELLIOTT WAVE COUNT
WEEKLY CHART
Click chart to enlarge.
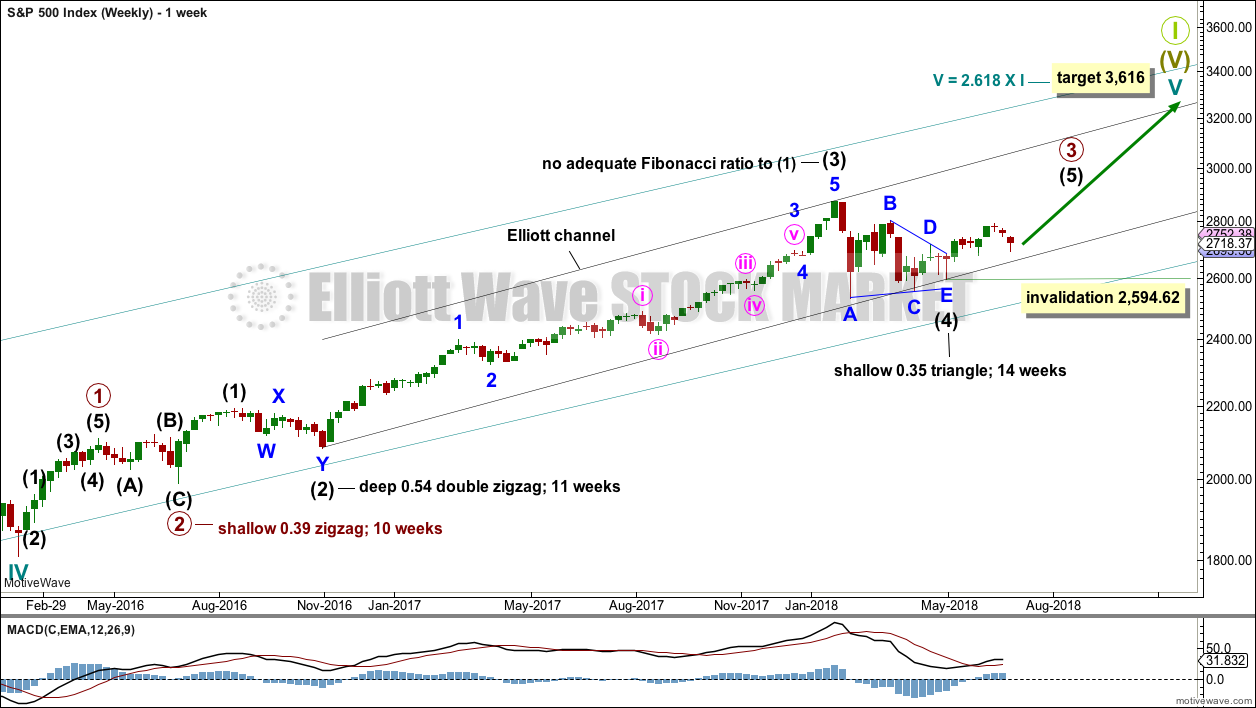
Cycle wave V must complete as a five structure, which should look clear at the weekly chart level and also now at the monthly chart level. It may only be an impulse or ending diagonal. At this stage, it is clear it is an impulse.
Within cycle wave V, the third waves at all degrees may only subdivide as impulses.
Intermediate wave (4) has breached an Elliott channel drawn using Elliott’s first technique. The channel is redrawn using Elliott’s second technique: the first trend line from the ends of intermediate waves (2) to (4), then a parallel copy on the end of intermediate wave (3). Intermediate wave (5) may end either midway within the channel, or about the upper edge.
Intermediate wave (4) may now be a complete regular contracting triangle lasting fourteen weeks, one longer than a Fibonacci thirteen. There is perfect alternation and excellent proportion between intermediate waves (2) and (4).
Within intermediate wave (5), no second wave correction may move beyond the start of its first wave below 2,594.62.
DAILY CHART
Click chart to enlarge.
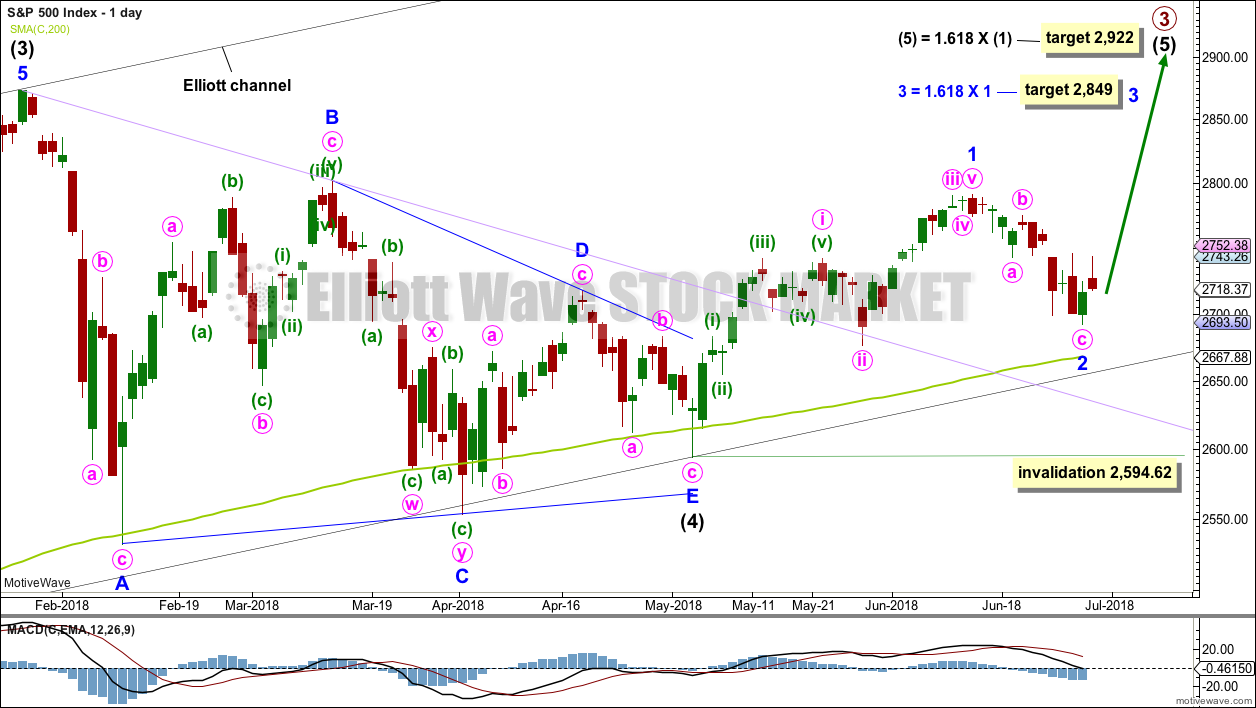
It is possible that intermediate wave (4) is a complete regular contracting triangle, the most common type of triangle. Minor wave E may have found support just below the 200 day moving average and ending reasonably short of the A-C trend line. This is the most common look for E waves of triangles.
Intermediate wave (3) exhibits no Fibonacci ratio to intermediate wave (1). It is more likely then that intermediate wave (5) may exhibit a Fibonacci ratio to either of intermediate waves (1) or (3). The most common Fibonacci ratio would be equality in length with intermediate wave (1), but in this instance that would expect a truncation. The next common Fibonacci ratio is used to calculate a target for intermediate wave (5) to end.
Price has clearly broken out above the upper triangle B-D trend line. This indicates that it should now be over if the triangle is correctly labelled.
A trend line in lilac is added to this chart. It is the same line as the upper edge of the symmetrical triangle on the daily technical analysis chart. Price found support about this line.
Minor wave 1 may have been over at the last high. Minor wave 1 will subdivide as a five wave impulse on the hourly chart; the disproportion between minute waves ii and iv gives it a three wave look at the daily chart time frame. The S&P does not always exhibit good proportions; this is an acceptable wave count for this market.
It looks like minor wave 2 for this first daily wave count should be over here. The structure at lower time frames looks complete.
A target is calculated for minor wave 3 to end.
Minor wave 2 may not move beyond the start of minor wave 1 below 2,594.62.
ALTERNATE DAILY CHART
Click chart to enlarge.
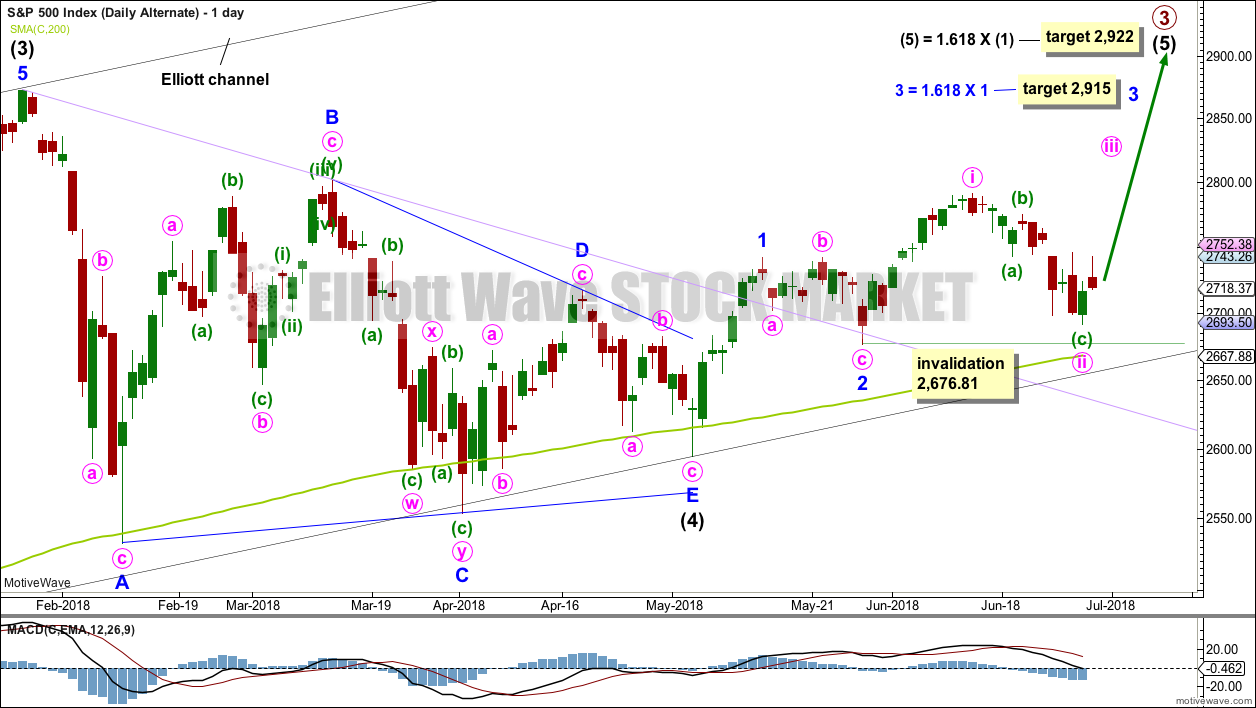
It is possible that minor waves 1 and 2 are already over. The last high may have been minute wave i. Minute wave ii may need one more low to be complete.
Minute wave ii may not move beyond the start of minute wave i below 2,676.81.
This alternate wave count resolves the problem of an odd looking minor wave 1 for the main wave count. The only problem with this alternate wave count is minute wave ii is not contained within a base channel which would be drawn about minor waves 1 and 2.
This wave count is very bullish. It expects to see a very strong upwards movement as the middle of a third wave begins here.
SECOND ALTERNATE DAILY CHART
Click chart to enlarge.
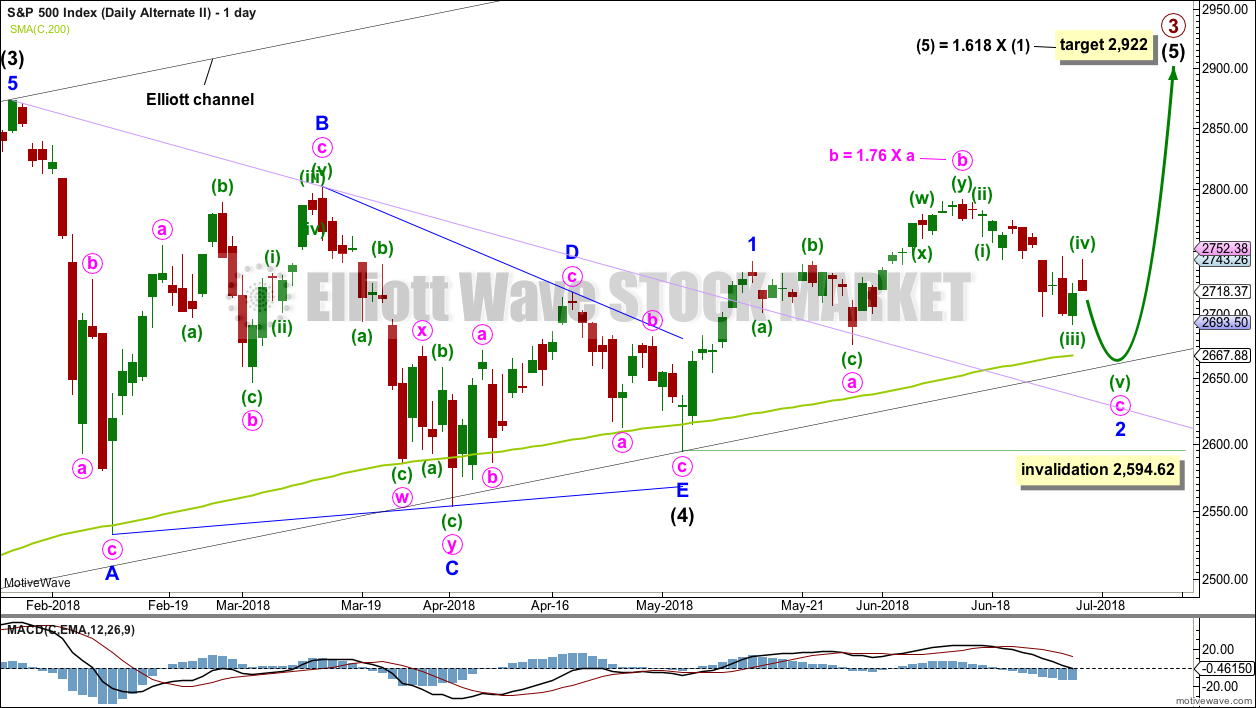
It is also still possible that minor wave 1 ended earlier and current downwards movement is the end of an expanded flat correction for minor wave 2.
The 0.618 Fibonacci ratio of minor wave 1 here would be about 2,651. This would be very slightly below the lower edge of the black Elliott channel and slightly below the 200 day moving average.
This second alternate wave count expects a somewhat deeper pullback about here to make a new low below the end of minute wave a at 2,676.81, so that minute wave c avoids a truncation and minor wave 2 avoids a running flat correction.
Minor wave 2 may not move beyond the start of minor wave 1 below 2,594.62.
TECHNICAL ANALYSIS
WEEKLY CHART
Click chart to enlarge. Chart courtesy of StockCharts.com.
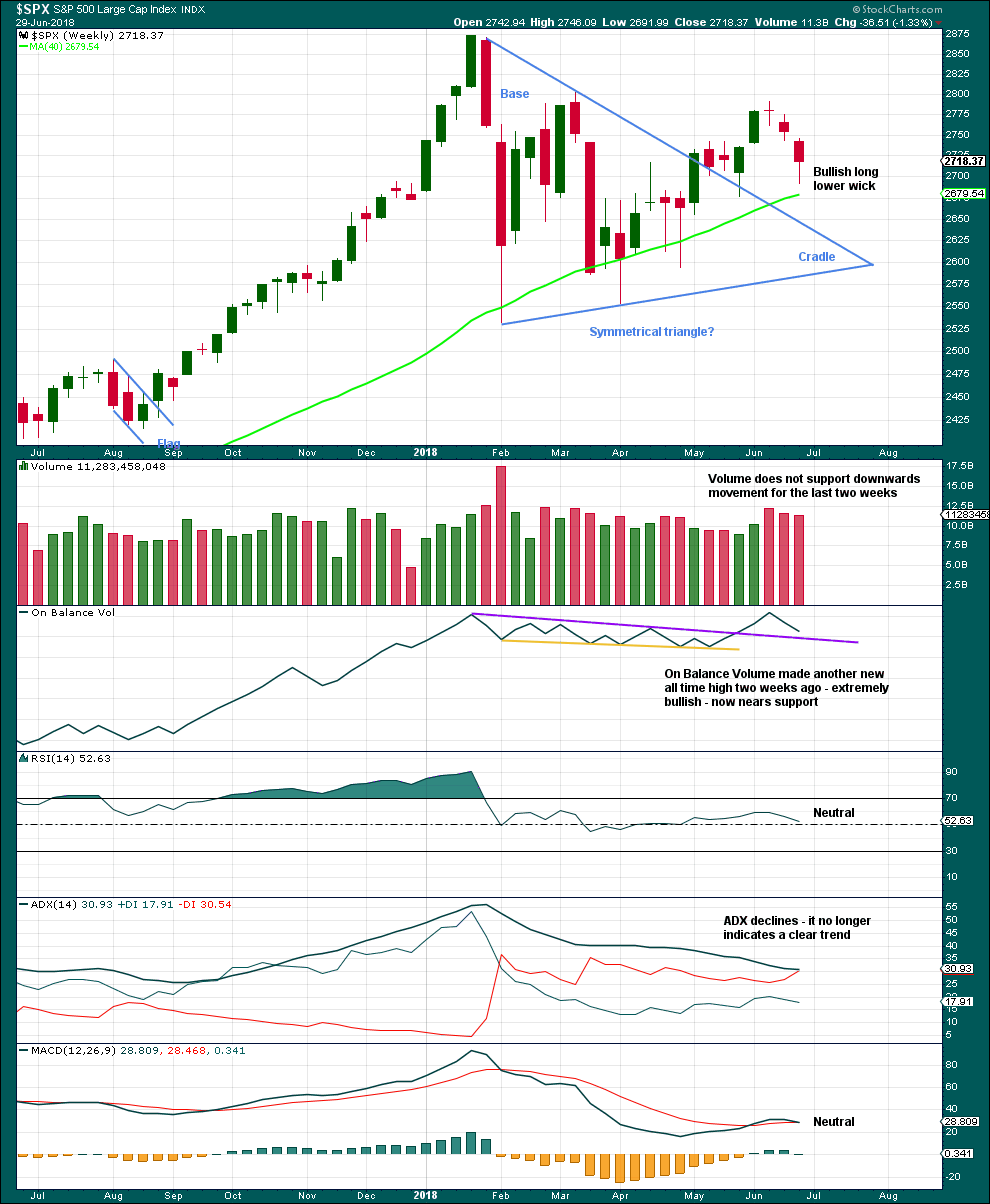
Downwards movement of the last two weeks still looks most likely as a pullback within a developing upwards trend. Long lower candlestick wicks, a lack of support from volume, and nearby support from On Balance Volume all look bullish.
DAILY CHART
Click chart to enlarge. Chart courtesy of StockCharts.com.
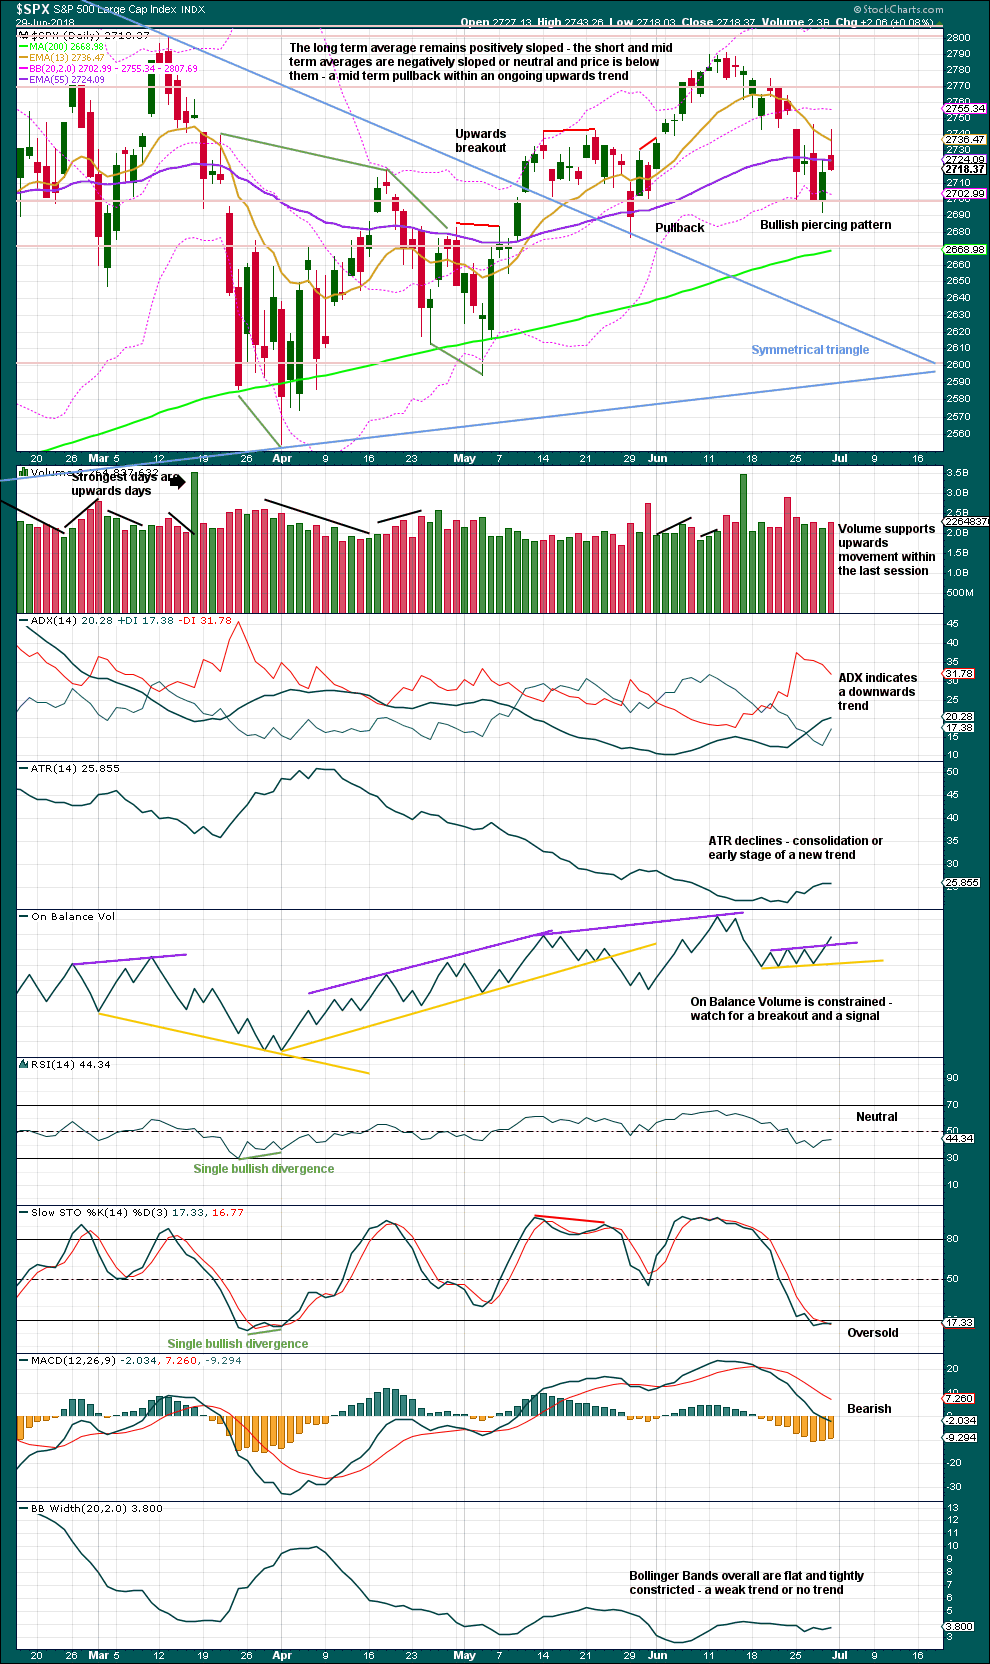
The symmetrical triangle may now be complete. The base distance is 340.18. Added to the breakout point of 2,704.54 this gives a target at 3,044.72. This is above the Elliott wave target at 2,922, so the Elliott wave target may be inadequate.
Since the low on the 2nd of April, 2018, price has made a series of higher highs and higher lows. This is the definition of an upwards trend. But trends do not move in perfectly straight lines; there are pullbacks and bounces along the way. While price has not made a lower low below the prior swing low of the 29th of May, the view of a possible upwards trend in place should remain. Note though that the second alternate Elliott wave count allows for a new swing low yet expects a third wave upwards to begin from there. This is entirely possible.
A bullish signal on Friday from On Balance Volume suggests a low may now be in place. However, Friday’s candlestick is bearish: although it moved price higher, the candlestick closed red and has a very bearish long upper wick. This should not be read as a bearish Shooting Star reversal pattern though, because for a candlestick to be read as a reversal pattern it needs to come after a trend. In this case, Friday’s candlestick does not come at the end of an upwards wave; there is no upwards wave to reverse.
If a low is not already in place, then it should be expected to be in place very soon.
VOLATILITY – INVERTED VIX CHART
Click chart to enlarge. Chart courtesy of StockCharts.com. So that colour blind members are included, bearish signals
will be noted with blue and bullish signals with yellow.
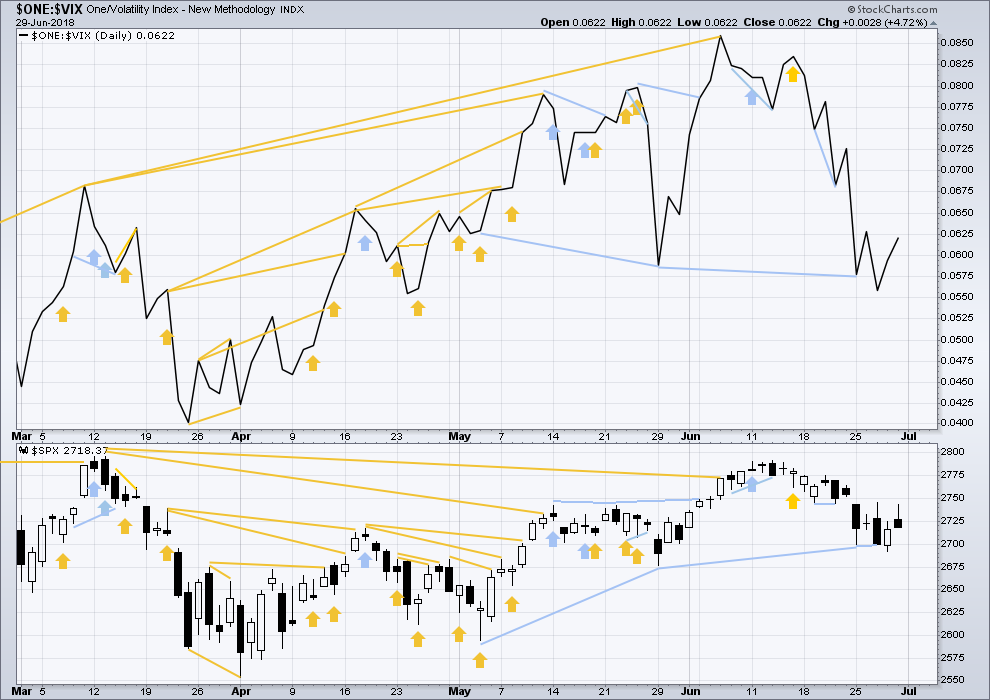
Normally, volatility should decline as price moves higher and increase as price moves lower. This means that normally inverted VIX should move in the same direction as price.
Inverted VIX has made a new high above the prior swing high of the 9th of March, but price has not made a corresponding new swing high about the same point yet. This divergence is bullish. Inverted VIX is still a little way off making a new all time high.
There is mid term bearish divergence between price and inverted VIX: inverted VIX has made a new swing low below the prior swing low of the 29th of May, but price has not. Downwards movement has strong support from increasing market volatility; this divergence is bearish. However, it must be noted that the last swing low of the 29th of May also came with bearish divergence between price and inverted VIX, yet price went on to make new highs.
This divergence may not be reliable. As it contradicts messages given by On Balance Volume and the AD line, it shall not be given much weight in this analysis.
There is no new divergence between inverted VIX and price today.
BREADTH – AD LINE
Click chart to enlarge. Chart courtesy of StockCharts.com.
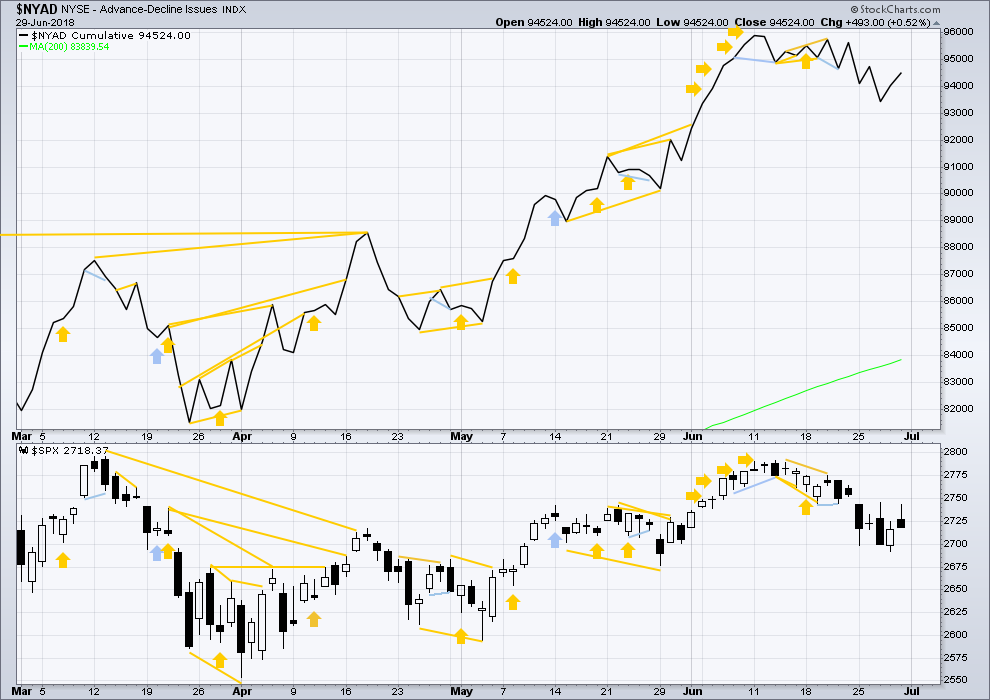
There is normally 4-6 months divergence between price and market breadth prior to a full fledged bear market. This has been so for all major bear markets within the last 90 odd years. With no longer term divergence yet at this point, any decline in price should be expected to be a pullback within an ongoing bull market and not necessarily the start of a bear market. New all time highs from the AD line means that any bear market may now be an absolute minimum of 4 months away. It may of course be a lot longer than that. My next expectation for the end of this bull market may now be October 2019.
Small caps and mid caps have both recently made new all time highs. It is large caps that usually lag in the latter stages of a bull market, so this perfectly fits the Elliott wave count. Expect large caps to follow to new all time highs.
Breadth should be read as a leading indicator.
There is no new divergence today between price and the AD line.
Overall, the AD line still remains mostly bullish as it has made more than one new all time high last week. Price may reasonably be expected to follow through in coming weeks.
DOW THEORY
The following lows need to be exceeded for Dow Theory to confirm the end of the bull market and a change to a bear market:
DJIA: 23,360.29.
DJT: 9,806.79.
S&P500: 2,532.69.
Nasdaq: 6,630.67.
Only Nasdaq at this stage is making new all time highs. DJIA and DJT need to make new all time highs for the ongoing bull market to be confirmed.
GOLD
A candlestick pattern on the daily chart in combination with volume analysis indicate the most likely scenario for early next week.
Summary: The short term target is at 1,227 for a multi day to multi week consolidation.
The mid term target is 1,216 – 1,211. Downwards movement may be limited to no lower than 1,123.08.
Always trade with stops to protect your account. Risk only 1-5% of equity on any one trade.
Grand SuperCycle analysis is here.
It is time again to update the historic analysis with several different possibilities for cycle wave b.
MAIN ELLIOTT WAVE COUNT
MONTHLY CHART
Click chart to enlarge.
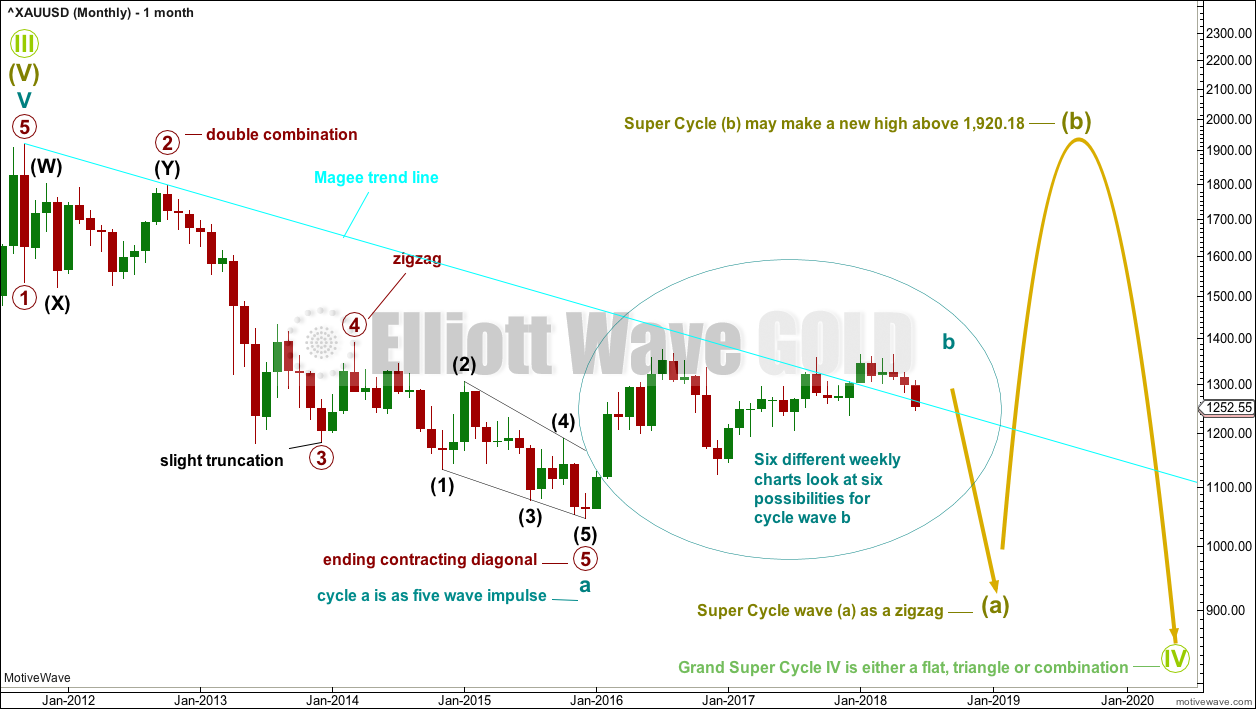
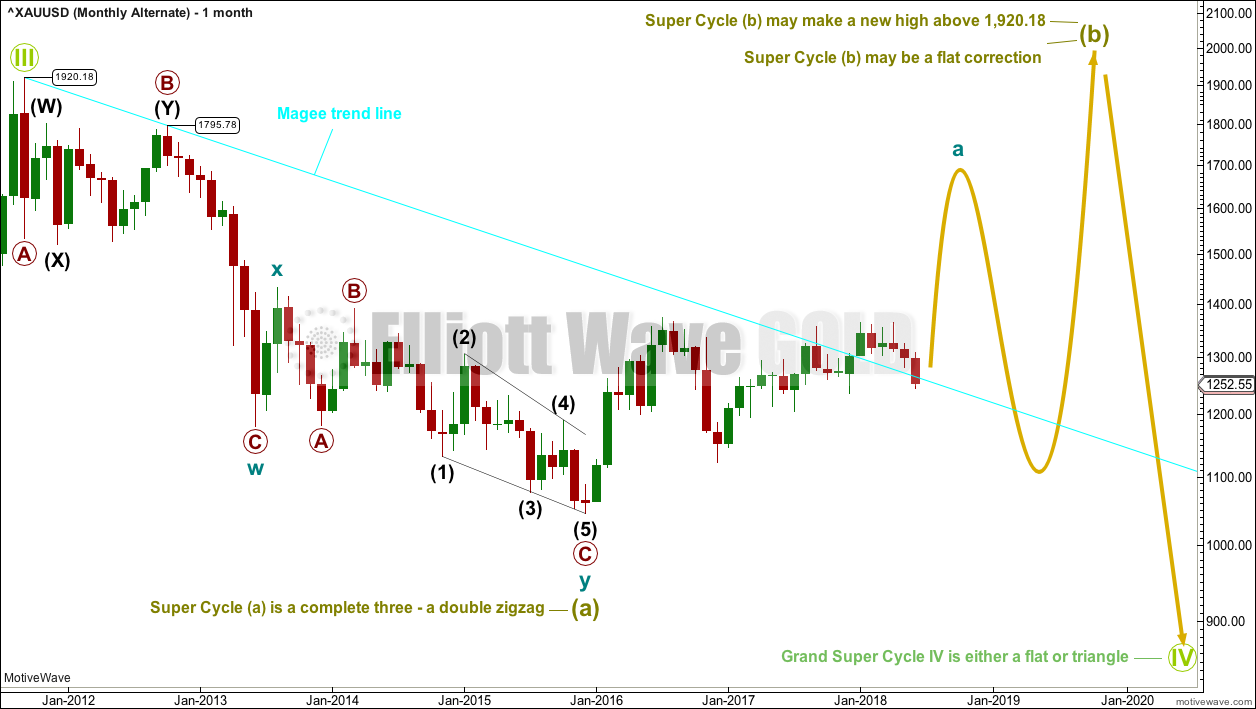
The main wave count will look at the large downwards wave from the all time high as a five wave impulse. For this main wave count, it will be labelled as cycle wave a, within a zigzag for Super Cycle wave (a).
It is also possible to move the degree of labelling up one degree and see this as a five wave structure complete for Super Cycle wave (a).
Both degrees of labelling would be valid, but in the interests of keeping charts and ideas to a manageable level only one shall be published at this stage. The difference will not be material for at least a year and probably more.
If cycle wave a is a five, then cycle wave b may not move beyond its start above 1,920.18.
Cycle wave b may be any one of more than 23 possible corrective structures. Six different ideas for cycle wave b will be considered this week on weekly charts: a zigzag (with two charts), double zigzag, triangle, flat and a combination.
When cycle wave b is complete, then cycle wave c downwards should unfold. Cycle wave c would most likely reach about equality in length with cycle wave a.
If this wave count unfolds as expected, then a huge zigzag downwards may be complete when cycle wave c completes. That would then be expected to be followed by a huge three wave structure upwards, most likely another zigzag for Super Cycle wave (b), which may make a new all time high.
The larger structure for Grand Super Cycle wave (IV) would be starting out with a huge zigzag downwards, indicating either a flat, triangle or combination.
WEEKLY CHART – TRIANGLE
Click chart to enlarge.
The triangle so far has the best fit and look. If price shows a combination or flat may be more likely, then those ideas may be published on a daily basis. The flat and combination ideas expect movement reasonably below 1,123.08, or perhaps a new low below 1,046.27.
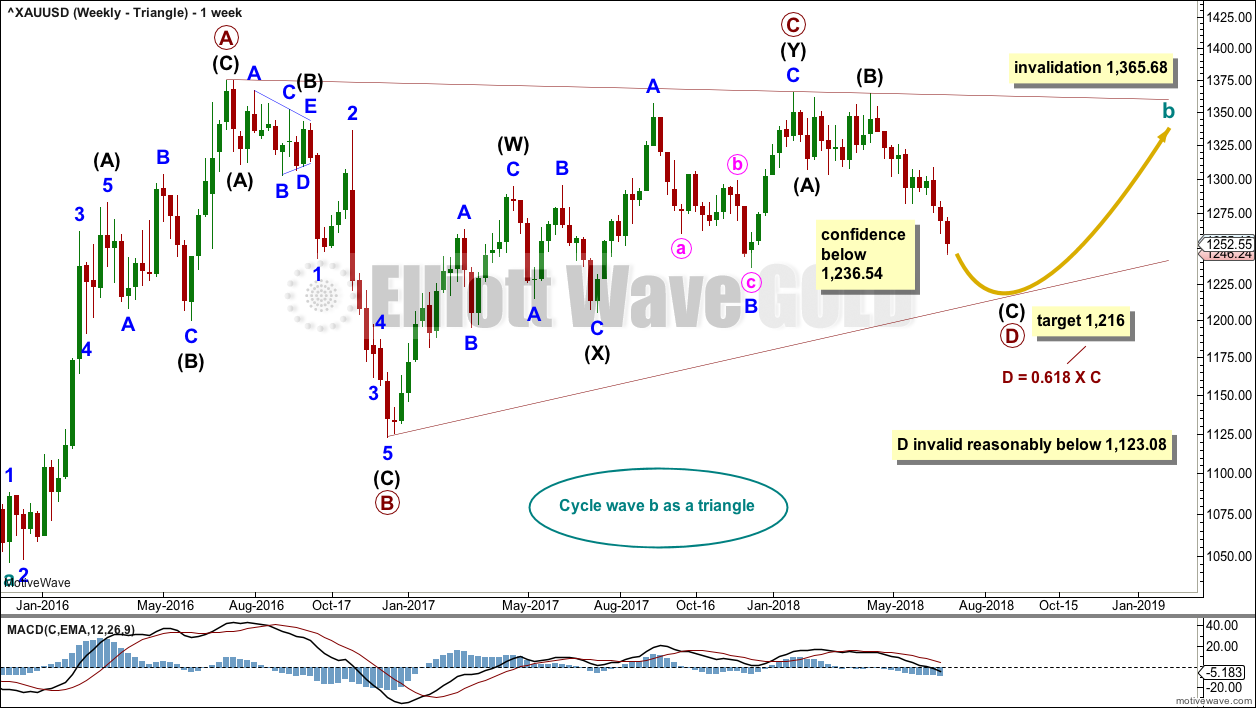
Cycle wave b may be an incomplete triangle. The triangle may be a contracting or barrier triangle, with a contracting triangle looking much more likely because the A-C trend line does not have a strong slope. A contracting triangle could see the B-D trend line have a stronger slope, so that the triangle trend lines converge at a reasonable rate. A barrier triangle would have a B-D trend line that would be essentially flat, and the triangle trend lines would barely converge.
Within a contracting triangle, primary wave D may not move beyond the end of primary wave B below 1,123.08. Within a barrier triangle, primary wave D may end about the same level as primary wave B at 1,123.08, so that the B-D trend line is essentially flat. Only a new low reasonably below 1,123.08 would invalidate the triangle.
Within both a contracting and barrier triangle, primary wave E may not move beyond the end of primary wave C above 1,365.68.
Four of the five sub-waves of a triangle must be zigzags, with only one sub-wave allowed to be a multiple zigzag. Primary wave C is the most common sub-wave to subdivide as a multiple, and this is how primary wave C for this example fits best.
Primary wave D must be a single structure, most likely a zigzag.
One triangle sub-wave tends to be close to 0.618 the length of its predecessor; this gives a target for primary wave D.
There are no problems in terms of subdivisions or rare structures for this wave count. It has an excellent fit and so far a typical look.
DAILY CHART – TRIANGLE
Click chart to enlarge.
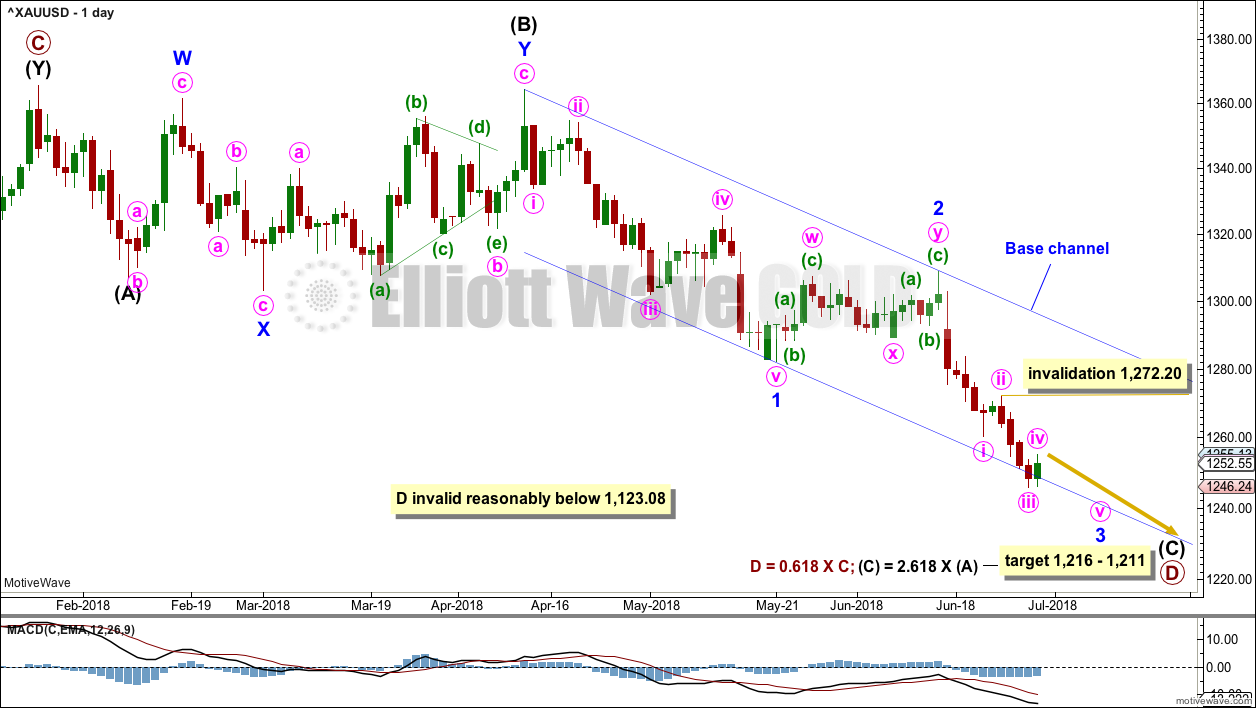
Primary wave D may be unfolding lower as a single zigzag, and within it intermediate waves (A) and (B) may be complete.
The target is widened to a $5 zone calculated at two degrees. This should have a reasonable probability.
Within intermediate wave (C), it looks likely that minor wave 2 may now be over. Within minor wave 3, no second wave correction may move beyond the start of its first wave above 1,308.89.
This wave count now expects to see an increase in downwards momentum as a third wave unfolds.
Add a base channel about minor waves 1 and 2. Along the way down, bounces for lower degree second wave corrections may be expected to find resistance at the upper edge of the base channel. The middle to end of minor wave 3 may have the power to break below support at the lower edge of the base channel.
Gold, typical of commodities, often exhibits very swift and strong fifth waves. This tendency is particularly prevalent for its fifth waves to end third wave impulses. Look out for a possible selling climax to end one or both of minute wave iii and minor wave 3.
Within minute wave iii, no second wave correction may move beyond the start of its first wave above 1,272.20.
It is possible that minute wave iii was over at Thursday’s low as labelled, but it is also possible that minute wave iii may continue lower. The invalidation point must remain the same.
WEEKLY CHART – COMBINATION
Click chart to enlarge.
It is essential when a triangle is considered to always consider alternates. Too many times over the years I have labelled a triangle as unfolding or even complete, only for it to be invalidated and the structure turning out to be something else.
When a triangle is invalidated, then the most common structure the correction turns out to be is a combination.
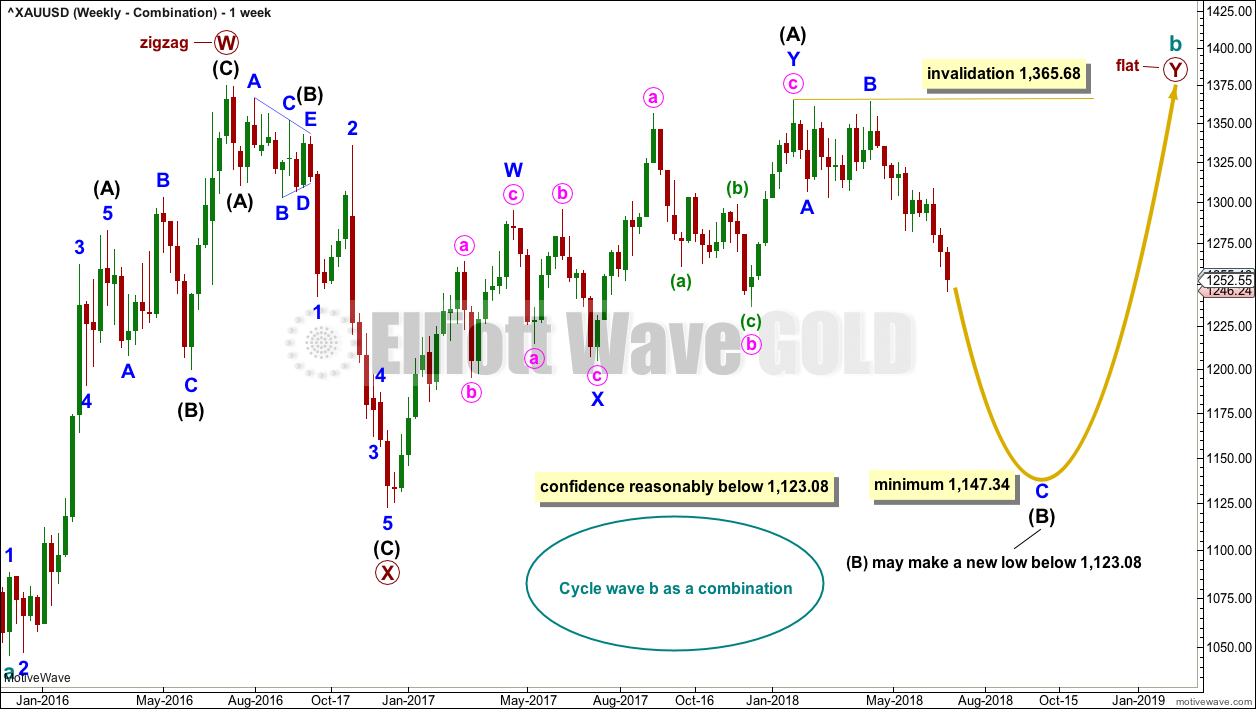
If cycle wave b is a combination, then the first structure in a double may be a complete zigzag labelled primary wave W.
The double may be joined by a three in the opposite direction, a zigzag labelled primary wave X.
The second structure in the double may be a flat correction labelled primary wave Y. It may also be a triangle, but that would expect essentially the same movement as the weekly triangle chart and so shall not yet be considered while there is no divergence in the expected pathway for price.
Within a flat correction for primary wave Y, the current downwards wave of intermediate wave (B) may be a single or multiple zigzag; for now it shall be labelled as a single. Intermediate wave (B) must retrace a minimum 0.9 length of intermediate wave (A) at 1,147.34. Intermediate wave (B) may move beyond the start of intermediate wave (A) as in an expanded flat.
When intermediate wave (B) is complete, then intermediate wave (C) would be expected to make at least a slight new high above the end of intermediate wave (A) at 1,365.68 to avoid a truncation. Primary wave Y would be most likely to end about the same level as primary wave W at 1,374.91, so that the whole structure takes up time and moves price sideways, as that is the purpose of double combinations.
While double combinations are very common, triples are extremely rare. When the second structure in a double is complete, then it is extremely likely that the whole correction is over.
WEEKLY CHART – FLAT
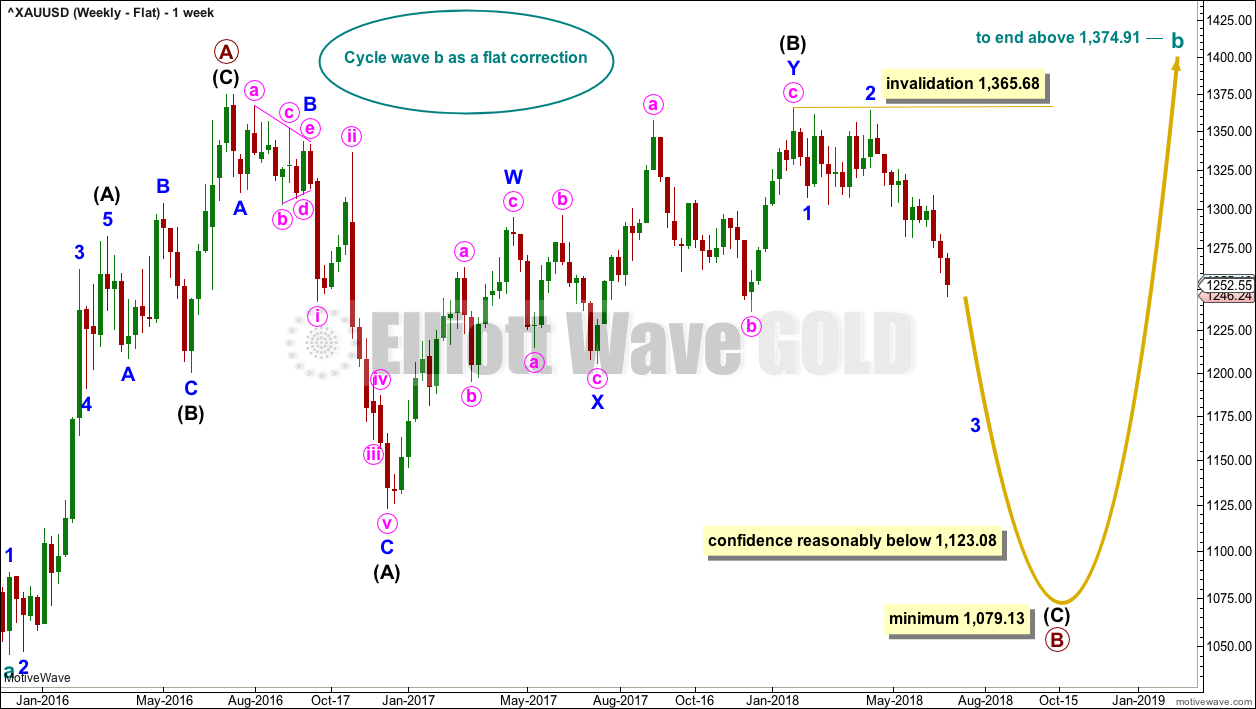
Click chart to enlarge.
It is possible that cycle wave b may be a flat correction. Within a flat correction, primary wave B must retrace a minimum 0.9 length of primary wave A at 1,079.13 or below. Primary wave B may make a new low below the start of primary wave A at 1,046.27 as in an expanded flat correction.
Primary wave B itself may be a flat correction, and within it intermediate wave (A) is a zigzag and intermediate wave (B) may have been a double zigzag. The problem of a rare triple (from the last analysis) is resolved; I have checked the subdivisions on the daily chart.
Only a new low reasonably below 1,123.08 would provide reasonable confidence in this wave count.
WEEKLY CHART – ZIGZAG
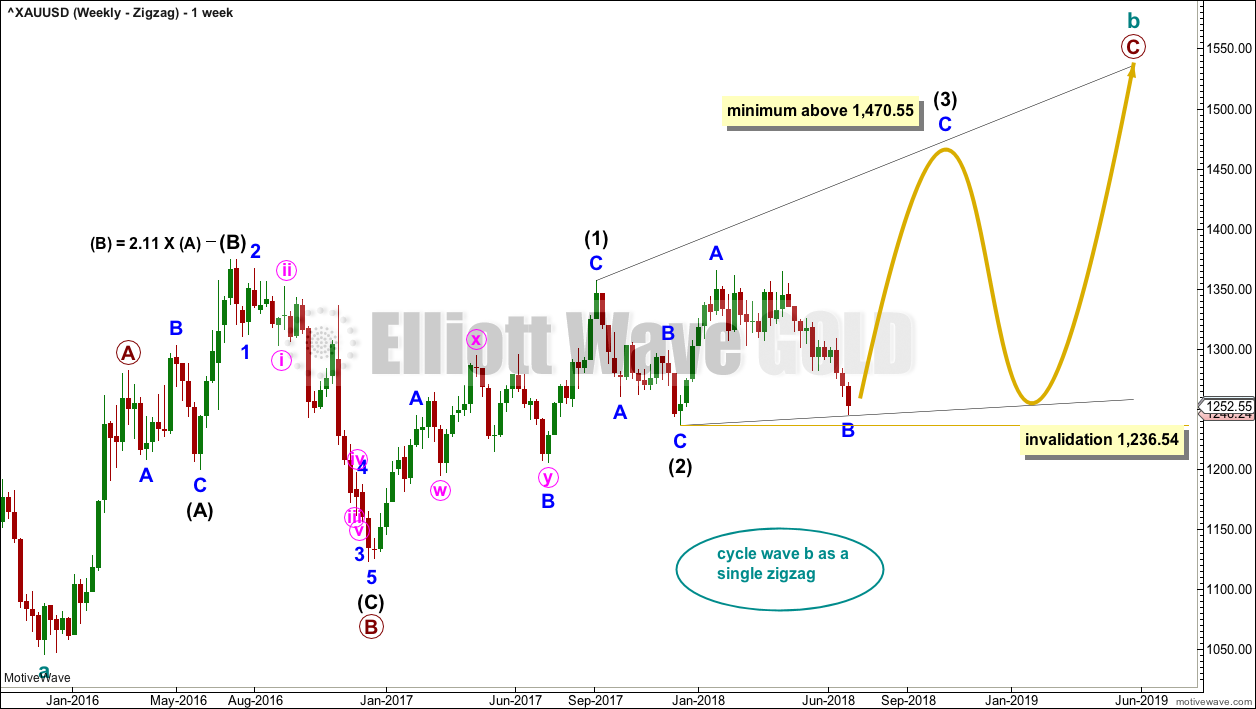
Click chart to enlarge.
This wave count is a new idea presented this week.
It is still possible that cycle wave b may be a zigzag. Primary wave A is seen as over earlier, resolving the prior problem of trying to see the first wave up as a five when it looks like a three. Primary wave B now fits well as an expanded flat.
A problem now exists at the start of intermediate wave (C) of primary wave B. At the start of that downwards wave is what looks like a perfect triangle. Because second waves do not subdivide with triangles as their sole corrective structure, the triangle must be ignored and this may be seen as a series of overlapping first and second waves, but ignoring the triangle there must reduce the probability of this wave count.
There is no maximum limit to the length of B waves within flats, but there is a convention within Elliott wave that states when the possible B wave reaches twice the length of the A wave, the idea of a flat should be discarded based upon a very low probability. This wave count sees intermediate wave (B) within primary wave B as a little longer than twice the length of intermediate wave (A). While this does not break any Elliott wave rules, it does reduce the probability of this wave count.
Primary wave C is seen as an ending diagonal. Within ending diagonals, all sub-waves must subdivide as zigzags. Diagonals, like triangles, normally adhere very well to their trend lines. For this example, the lower (2)-(4) trend line must show where minor wave B has found support, which would mean the diagonal must be expanding.
For an expanding diagonal, intermediate wave (3) must be longer in length then intermediate wave (1), so it must end above 1,470.55. Intermediate wave (4) must then be longer in length than intermediate wave (2), and finally intermediate wave (5) must be longer in length than intermediate wave (3). This wave count is extremely bullish.
This wave count expects a low in place and a quick reversal next week.
Within the zigzag of intermediate wave (3), minor wave B may not move beyond the start minor wave A below 1,236.54.
WEEKLY CHART – ZIGZAG II
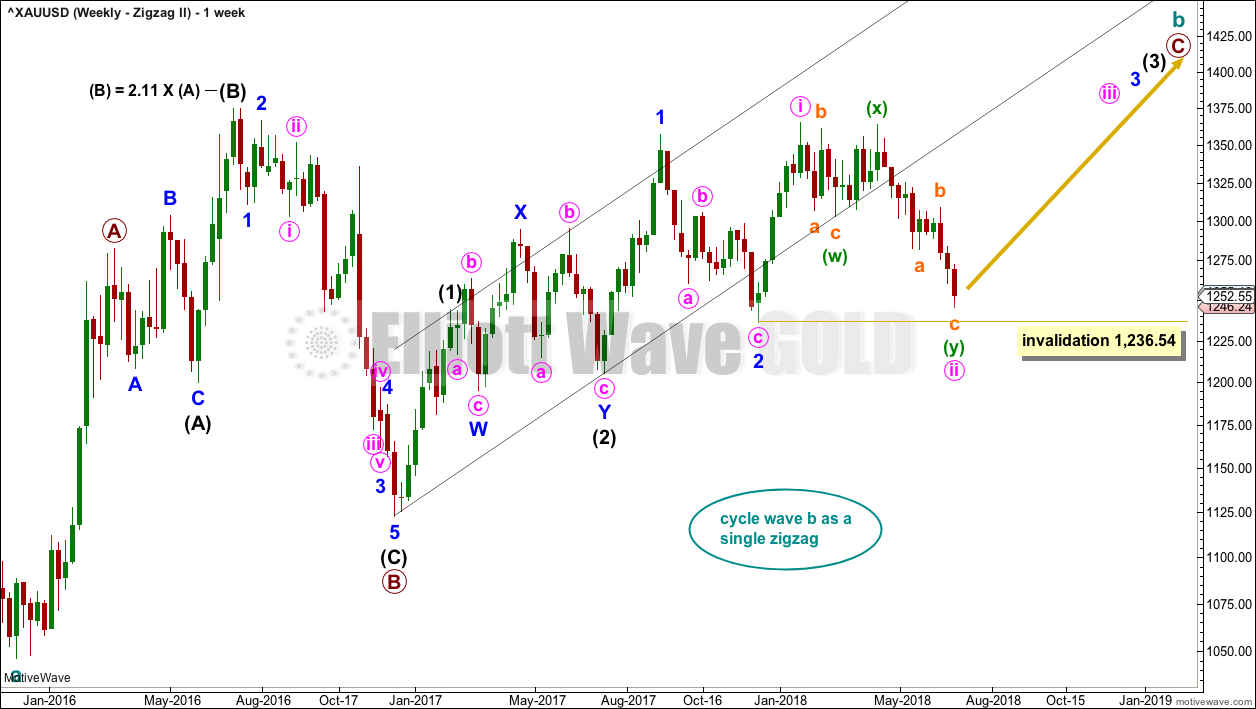
Click chart to enlarge.
This weekly chart is identical to the first zigzag chart with the exception of the structure of primary wave C.
Primary wave C may be either an ending diagonal or an impulse. This second weekly chart considers the possibility of an impulse.
There may be so far a series of three overlapping first and second waves complete within primary wave C. This wave count is extremely bullish, expecting a quick reversal next week and very strong upwards movement as the middle of a third wave upwards begins.
Minute wave ii may not move beyond the start of minute wave i below 1,236.54.
This wave count suffers from the same problems as the first zigzag wave count. In addition to those problems, it also suffers from what looks like poor proportion of second wave corrections. Minute wave ii looks too be too large and deep for a lower degree second wave correction. Neither of minor wave 2 nor minute wave ii are contained within the black base channel drawn about intermediate waves (1) and (2); this further reduces the probability of this wave count. This wave count must be judged to have the lowest probability of all the weekly charts published here.
Low probability does not mean no probability.
WEEKLY CHART – DOUBLE ZIGZAG
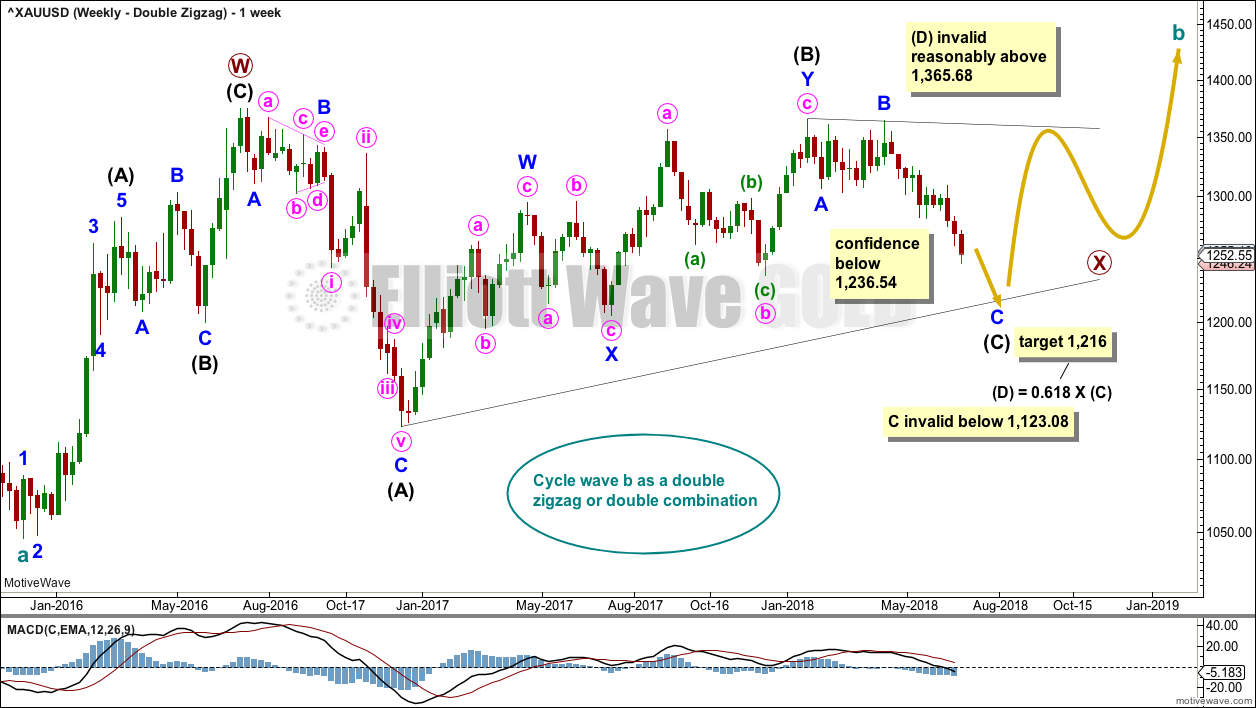
Click chart to enlarge.
Finally, it is also possible that cycle wave b may be a double zigzag or a double combination.
The first zigzag in the double is labelled primary wave W. This has a good fit.
The double may be joined by a corrective structure in the opposite direction, a triangle labelled primary wave X. The triangle would be only a little over halfway through.
This wave count may now expect choppy overlapping movement in an ever decreasing range for several more weeks yet. After the triangle is complete, then an upwards breakout would be expected from it.
Primary wave Y would most likely be a zigzag because primary wave X would be shallow; double zigzags normally have relatively shallow X waves.
Primary wave Y may also be a flat correction if cycle wave b is a double combination, but combinations normally have deep X waves. This would be less likely.
This wave count has good proportions and no problems in terms of subdivisions.
ALTERNATE ELLIOTT WAVE COUNT
MONTHLY CHART
Click chart to enlarge.
The large wave down from September 2011 to November 2015 may also be seen as a three wave structure, a double zigzag.
If the big wave down is a multiple three wave structure, then Grand Super Cycle wave (IV) may be either a flat or triangle. It may not be a combination because they may not have multiples within multiples.
If Grand Super Cycle wave (IV) is a flat correction, then within it Super Cycle wave (b) must retrace a minimum 0.9 length of Super Cycle wave (a) at 1,832.79.
If Grand Super Cycle wave (IV) is a triangle, then there is no minimum requirement for Super Cycle wave (b). There is only the structural requirement that it should be a three wave structure.
Super Cycle wave (b) would most likely be a single or multiple zigzag and would most likely be reasonably deep.
If cycle wave a within Super Cycle wave (b) is a three wave structure, then Super Cycle wave (b) may be a flat correction. It could also be a triangle, but that would not be able to meet the expected depth.
SECOND ALTERNATE ELLIOTT WAVE COUNT
MONTHLY CHART
Click chart to enlarge.
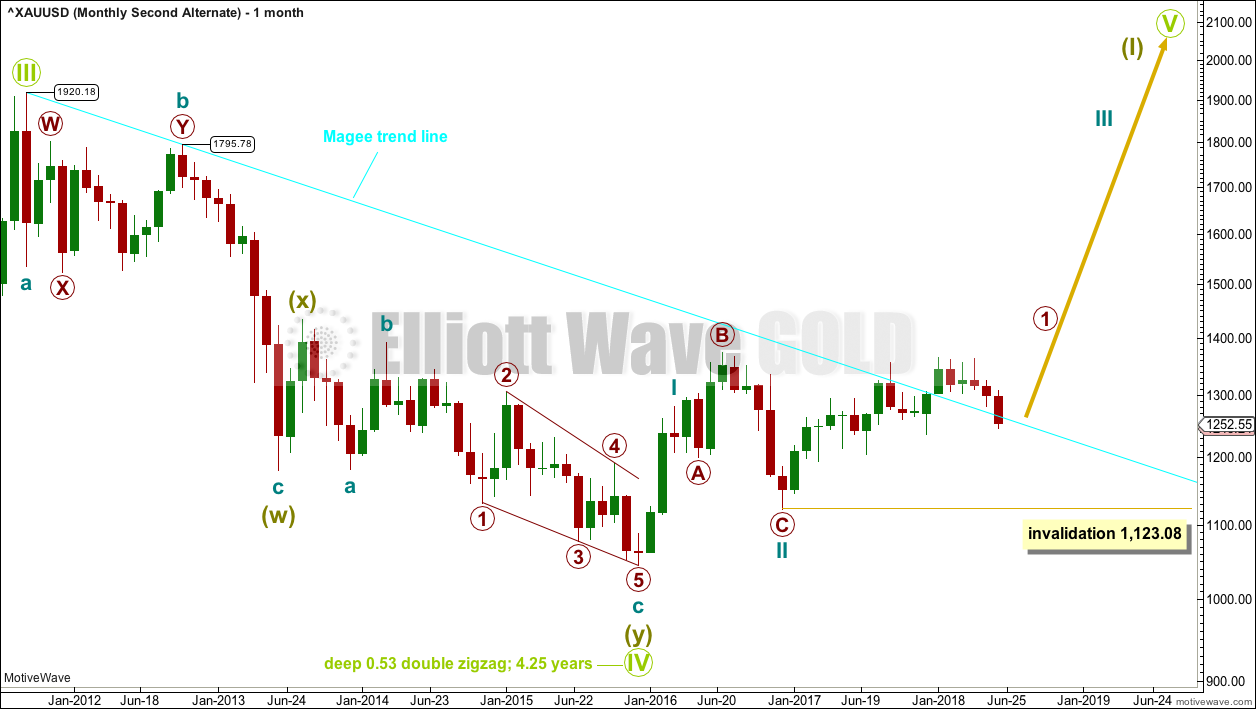
It is possible that Grand Super Cycle wave IV is over. It would be rather brief though at only 4.25 years. However, Grand Super Cycle wave II in the Grand Super Cycle analysis is expected to have lasted only about 8 years, so this possibility should be accepted.
If there has been a trend change at Grand Super Cycle degree in the end of November 2015, then a new five wave structure upwards should develop from there at the monthly chart level.
Gold will often form long slow basing movements. Its first waves can be short and its second waves long lasting and deep.
Cycle waves I and II may be complete within Super Cycle wave (I).
Within cycle wave III, primary wave 1 may be unfolding as a leading diagonal. When it is complete, then primary wave 2 may not move beyond the start of primary wave 1 below 1,123.08.
At the weekly chart level, the subdivisions for this idea must be seen in the same way as the zigzag charts above. This is because a zigzag subdivides 5-3-5, exactly the same as 1-2-3 of an impulse. This wave count would suffer from the same problems as the two weekly zigzag charts above.
TECHNICAL ANALYSIS
WEEKLY CHART
Click chart to enlarge. Chart courtesy of StockCharts.com.
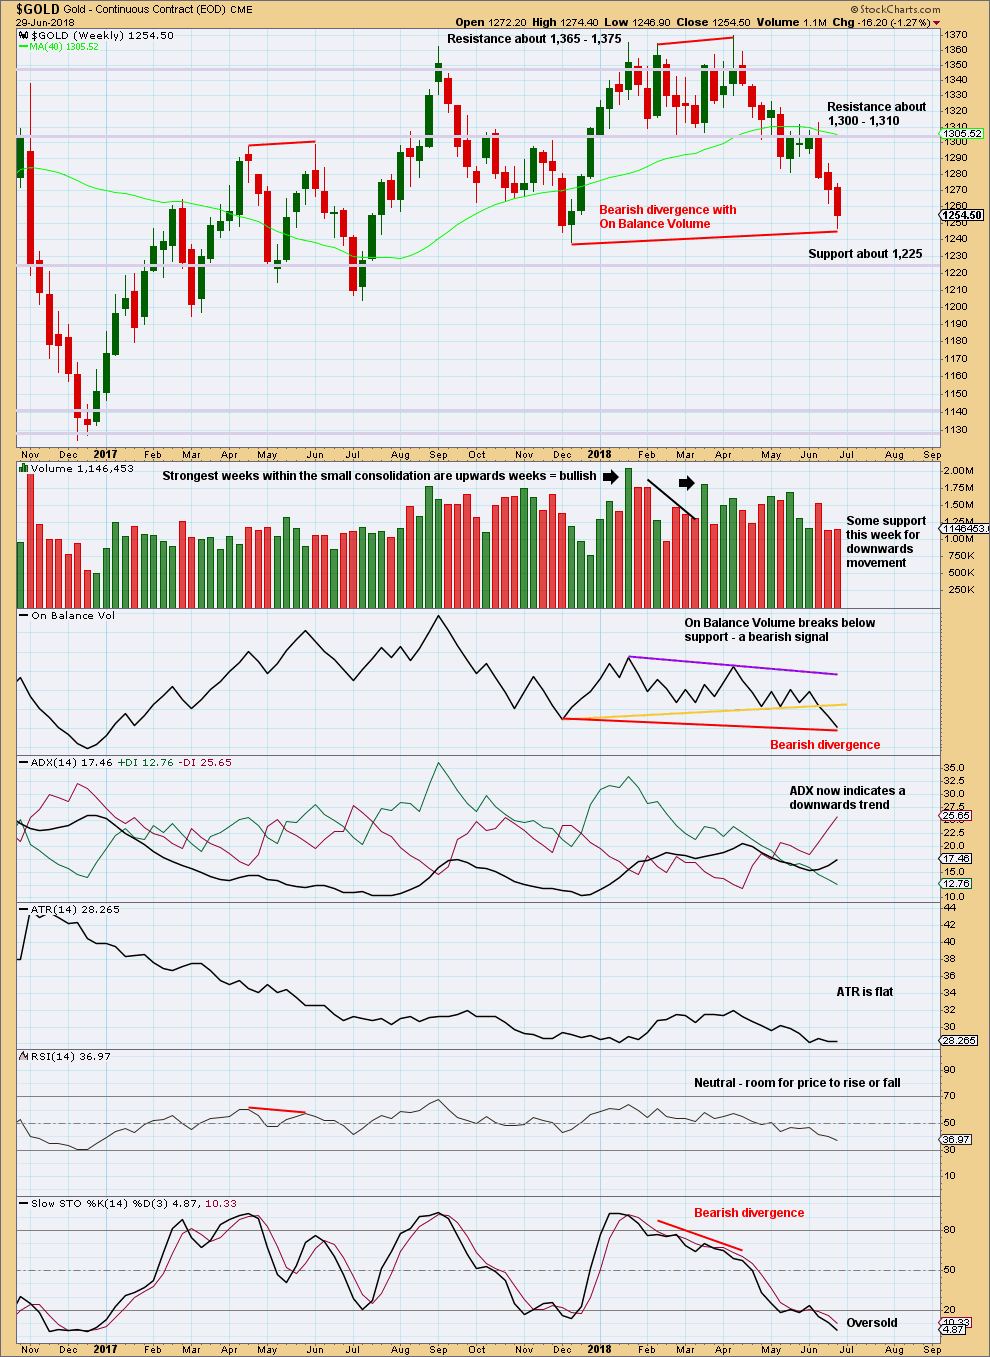
On Balance Volume has made a new swing low this week below the prior swing low, but price has not. On Balance Volume should be read as a leading indicator, so this is bearish and indicates price may likely follow through with a new swing low below 1,238.30.
The long lower wick on this weekly candlestick is a little bullish, but it is not long enough to expect a low is likely to be in place here.
DAILY CHART
Click chart to enlarge. Chart courtesy of StockCharts.com.
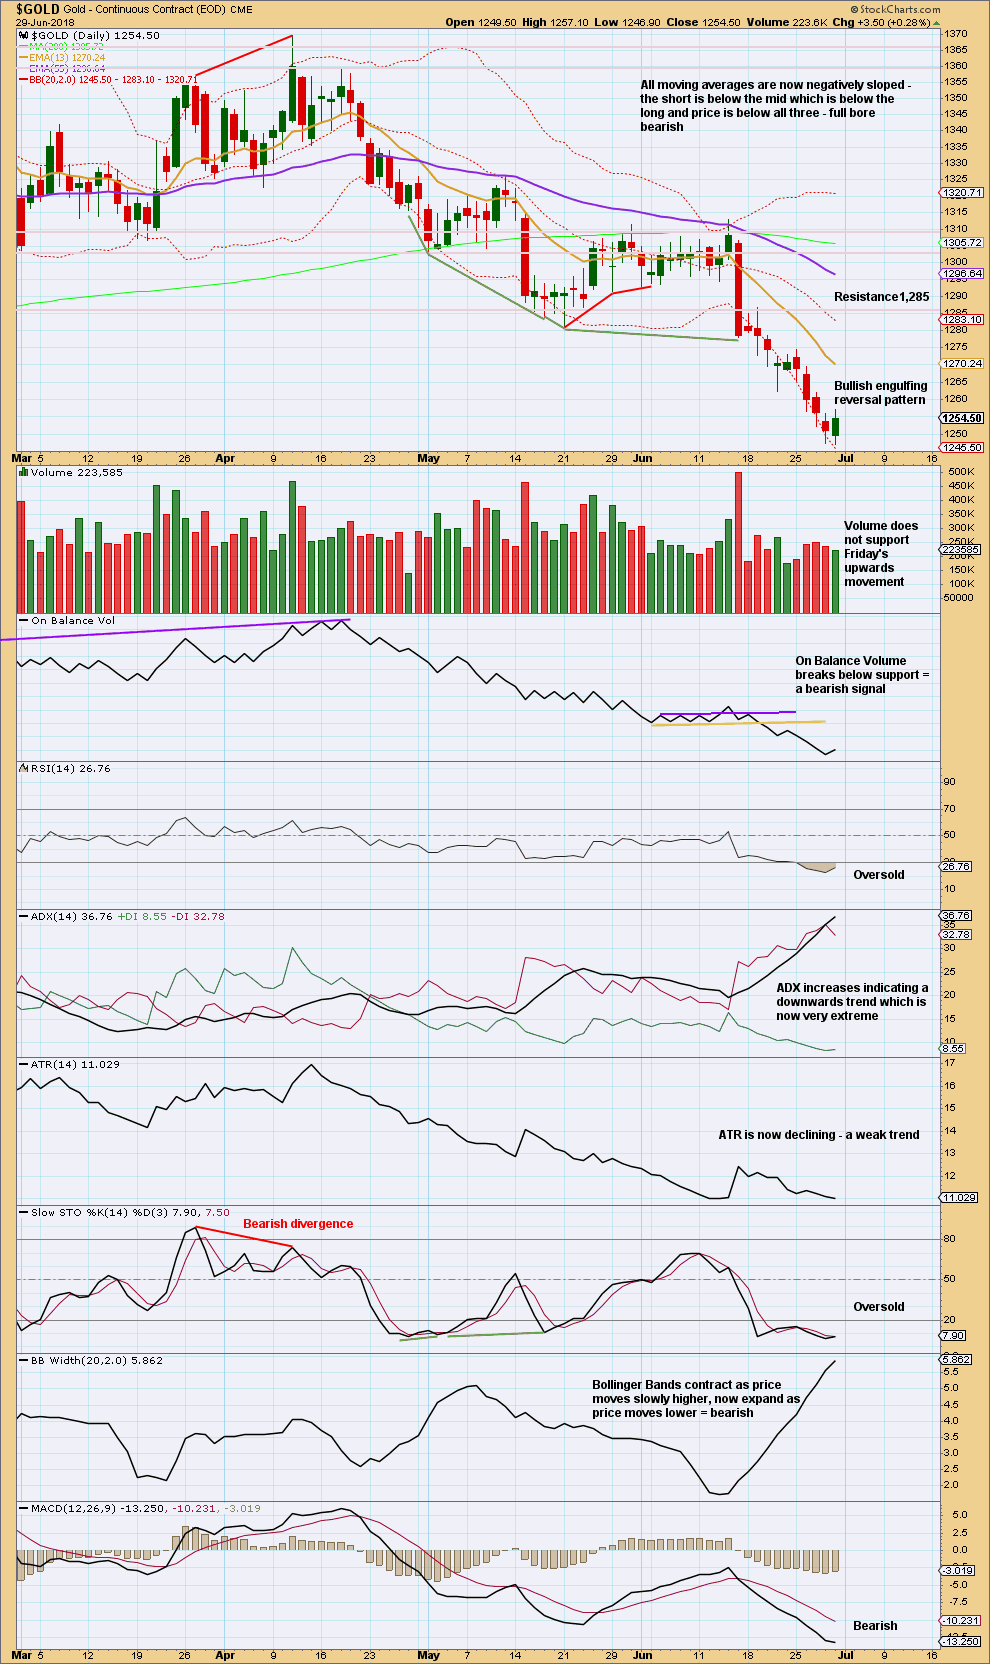
A bullish reversal pattern after a strong decline indicates a low may now be in place, at least for the short term. Candlestick reversal patterns make no comment on the direction of the next movement (sideways or a full reversal) nor for how long the next movement may last (from a few days to a new trend).
One to a very few days of consolidation may resolve RSI being oversold and ADX reaching very extreme.
Overall, this chart remains bearish, but the trend is now very extreme and an end to the trend may be approaching. However, Gold can maintain very extreme indicators for a reasonable period of time, and price can move a considerable distance before it finally ends.
GDX WEEKLY CHART
Click chart to enlarge. Chart courtesy of StockCharts.com.
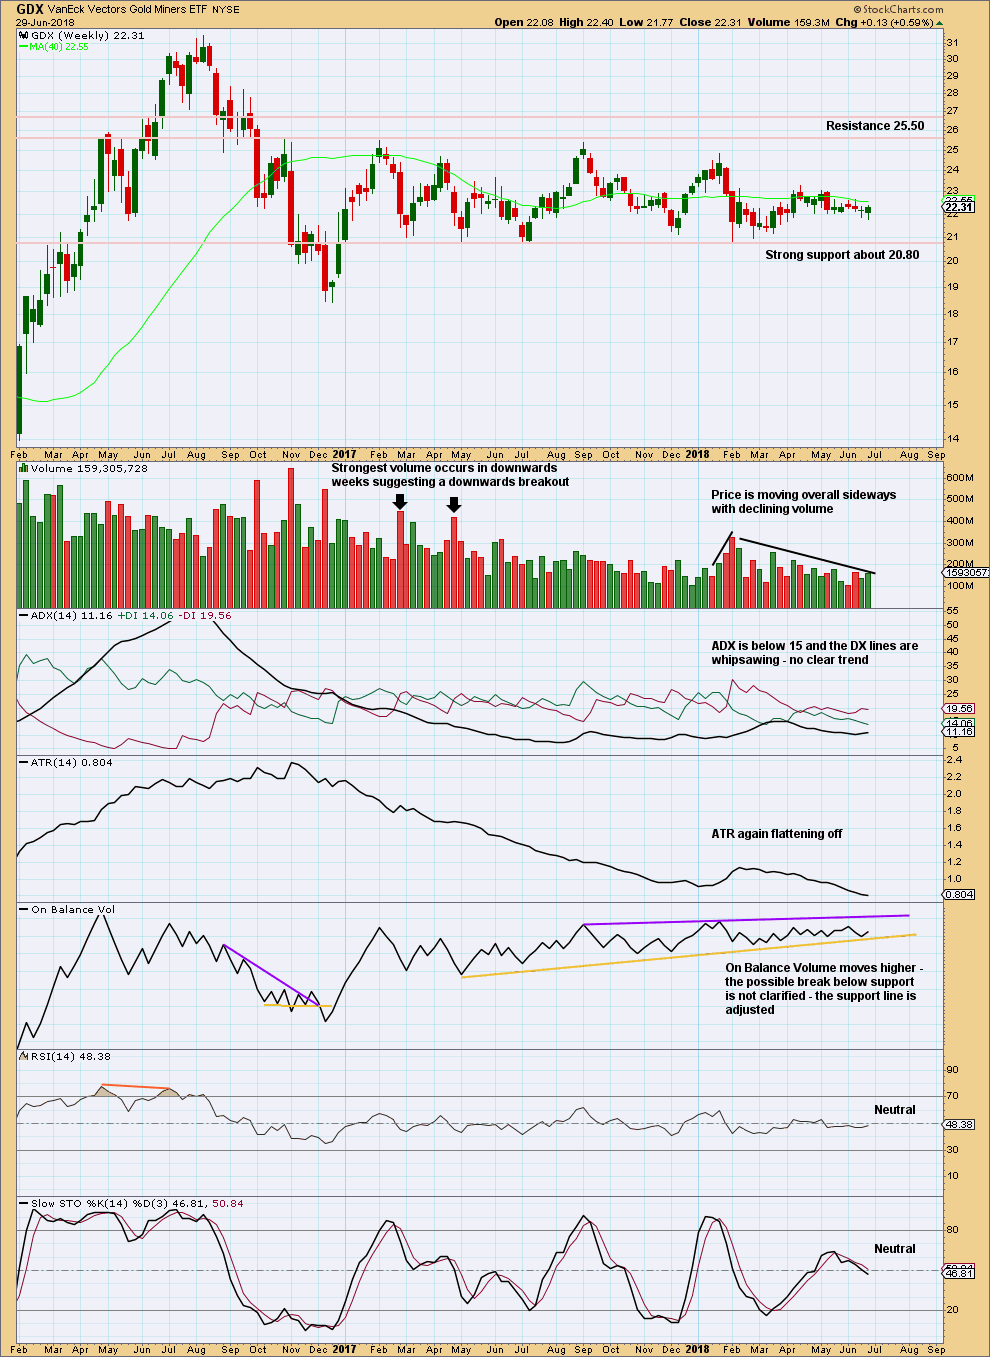
Support about 20.80 has been tested about eight times and so far has held. The more often a support area is tested and holds, the more technical significance it has.
In the first instance, expect this area to continue to provide support. Only a strong downwards day, closing below support and preferably with some increase in volume, would constitute a downwards breakout from the consolidation that GDX has been in for a year now.
Resistance is about 25.50. Only a strong upwards day, closing above resistance and with support from volume, would constitute an upwards breakout.
An upwards week this week has some support from volume and a long lower wick. It looks likely that GDX may move higher next week.
GDX DAILY CHART
Click chart to enlarge. Chart courtesy of StockCharts.com.
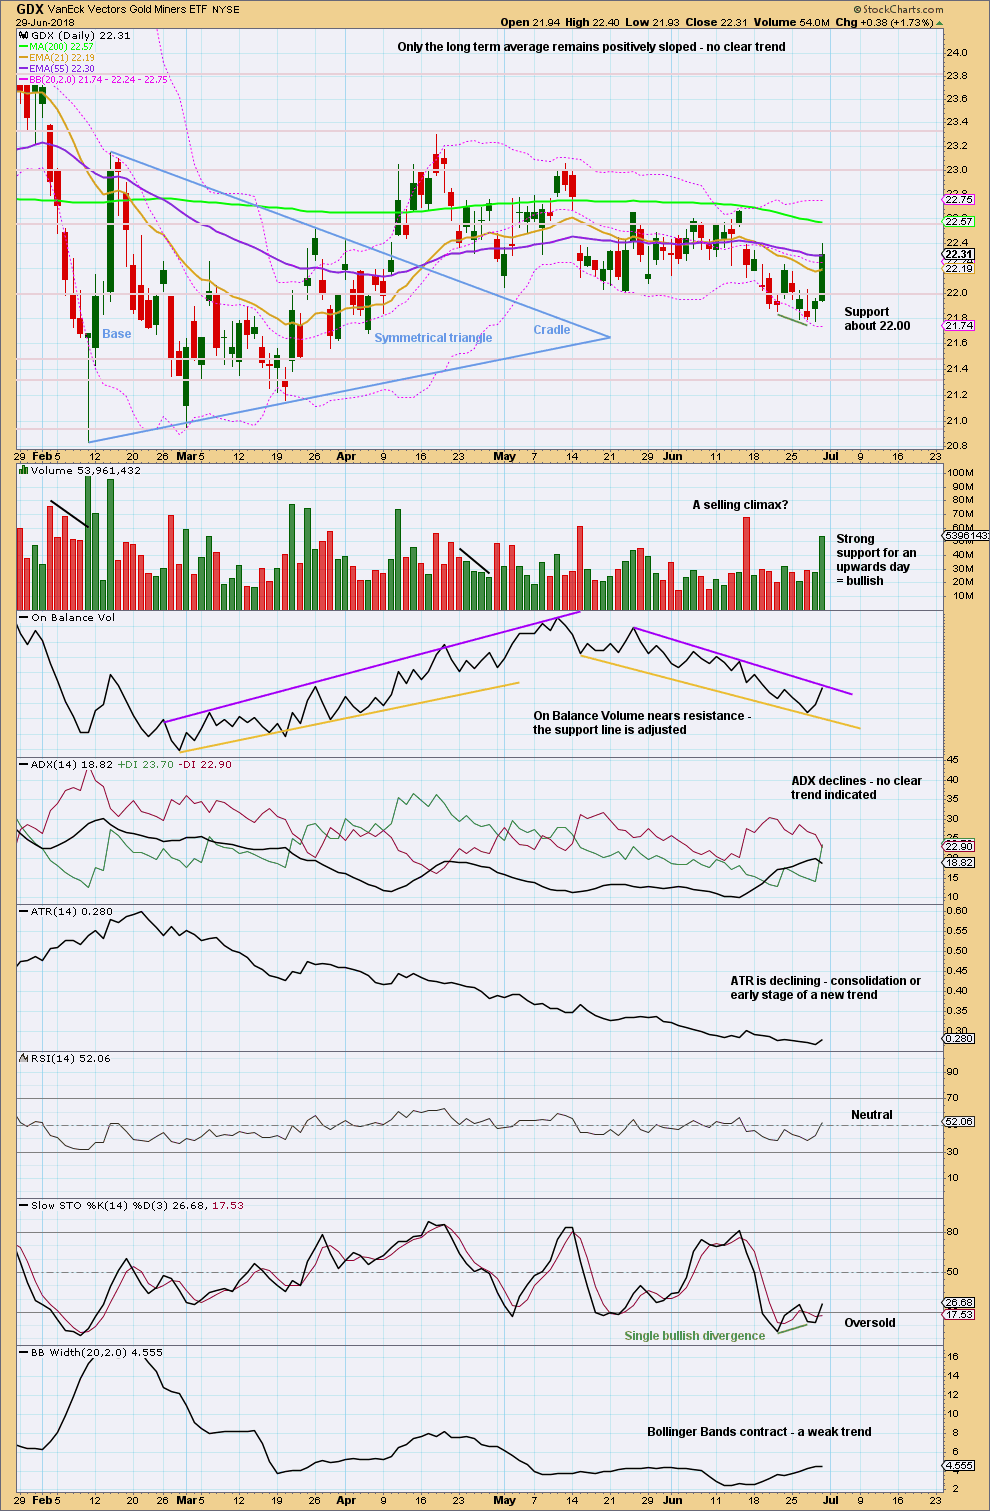
With price returning back into what was noted as a descending triangle, the downwards breakout is proven false. The structure is not a descending triangle.
GDX is again range bound.
On Balance Volume may provide a signal for the short to mid term.
US OIL
Last week’s analysis expected an upwards swing to continue at least for the short term, which could make a new high above 72.90. Price has moved higher to reach 74.46 for the week.
Summary: For the short term, while there is no candlestick reversal pattern, assume upwards movement shall continue until a reversal pattern or a long upper wick develops. When that happens, then expect the upwards swing has ended and a deep downwards swing may begin.
A deeper and longer lasting consolidation may have begun, which may last about 13 to 21 weeks in total. It should remain above 55.24, and the target is about 61.12. The consolidation will not move in a straight line; it may swing from resistance to support and back again in large swings. Once resistance and support are identified, then a swing trading system may be employed by more experienced traders. Support may now be about 63.0 and resistance may be as high as 72.5 to 73.0.
Always practice good risk management as the most important aspect of trading. Always trade with stops and invest only 1-5% of equity on any one trade. Failure to manage risk is the most common mistake new traders make.
MAIN WAVE COUNT
MONTHLY CHART
Click chart to enlarge.
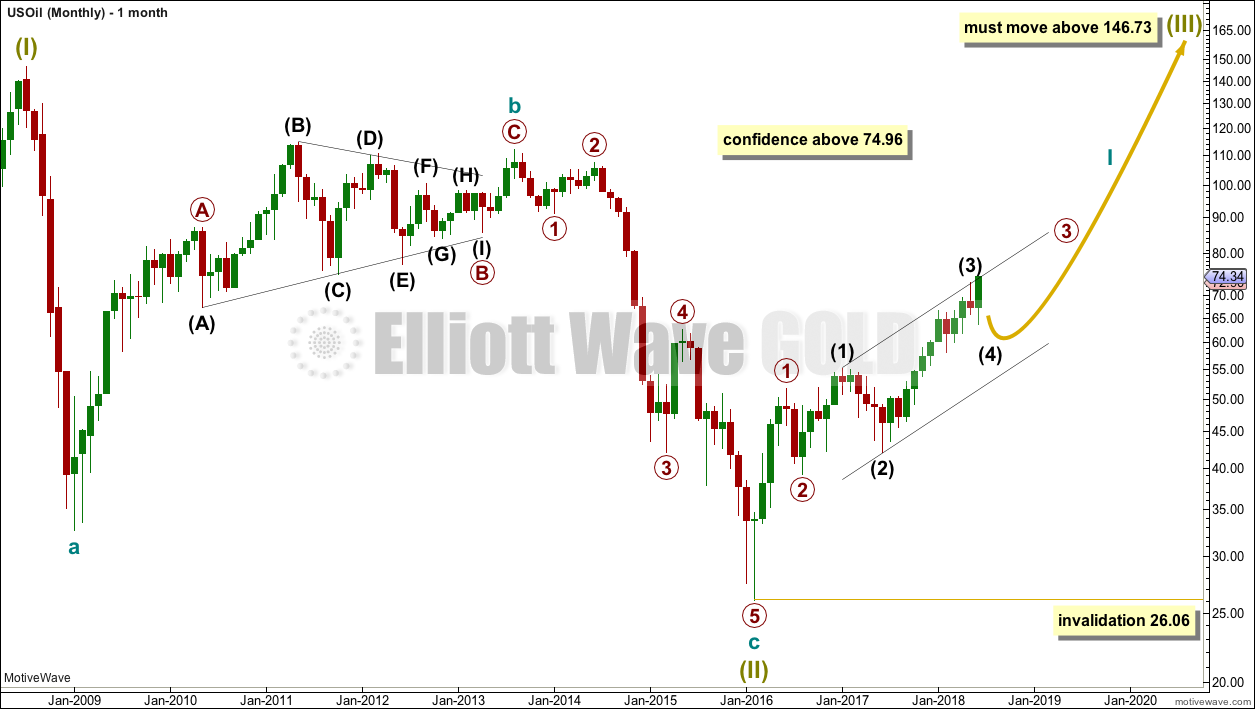
It is possible that the bear market for Oil is over and a new bull market is in the very early stages.
A huge zigzag down to the last low may be complete and is labelled here Super Cycle wave (II).
Cycle wave b must be seen as complete in August 2013 for this wave count to work. It cannot be seen as complete at the prior major swing high in May 2011.
Cycle wave b is seen as a zigzag, and within it primary wave B is seen as a running contracting triangle. These are fairly common structures, although nine wave triangles are uncommon. All subdivisions fit.
Primary wave C moves beyond the end of primary wave A, so it avoids a truncation. But it does not have to move above the price territory of primary wave B to avoid a truncation, which is an important distinction.
If cycle wave b begins there, then cycle wave c may be seen as a complete five wave impulse.
Super Cycle wave (III) must move beyond the end of Super Cycle wave (I). It must move far enough above that point to allow room for a subsequent Super Cycle wave (IV) to unfold and remain above Super Cycle wave (I) price territory.
Cycle wave I may be incomplete. It may be unfolding as an impulse and may have now moved through the middle portion. Commodities have a tendency to exhibit swift strong fifth waves, and this tendency is especially prevalent for third wave impulses. Intermediate wave (5) to end primary wave 3 may be very swift and strong, ending with a blow off top.
When cycle wave I is complete, then cycle wave II may be a deep correction that may not move beyond the start of cycle wave I below 26.06.
Data from FXCM for USOil does not go back to the beginning of Super Cycle wave (I). Without an accurate known length of Super Cycle wave (I) a target cannot be calculated for Super Cycle wave (III) to end using Fibonacci ratios. The target for Super Cycle wave (III) may be calculated when cycle waves I, II, III and IV within it are complete. That cannot be done for many years.
WEEKLY CHART
Click chart to enlarge.
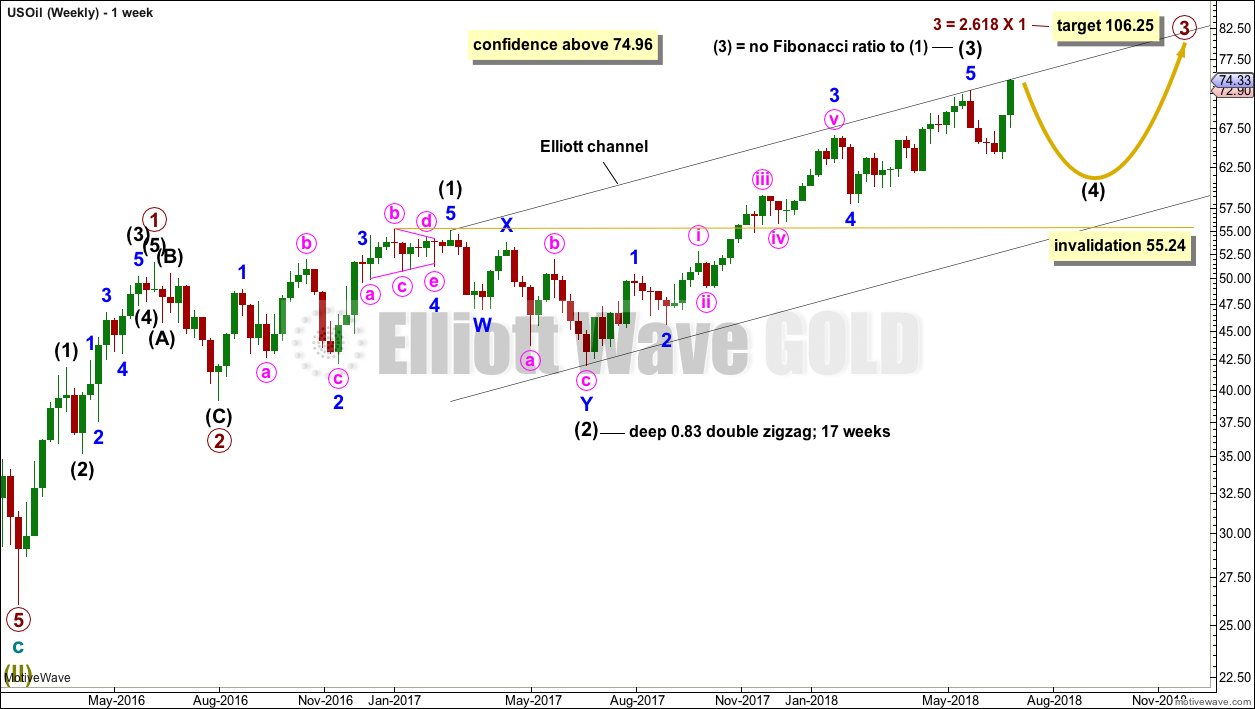
Intermediate wave (3) may now be complete. There is no Fibonacci ratio between intermediate waves (1) and (3), and intermediate wave (3) is longer than 1.618 the length of intermediate wave (1).
This wave count fits with classic technical analysis at the monthly and daily chart levels.
Intermediate wave (2) was a deep double zigzag. Given the guideline of alternation, intermediate wave (4) may be expected to most likely be a shallow flat, triangle or combination. It may be about even in duration with intermediate wave (2), or it may be a little longer because triangles and combinations are more time consuming structures.
In the first instance, a Fibonacci 13 weeks may be expected for intermediate wave (4). If about that time the structure is incomplete, then the next Fibonacci number in the sequence at 21 will be expected.
Intermediate wave (4) may find support about the lower edge of the black Elliott channel. It may end within the price territory of the fourth wave of one lesser degree; minor wave 4 has its territory from 66.65 to 59.13.
DAILY CHART
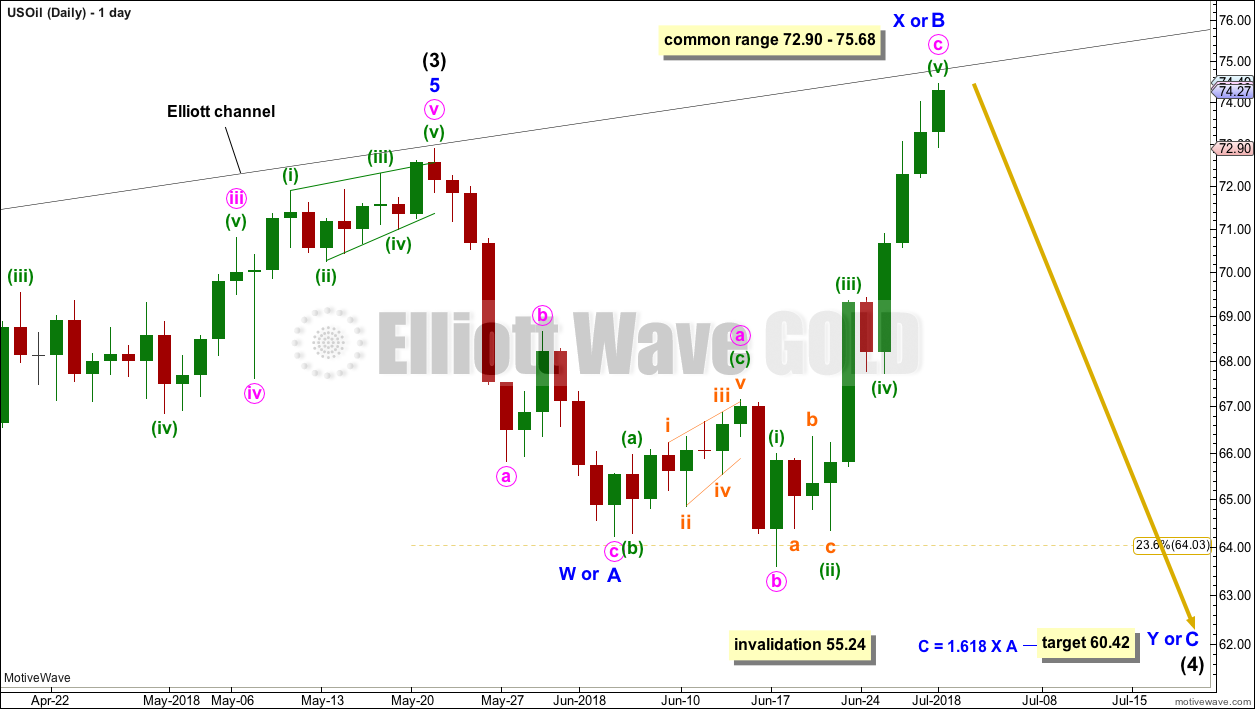
Click chart to enlarge.
If intermediate wave (4) unfolds as a double combination, flat or triangle, then the first wave down within it would be a three wave structure and most likely a zigzag.
All of a flat, combination or triangle may have within them a new high above the start of intermediate wave (4) at 72.90 as in an expanded flat, running triangle or wave X of a double combination. There can be no upper invalidation point for this reason.
It is impossible at this stage to tell which of several possible structures intermediate wave (4) may be, only that it is least likely to be a single or multiple zigzag. Focus will be on identifying when intermediate wave (4) may be over.
The zigzag down may be minor wave A within a flat or triangle for intermediate wave (4), or it may be a zigzag within a double combination for intermediate wave (4).
The movement labelled minor wave B or X looks like an expanded flat correction. Minute wave c now fits as a completed five wave impulse. If it is over at this week’s high, then minor wave B or X is a 1.18 length of minor wave A or W. This is within the common range of 1 to 1.38 for wave B of a flat correction.
If intermediate wave (4) is unfolding as a flat correction, then within it minor wave B has now met the minimum 0.9 length of minor wave A.
If intermediate wave (4) is unfolding as a triangle, then there is no minimum requirement for minor wave B within it.
If intermediate wave (4) is unfolding as a combination, then there is no minimum nor maximum length required for minor wave X.
Intermediate wave (4) may not move into intermediate wave (1) price territory below 55.24.
For the short term, although this chart shows an expectation of downwards movement from here, there is no indication from candlesticks at the end of the week that upwards movement is ending. It must be accepted that it is entirely possible that price may move higher still before it turns, and it would mostly likely end at or before 75.68.
If a long upper wick develops in the next few days, then some small confidence that a high is in place may be had.
ALTERNATE DAILY CHART
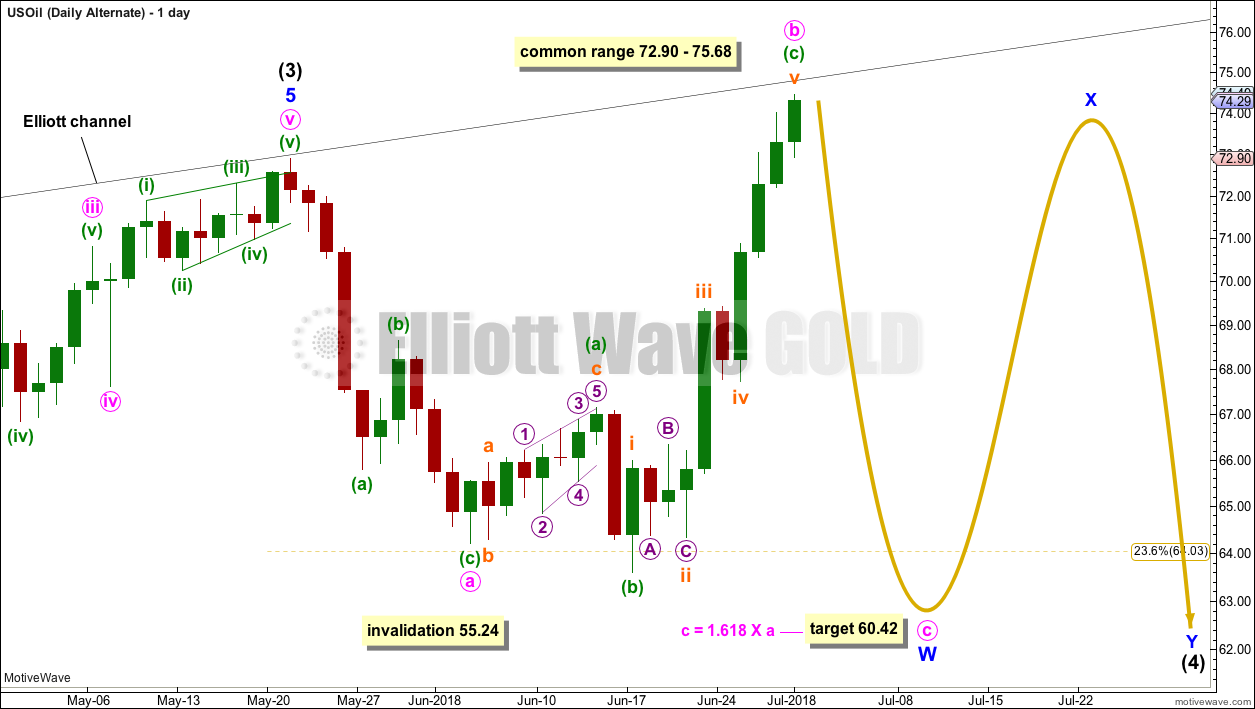
Click chart to enlarge.
This alternate wave count is identical to the first daily chart above except for the degree of labelling within intermediate wave (4) which is moved down one degree.
Intermediate wave (4) may be unfolding as a double combination, with the first structure in a double a flat correction labelled minor wave W. Double combinations are very common structures.
The short term expectation for some downwards movement about here is exactly the same for both wave counts. If minute wave b moves higher, then it would most likely end at or before 75.68.
ALTERNATE WAVE COUNT
MONTHLY CHART
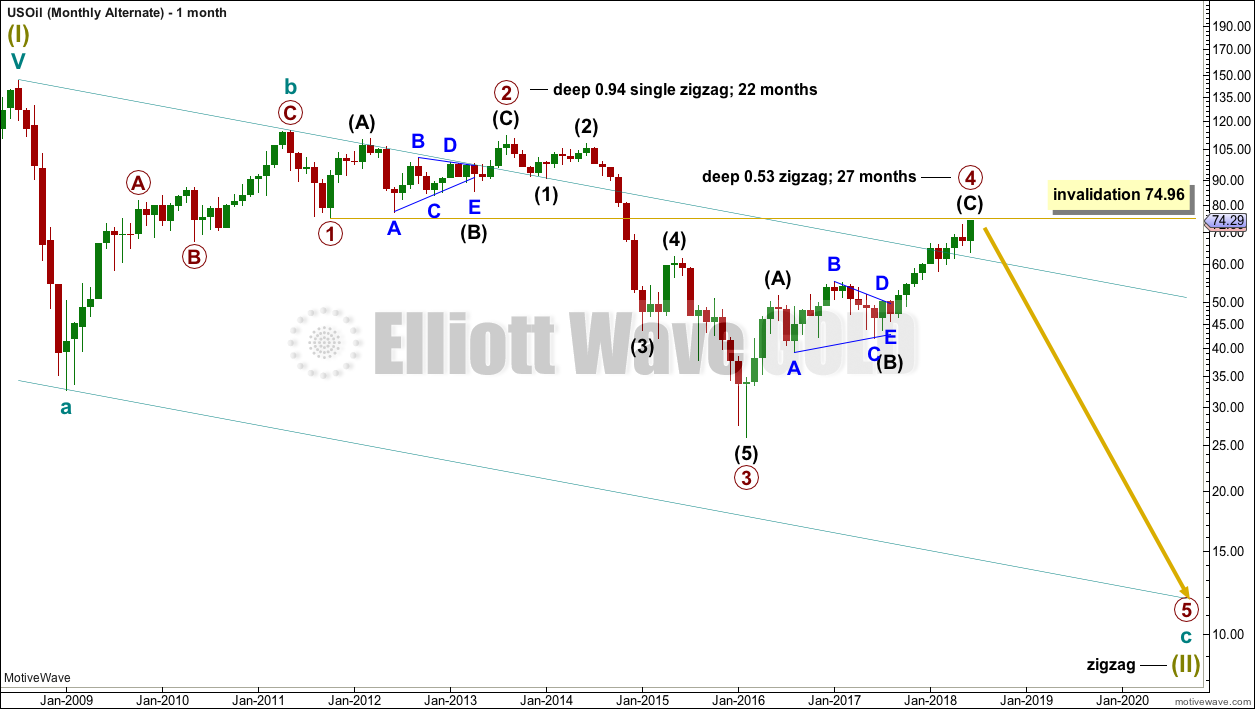
Click chart to enlarge.
Within the bear market, cycle wave b is seen as ending in May 2011. Thereafter, a five wave structure downwards for cycle wave c begins.
Primary wave 1 is a short impulse lasting five months. Primary wave 2 is a very deep 0.94 zigzag lasting 22 months. Primary wave 3 is a complete impulse with no Fibonacci ratio to primary wave 1. It lasted 30 months.
There is now little alternation in depth between primary waves 2 and 4. Primary wave 2 is very deep, but primary wave 4 is also now deep. There is inadequate alternation in structure, both are zigzags. The lack of alternation in this wave count must reduce its probability. So far primary wave 4 has lasted 27 months. At this stage, there is still reasonable proportion between primary waves 2 and 4.
Primary wave 4 may not move into primary wave 1 price territory above 74.96.
The wider Elliott channel (teal) about this whole movement may offer support to primary wave 5.
WEEKLY CHART
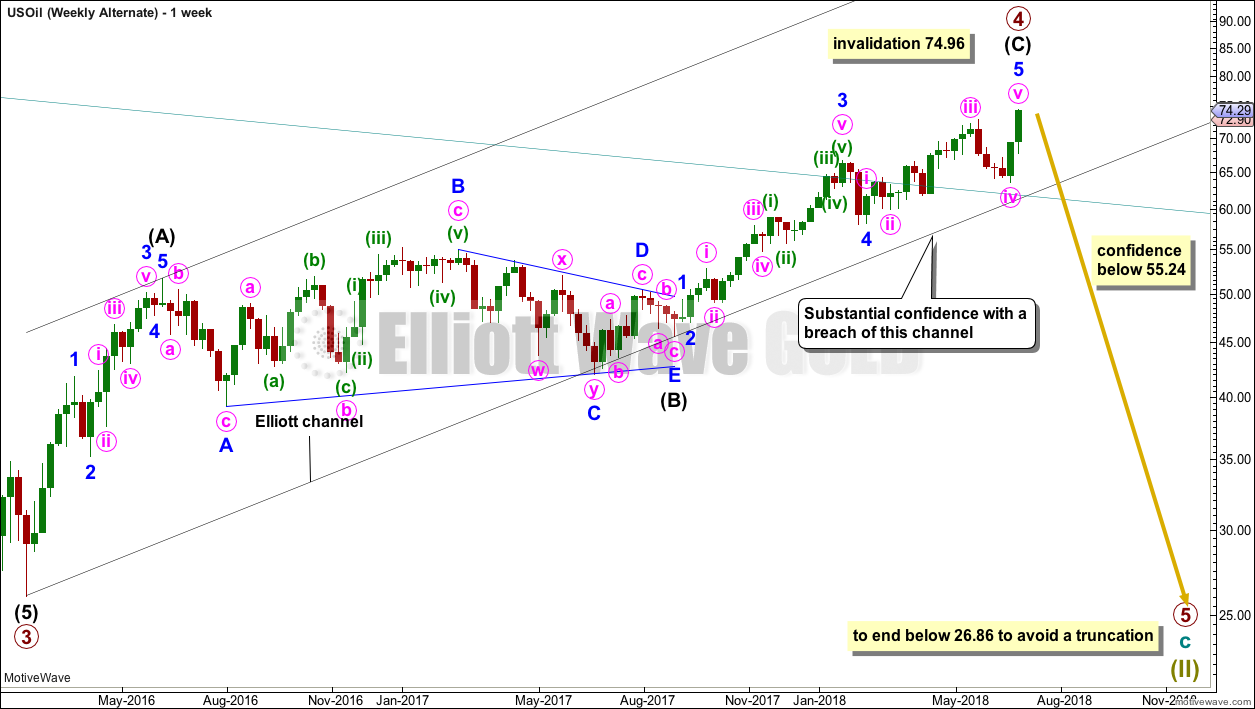
Click chart to enlarge.
This wave count now expects a huge trend change for a new wave down for primary wave 5, which may last about a year or so. Primary wave 5 would be likely to make at least a slight new low below 26.86 to move below the end of primary wave 3 and avoid a truncation.
An Elliott channel is added to this possible zigzag for primary wave 4. A breach of the lower edge of this channel would provide a very strong indication that primary wave 4 should be over and primary wave 5 should be underway. Look out for some support on the way down, perhaps a short term bounce about the lower edge of the channel.
A new low now below 55.24 would invalidate the main wave count and in turn offer some confidence to this alternate.
It is possible that upwards movement this week is a continuation of minor wave 5. This will fit at the daily chart level.
At this stage, this wave count is looking increasingly unlikely; a daily chart shall no longer be published for it.
TECHNICAL ANALYSIS
MONTHLY CHART
Click chart to enlarge. Chart courtesy of StockCharts.com.
Friday’s session is the last session for the month of June, so some conclusions may now be drawn for this last monthly candlestick.
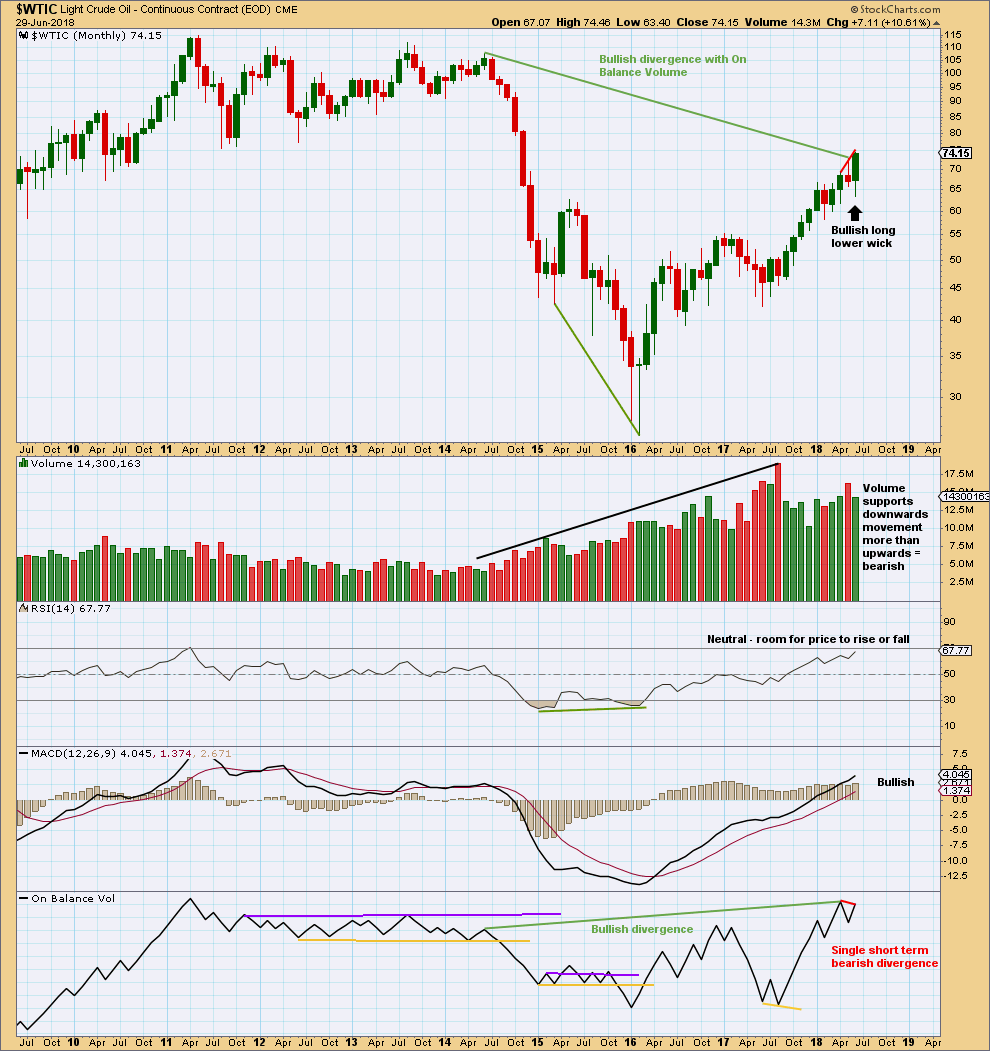
The short term volume profile is bearish: the strongest month in the last few months was the downwards month of May (where the balance of volume was down) and now June shows a decline in volume, so volume has not supported upwards movement here.
For the short term, On Balance Volume is also slightly bearish. This supports the idea that price may be within a correction and not necessarily a continuation of the larger upwards trend.
However, it is entirely possible that this situation could reverse and volume could start to support upwards movement, as has happened back in January 2018.
The larger trend is upwards.
DAILY CHART
Click chart to enlarge. Chart courtesy of StockCharts.com.
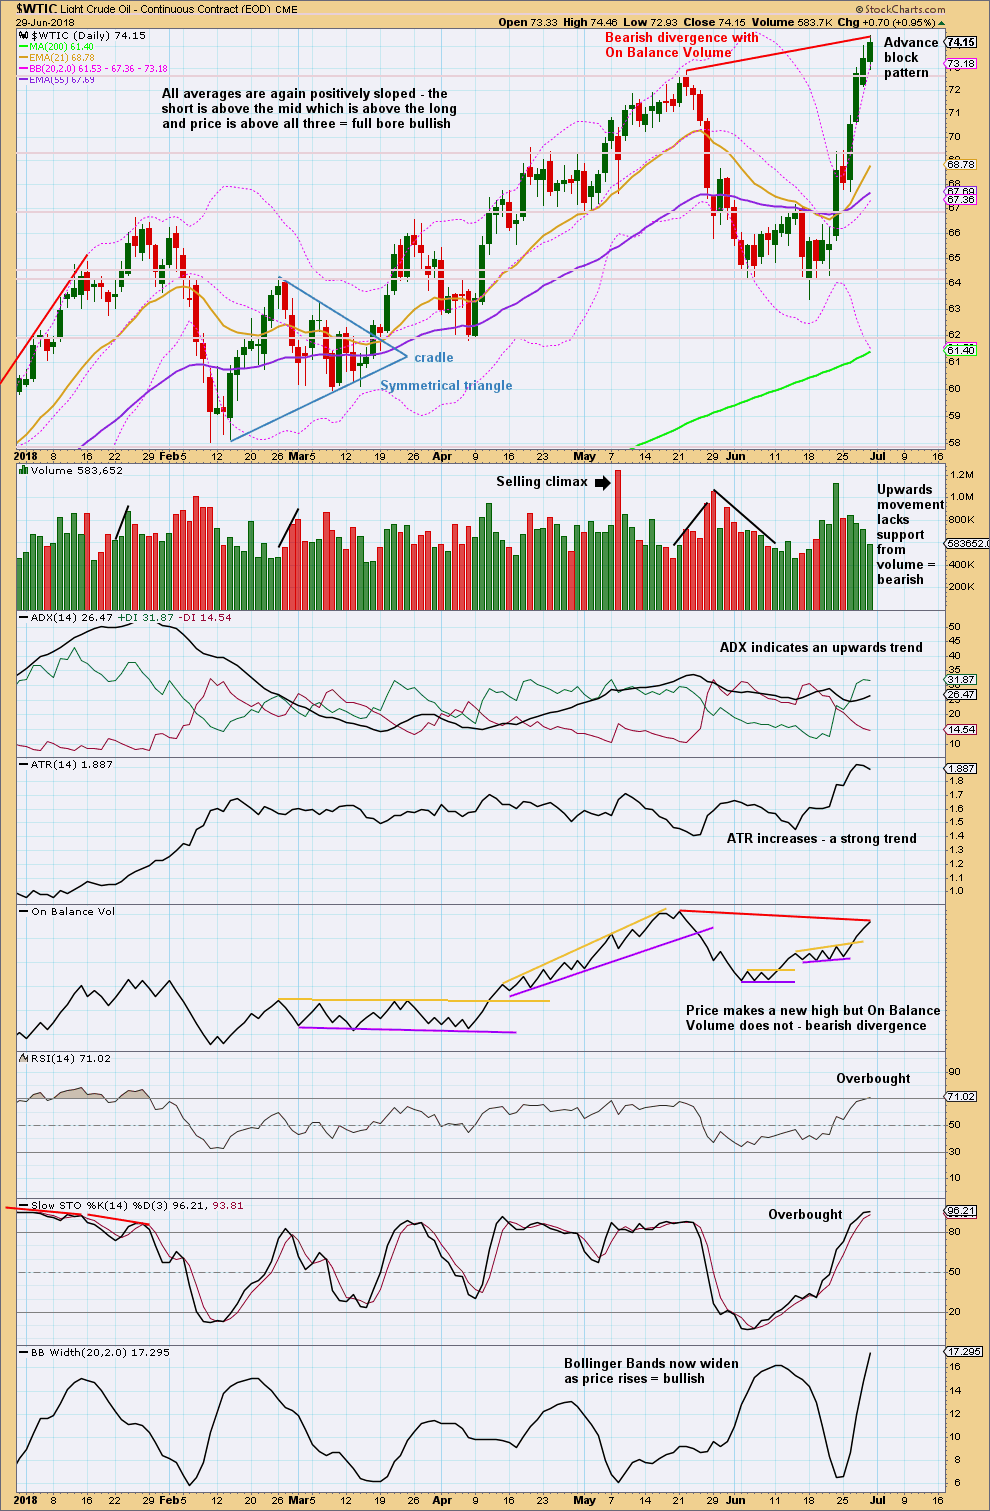
Upwards movement is showing some weakness. At this stage, with the data in hand, this must be read as somewhat bearish.
However, there is as yet no candlestick reversal pattern and no long upper candlestick wicks to suggest a high is in place here. The best approach here may be to assume that an upwards trend remains in place until price proves it has ended.
Gold and oil appear to be difficult to trade right now. SPX, however, appears to have entered a period of trending upwards making it much easier to trade.
Thanks Lara.
I agree. I’m glad to know you are feeling good about the prospects.
Agreed here too. The trick is entering at the end of a pullback, or close to it. And holding on.