
A little more downwards movement towards the Elliott wave target at 1,238 was expected. Price did make a slight new low, but fell short of the target by $3.40. Thereafter, a breach of the channel on the hourly chart indicated a low was likely in place for the short term.
Summary: A multi day to multi week consolidation is likely still unfolding. It may be a sideways consolidation to last one to two weeks, remaining below 1,282.20. At this stage, it may be only about one third complete.
Minor wave 4 may now be a triangle or combination. Look now for upwards movement for a few days.
When the consolidation is complete, then a final wave down to a final low is expected. The mid term target is 1,216 – 1,211. Downwards movement may be limited to no lower than 1,123.08.
Always trade with stops to protect your account. Risk only 1-5% of equity on any one trade.
At the end of this week, it may be a good idea to note that neither Gold nor Silver have made new swing lows below the prior major swing lows of December 2017. They have both come very close, but both have failed by a small margin. This must be interpreted as bullish, until proven otherwise.
New updates to this analysis are in bold.
Grand SuperCycle analysis is here.
Last historic analysis with monthly charts and several weekly alternates is here, video is here.
There are six weekly charts published in the last historic analysis. All but two expect more downwards movement at this time; the two bullish wave counts would be invalidated below 1,236.54. Because the remaining four bearish wave counts all expect the same movement next only one shall be published on a daily basis. Members should keep the other wave counts in mind. They will be published on a daily basis if they begin to diverge from the triangle wave count.
MAIN ELLIOTT WAVE COUNT
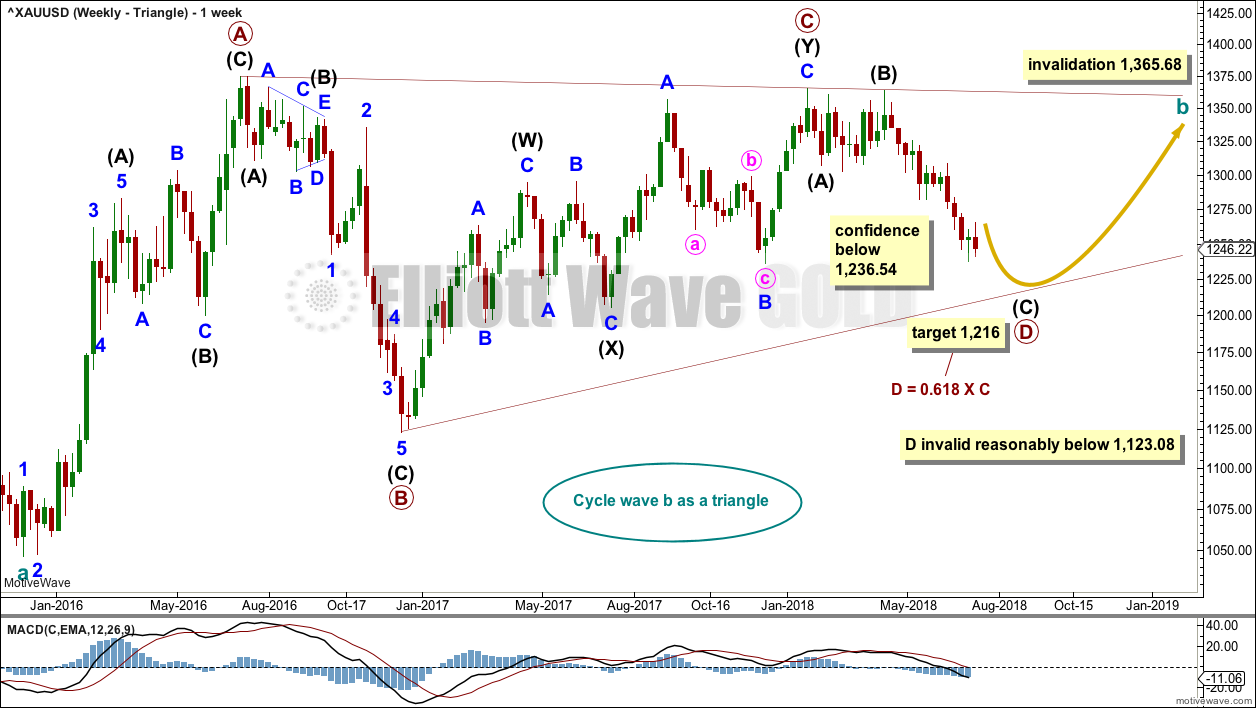
WEEKLY CHART – TRIANGLE
Click chart to enlarge.
The triangle so far has the best fit and look. If price shows a combination or flat may be more likely, then those ideas may be published on a daily basis. The flat and combination ideas expect movement reasonably below 1,123.08, or perhaps a new low below 1,046.27.
Cycle wave b may be an incomplete triangle. The triangle may be a contracting or barrier triangle, with a contracting triangle looking much more likely because the A-C trend line does not have a strong slope. A contracting triangle could see the B-D trend line have a stronger slope, so that the triangle trend lines converge at a reasonable rate. A barrier triangle would have a B-D trend line that would be essentially flat, and the triangle trend lines would barely converge.
Within a contracting triangle, primary wave D may not move beyond the end of primary wave B below 1,123.08. Within a barrier triangle, primary wave D may end about the same level as primary wave B at 1,123.08, so that the B-D trend line is essentially flat. Only a new low reasonably below 1,123.08 would invalidate the triangle.
Within both a contracting and barrier triangle, primary wave E may not move beyond the end of primary wave C above 1,365.68.
Four of the five sub-waves of a triangle must be zigzags, with only one sub-wave allowed to be a multiple zigzag. Primary wave C is the most common sub-wave to subdivide as a multiple, and this is how primary wave C for this example fits best.
Primary wave D must be a single structure, most likely a zigzag.
One triangle sub-wave tends to be close to 0.618 the length of its predecessor; this gives a target for primary wave D.
There are no problems in terms of subdivisions or rare structures for this wave count. It has an excellent fit and so far a typical look.
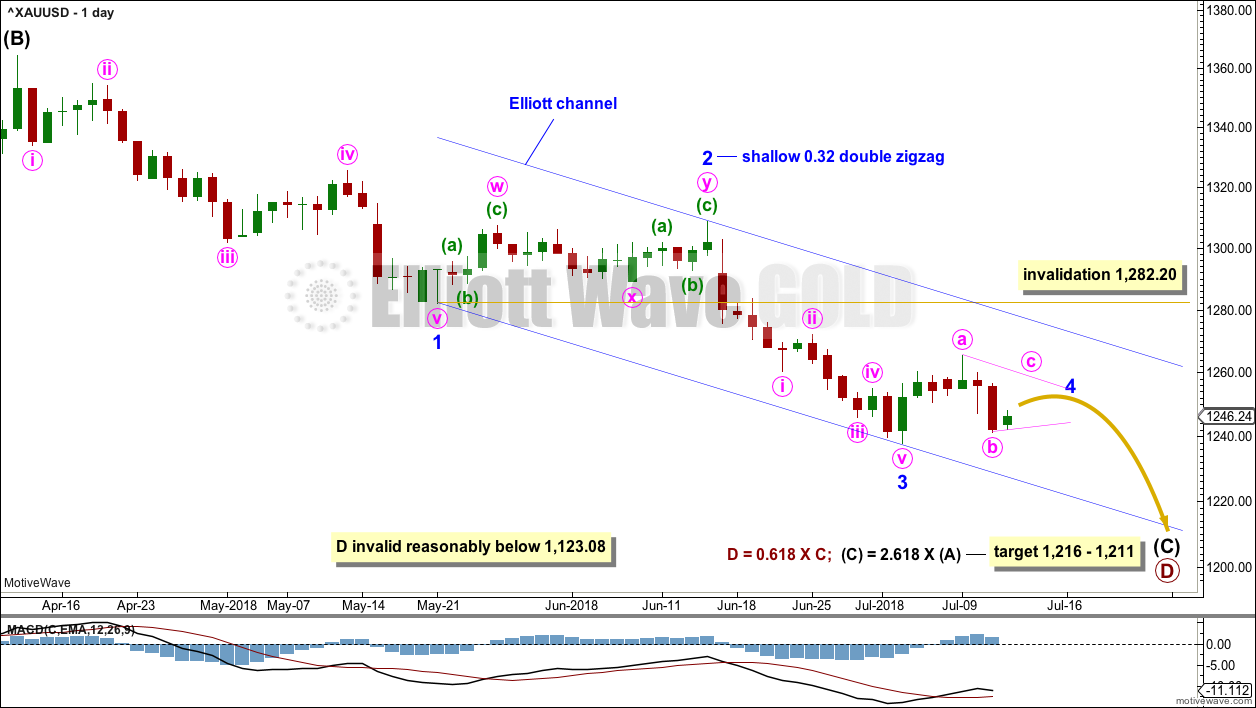
DAILY CHART – TRIANGLE
Click chart to enlarge.
Primary wave D may be unfolding lower as a single zigzag, and within it intermediate waves (A) and (B) may be complete.
The target is widened to a $5 zone calculated at two degrees. This should have a reasonable probability.
Within intermediate wave (C), it looks likely that all of minor waves 1, 2 and 3 may now be over. Minor wave 4 may have begun.
Minor wave 2 fits as a double zigzag, and was shallow. Given the guideline of alternation, minor wave 4 may most likely be a flat, combination or triangle; it may be very shallow, but more likely it may be deep in order to exhibit alternation with minor wave 2.
Minor wave 2 lasted 18 days, and it shows up on the weekly chart. Fourth waves for Gold are often quicker than second waves; minor wave 4 may last about one or two weeks. To label it over at the last high, labelled minute wave a, would see it too brief and would exhibit poor alternation with minor wave 2.
Minor wave 4 may not move into minor wave 1 price territory above 1,282.20.
Adjust the channel to fit as an Elliott channel drawn using Elliott’s first technique. If it is long lasting enough, then minor wave 4 may find resistance about the upper edge of this channel.
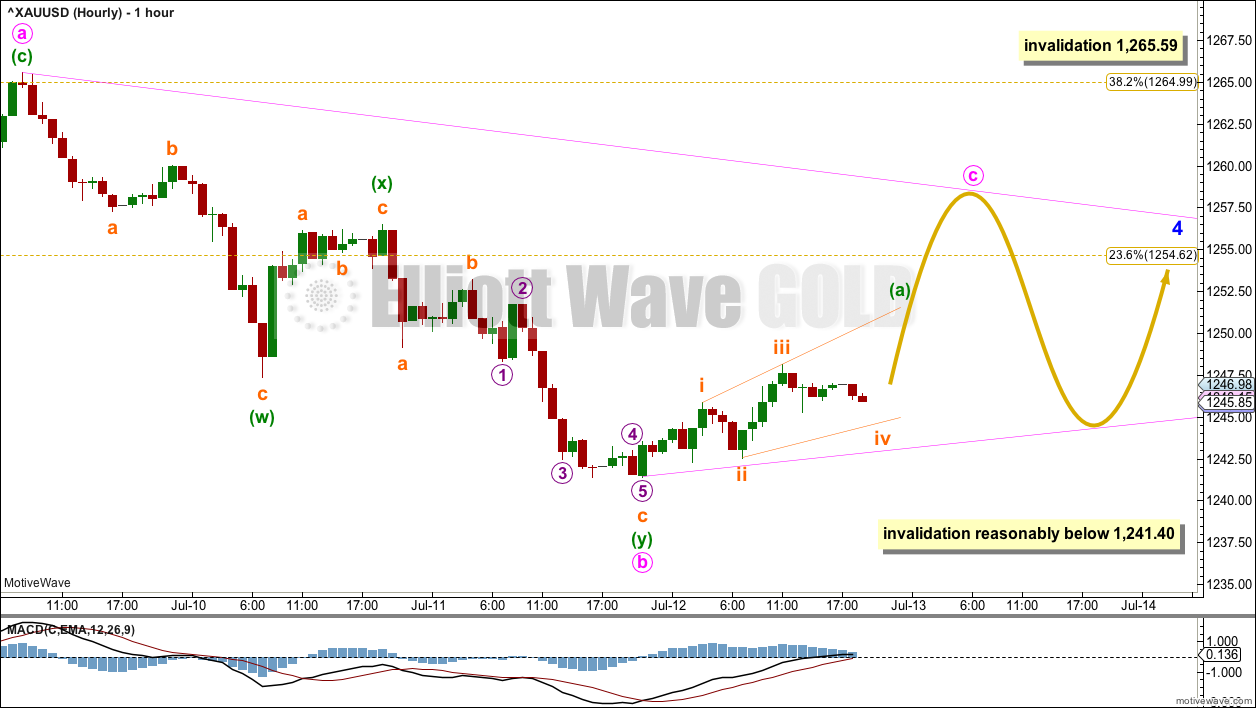
HOURLY CHART – TRIANGLE
Click chart to enlarge.
If minor wave 4 is unfolding as a triangle, then within it both of minute waves a and b may now be complete.
Minute wave b fits best as a double zigzag. Only one sub-wave within a triangle may subdivide as a multiple. All remaining sub-waves must now be single corrective structures, most likely zigzags.
Minute wave c may not move beyond the end of minute wave a above 1,265.59. A reasonable target range for minute wave c may be about 0.80 to 0.85 the length of minute wave b at 1,261 to 1,262.
Minute wave d of a contracting triangle may not move beyond the end of minute wave b below 1,241.40. Minute wave d of a barrier triangle may end about the same level as minute wave b at 1,241.40, so that the b-d trend line is essentially flat. In practice this means that minute wave d may end slightly below 1,241.40 and the triangle would remain valid.
Finally, minute wave e may not move beyond the end of minute wave c.
A triangle would expect a few more days or so of choppy and overlapping sideways movement in an ever decreasing range.
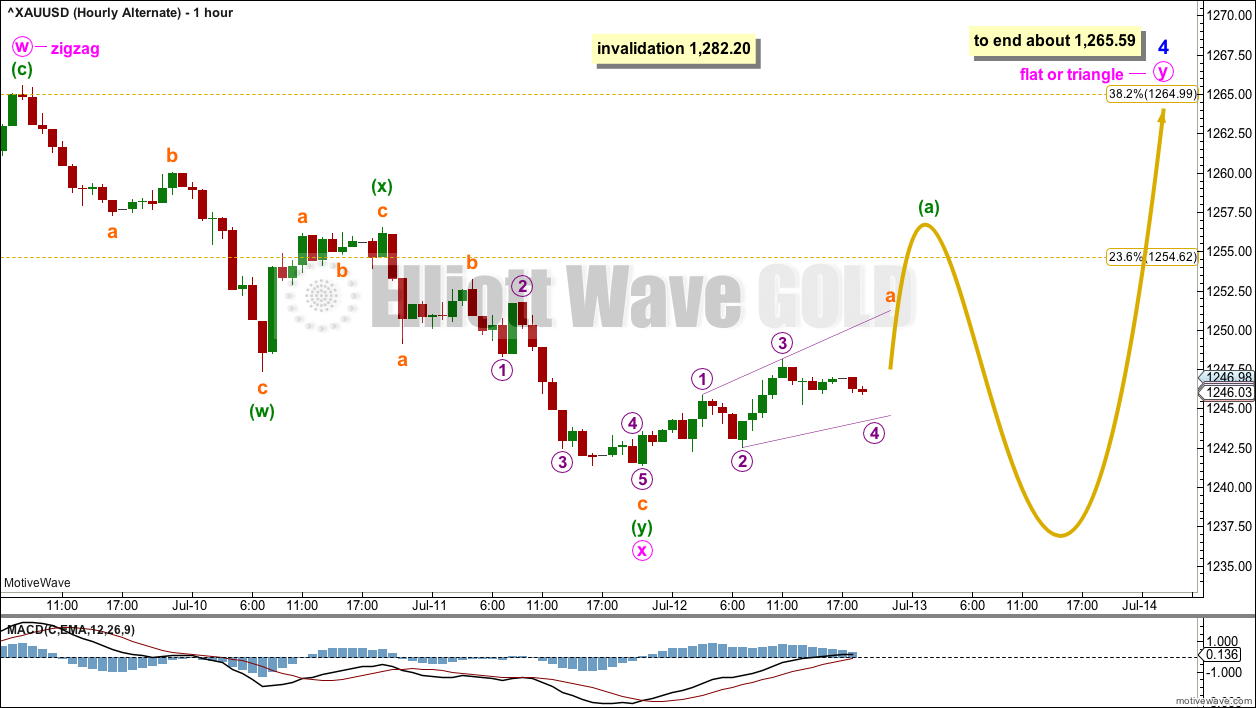
HOURLY CHART – COMBINATION
Click chart to enlarge.
It is essential to also consider an alternate to a triangle. There have been times I have labelled a triangle unfolding, or possibly even complete, and then the triangle is invalidated and the structure turns out to be something else, usually a combination.
If a combination is unfolding, then the first structure in the double may be a complete zigzag labelled minute wave w.
The double may now be joined by a corrective structure in the opposite direction labelled minute wave x. X waves within combinations may be any corrective structure, including multiples (although this is not common).
Within combinations, the maximum number of corrective structures is three: this maximum refers to W, Y and Z. Each of W, Y and Z may only subdivide as a single corrective structure labelled A-B-C (or A-B-C-D-E as in the case of triangles). They may not subdivide as multiples because that would increase the total number of structures in the combination beyond three, breaking the Elliott wave rule.
This is the most commonly misapplied Elliott wave rule I see others make. Any Elliott wave labelling that has W-X-Y-Z and each of W, Y and Z themselves labelled W-X-Y-Z breaks this Elliott wave rule and has no predictive value. Use this as a quick and easy way to tell if the labelling of combinations you are considering is worthy of your time and attention.
Because minor wave 2 was a double zigzag this is the least likely structure for minor wave 4 to unfold as. A double combination is labelled in the same way, but is a very different structure.
If minor wave 4 is a double combination, then minute wave y may be either a flat or a triangle. A flat correction is much more common within a combination and so more likely. Within a flat correction, minuette wave (b) may make a new price extreme beyond the start of minuette wave (a) below 1,241.40 as in an expanded flat.
The purpose of double combinations is to take up time and move price sideways. To achieve this purpose the second structure in a double combination usually ends about the same level as the first structure. Minute wave y may end about 1,265.59.
While double combinations are fairly common structures, triple combinations are extremely rare. When a second structure in a multiple is complete, the probability that the whole correction is complete is extremely high.
TECHNICAL ANALYSIS
WEEKLY CHART
Click chart to enlarge. Chart courtesy of StockCharts.com.
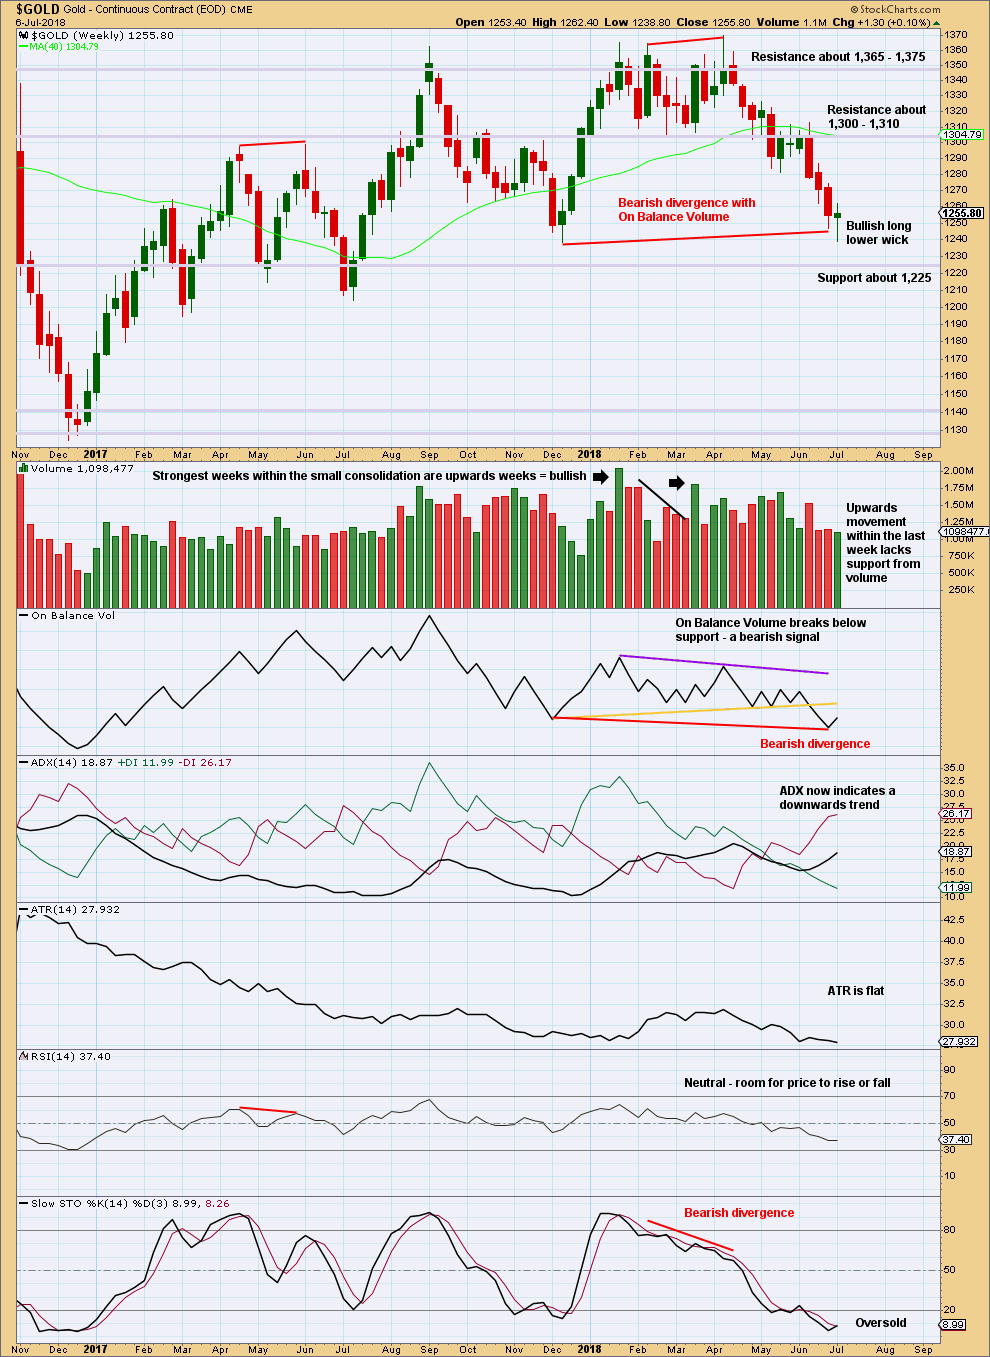
On Balance Volume has made a new swing low below the prior swing low, but price has not. On Balance Volume should be read as a leading indicator, so this is bearish and indicates price may likely follow through with a new swing low below 1,238.30.
The last weekly candlestick is bullish, and a short term bullish view has support from single week divergence between price and On Balance Volume, Stochastics and RSI; price made a new low last week, but none of On Balance Volume, Stochastics or RSI made new lows as they all moved higher.
DAILY CHART
Click chart to enlarge. Chart courtesy of StockCharts.com.
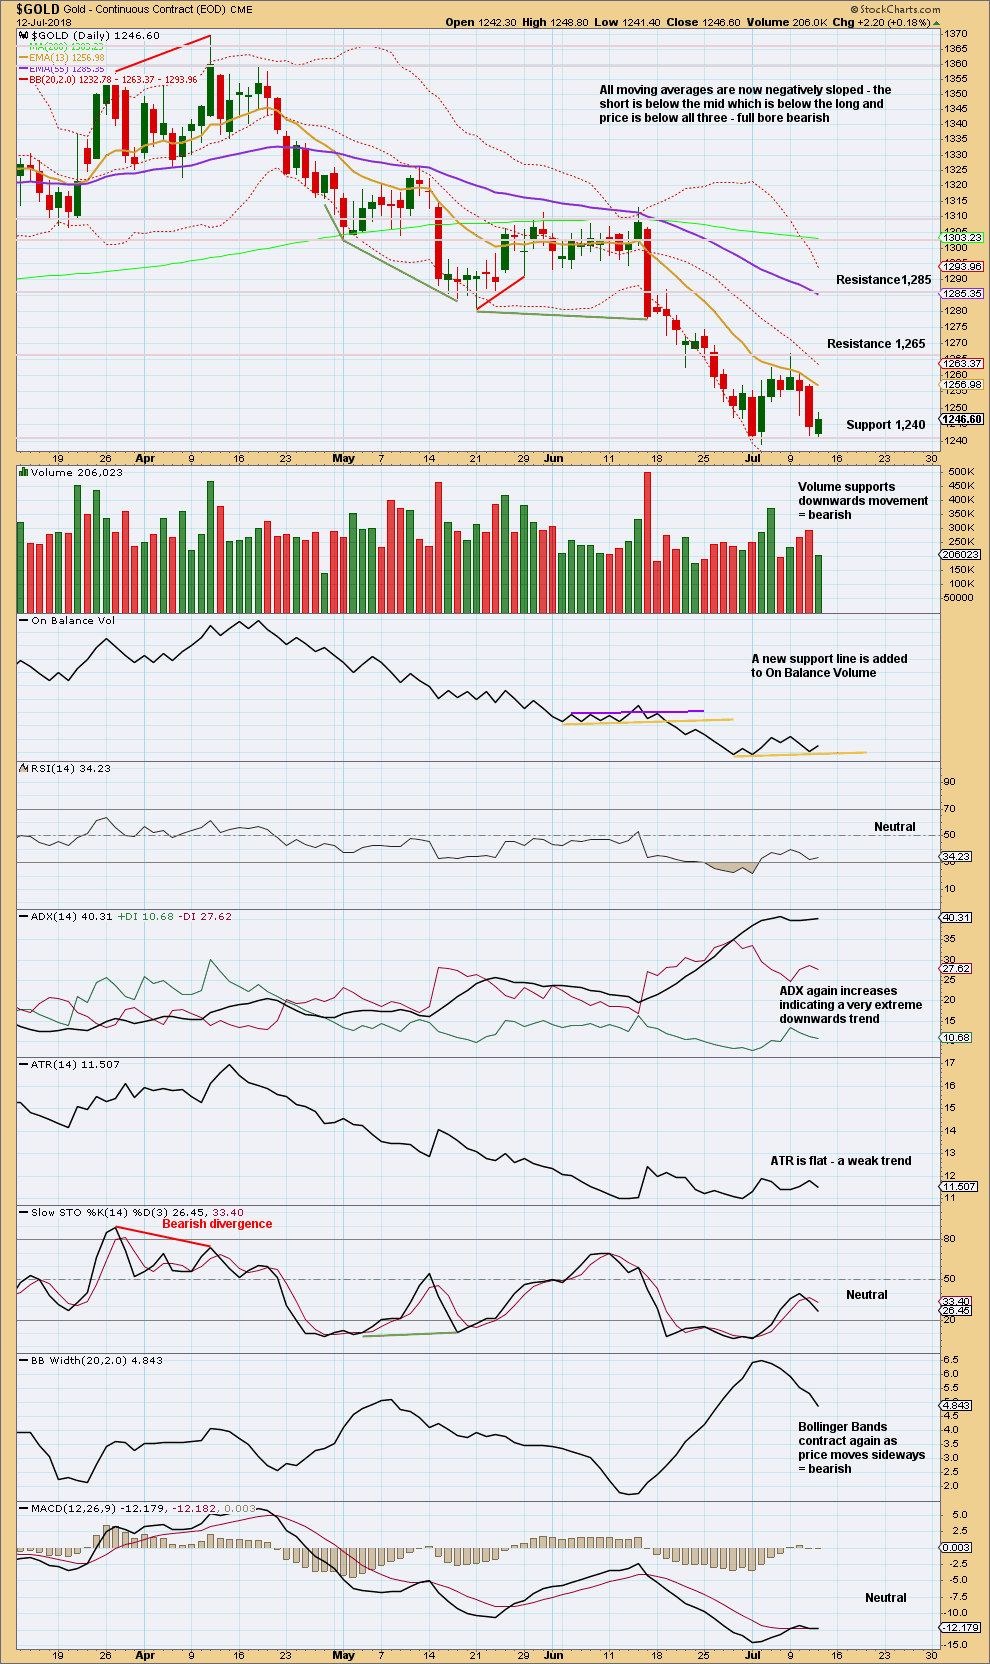
A small range day has a balance of volume upwards and closes green. Upwards movement within this session does not have support from volume. The short term volume profile remains bearish, so upwards movement may be limited here; this may offer a little support to the hourly triangle Elliott wave count.
Overall, it still looks like Gold is within a small consolidation after the downwards trend reaching very extreme. So far within the consolidation, it is an upwards day that has strongest volume, suggesting an upwards breakout may be more likely than downwards. This method works more often than it fails, but it does not always work. A good recent example of failure of this method was the prior consolidation from January 2018 to May 2018; there, the strongest days were upwards days but price broke out downwards.
GDX WEEKLY CHART
Click chart to enlarge. Chart courtesy of StockCharts.com.
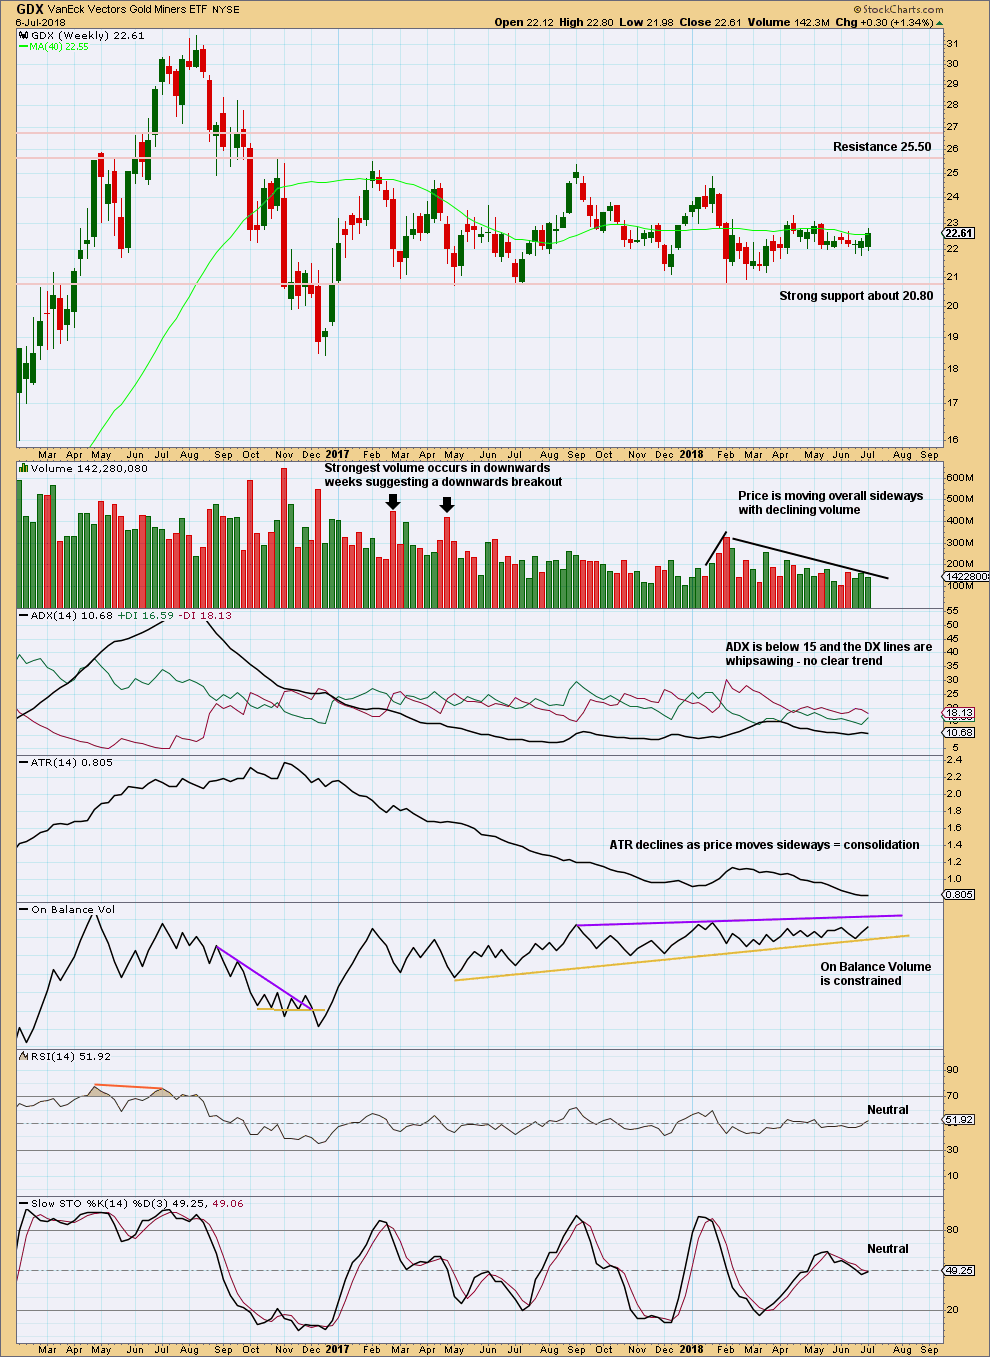
Support about 20.80 has been tested about eight times and so far has held. The more often a support area is tested and holds, the more technical significance it has.
In the first instance, expect this area to continue to provide support. Only a strong downwards day, closing below support and preferably with some increase in volume, would constitute a downwards breakout from the consolidation that GDX has been in for a year now.
Resistance is about 25.50. Only a strong upwards day, closing above resistance and with support from volume, would constitute an upwards breakout.
The last upwards week lacks support from volume.
GDX DAILY CHART
Click chart to enlarge. Chart courtesy of StockCharts.com.
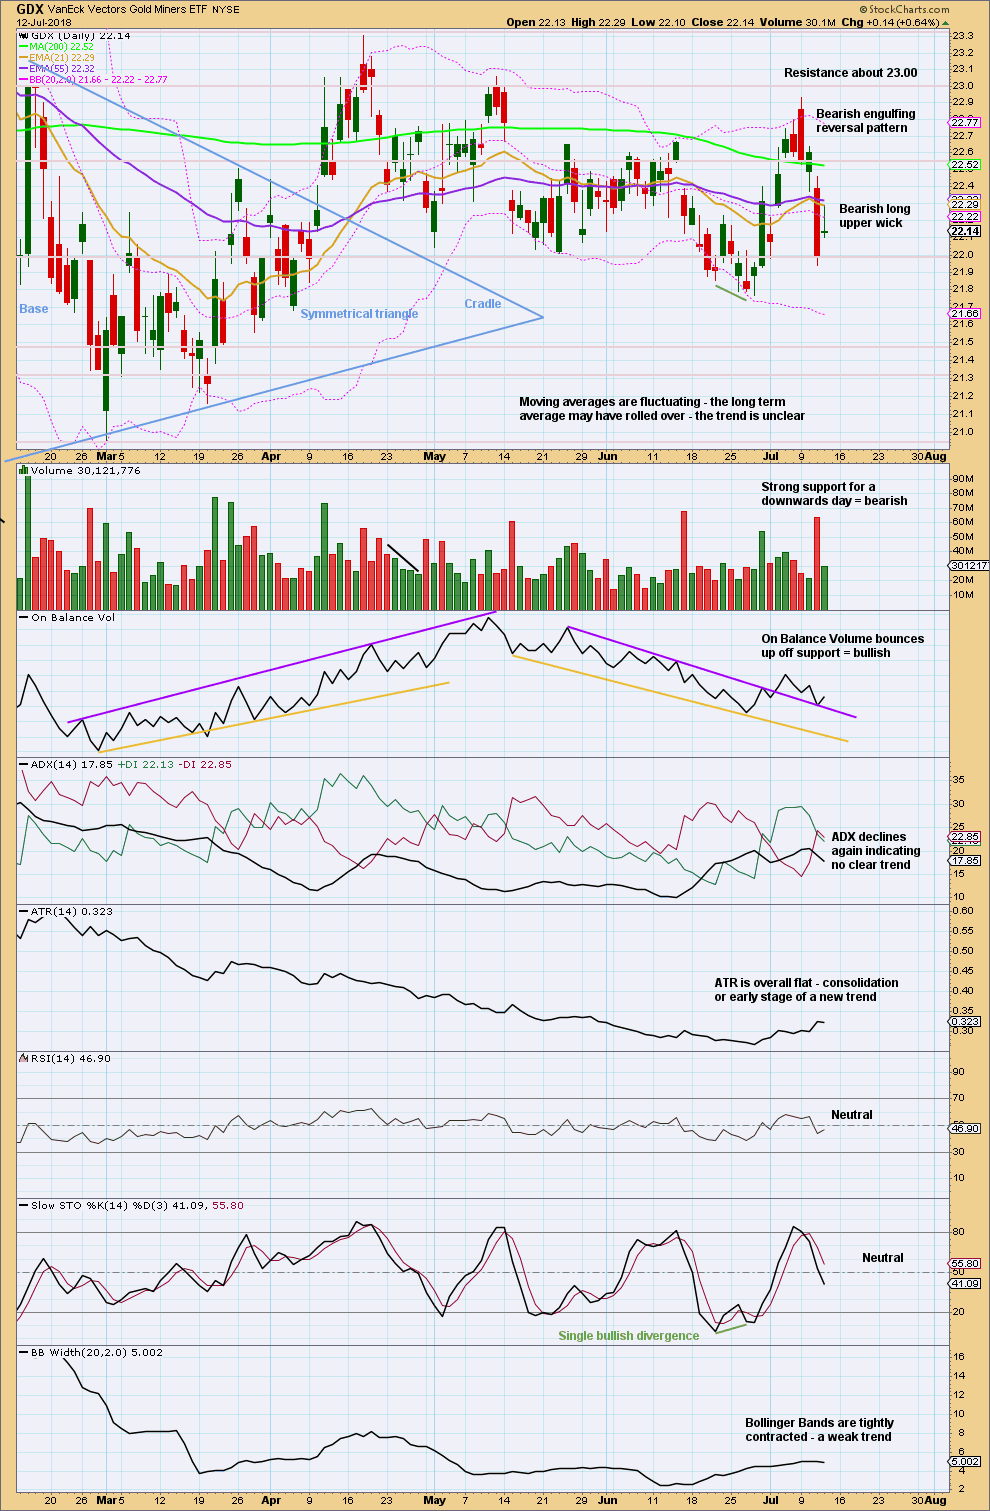
Price has bounced up off support about 22.00. The bounce is unconvincing though: it lacks support from volume and has a bearish long upper wick. It looks like support about 22.00 may again be tested. If price breaks below support there, then next area of support is about 21.50.
Published @ 09:12 p.m. EST.
A quick note to members: I have done some volunteer work today for Marunui Conservation. A 4.5 hr hike in steep muddy terrain, and I’m exhausted.
Your analysis will be published tomorrow, Sunday morning my time and Saturday evening EST.
Thanks all for your patience.
hourly chart updated:
this downwards wave fits best as a rare triple zigzag. so that’s how I’m going to label it.
minor 4 may now be any one of a flat, combination or triangle.
it could be an expanded flat, and I’ll chart and publish that on an hourly chart. we shall have three hourly charts to end the week.