
Downwards movement has continued. Price is now within the target zone.
Two short term hourly Elliott wave counts outline two possibilities for the next 24 hours.
Summary: While price remains below 1,247.37, then allow for new lows to the lower edge of the target zone at 1,211.
If price starts to move higher and makes a new high by any amount at any time frame above 1,247.37, then a low should be in place for the mid term, and a new wave up towards 1,310 should have begun.
This downwards trend is very extreme. There is bullish divergence between price and RSI and Stochastics (they are both oversold), and now there is a small green candlestick with a long lower wick. A low may now be in place.
Always trade with stops to protect your account. Risk only 1-5% of equity on any one trade.
New updates to this analysis are in bold.
Grand SuperCycle analysis is here.
Last historic analysis with monthly charts and several weekly alternates is here, video is here.
There are six weekly charts published in the last historic analysis. All but two expect more downwards movement at this time; the two bullish wave counts would be invalidated below 1,236.54. Because the remaining four bearish wave counts all expect the same movement next only one shall be published on a daily basis. Members should keep the other wave counts in mind. They will be published on a daily basis if they begin to diverge from the triangle wave count.
MAIN ELLIOTT WAVE COUNT
WEEKLY CHART – TRIANGLE
Click chart to enlarge.
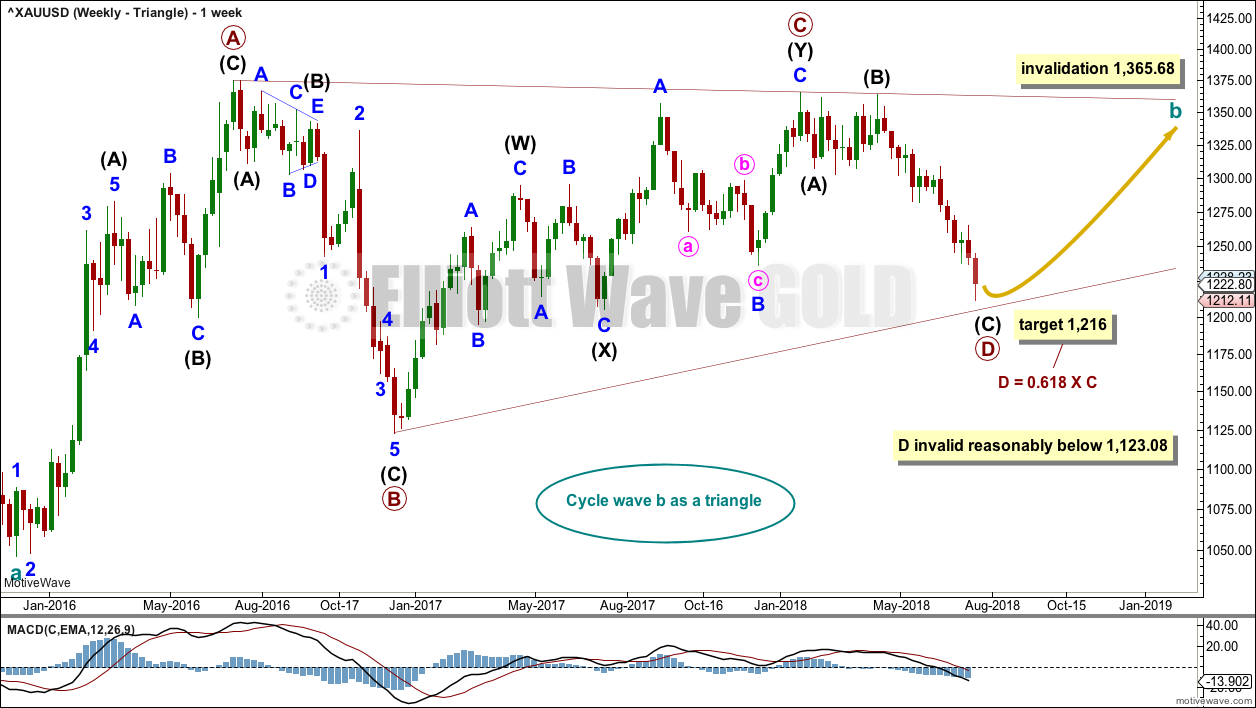
The triangle so far has the best fit and look. If price shows a combination or flat may be more likely, then those ideas may be published on a daily basis. The flat and combination ideas expect movement reasonably below 1,123.08, or perhaps a new low below 1,046.27.
Cycle wave b may be an incomplete triangle. The triangle may be a contracting or barrier triangle, with a contracting triangle looking much more likely because the A-C trend line does not have a strong slope. A contracting triangle could see the B-D trend line have a stronger slope, so that the triangle trend lines converge at a reasonable rate. A barrier triangle would have a B-D trend line that would be essentially flat, and the triangle trend lines would barely converge.
Within a contracting triangle, primary wave D may not move beyond the end of primary wave B below 1,123.08. Within a barrier triangle, primary wave D may end about the same level as primary wave B at 1,123.08, so that the B-D trend line is essentially flat. Only a new low reasonably below 1,123.08 would invalidate the triangle.
Within both a contracting and barrier triangle, primary wave E may not move beyond the end of primary wave C above 1,365.68.
Four of the five sub-waves of a triangle must be zigzags, with only one sub-wave allowed to be a multiple zigzag. Primary wave C is the most common sub-wave to subdivide as a multiple, and this is how primary wave C for this example fits best.
Primary wave D must be a single structure, most likely a zigzag. It is again possible that primary wave D could be over today. If it is not over, then it may be over very soon at the lower edge of the target zone.
One triangle sub-wave tends to be close to 0.618 the length of its predecessor; this gives a target for primary wave D.
There are no problems in terms of subdivisions or rare structures for this wave count. It has an excellent fit and so far a typical look.
DAILY CHART – TRIANGLE
Click chart to enlarge.
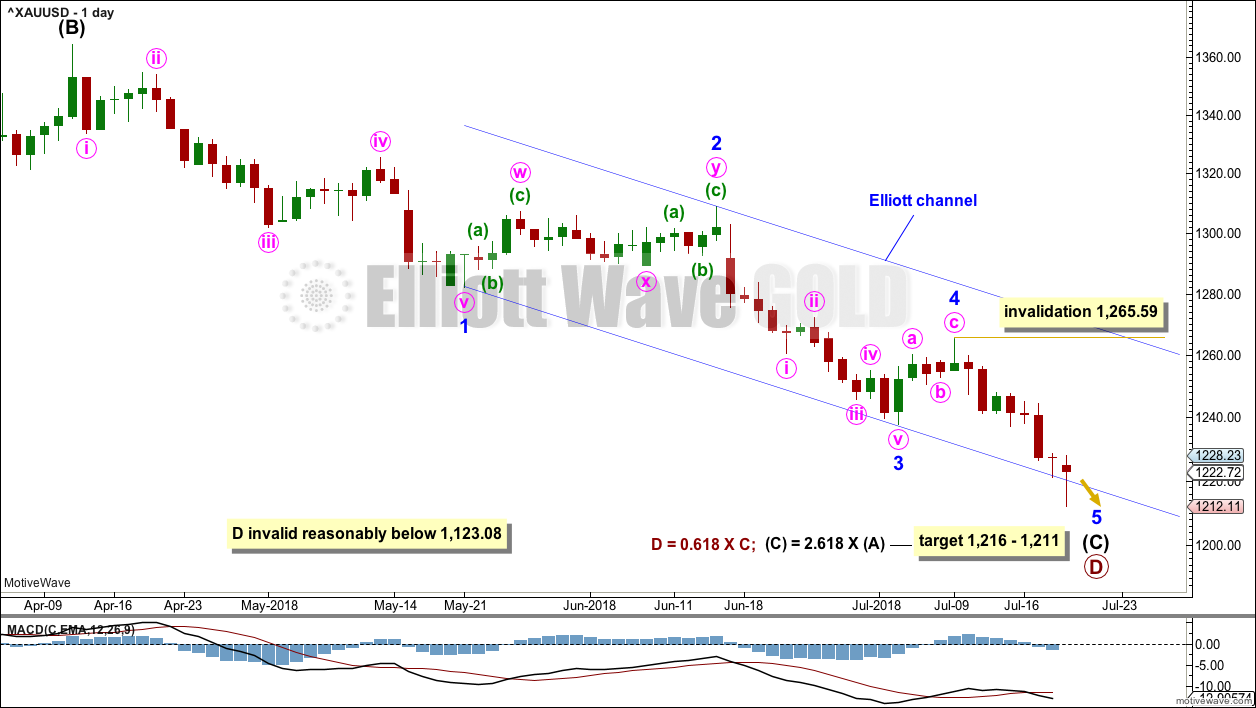
Primary wave D may be unfolding lower as a single zigzag, and within it intermediate waves (A) and (B) may be complete.
The target is widened to a $5 zone calculated at two degrees. This should have a reasonable probability.
Within intermediate wave (C), it looks likely that all of minor waves 1, 2, 3 and 4 may now be over.
It is again possible now that minor wave 5 could be over at today’s low, with an overshoot of the lower edge of the blue Elliott channel. The second hourly wave count again looks at this possibility.
If primary wave D continues lower, it may end tomorrow or within a very few days. This downwards trend is now very extreme and stretched. The target remains the same. The lower edge may now be favoured, and it may not be quite low enough.
Look out for a primary degree trend change here or very soon.
Let price tell us when a low is in place. For this reason, the two hourly charts below are simply labelled first and second. The price point at 1,247.37 differentiates them.
FIRST HOURLY CHART
Click chart to enlarge.
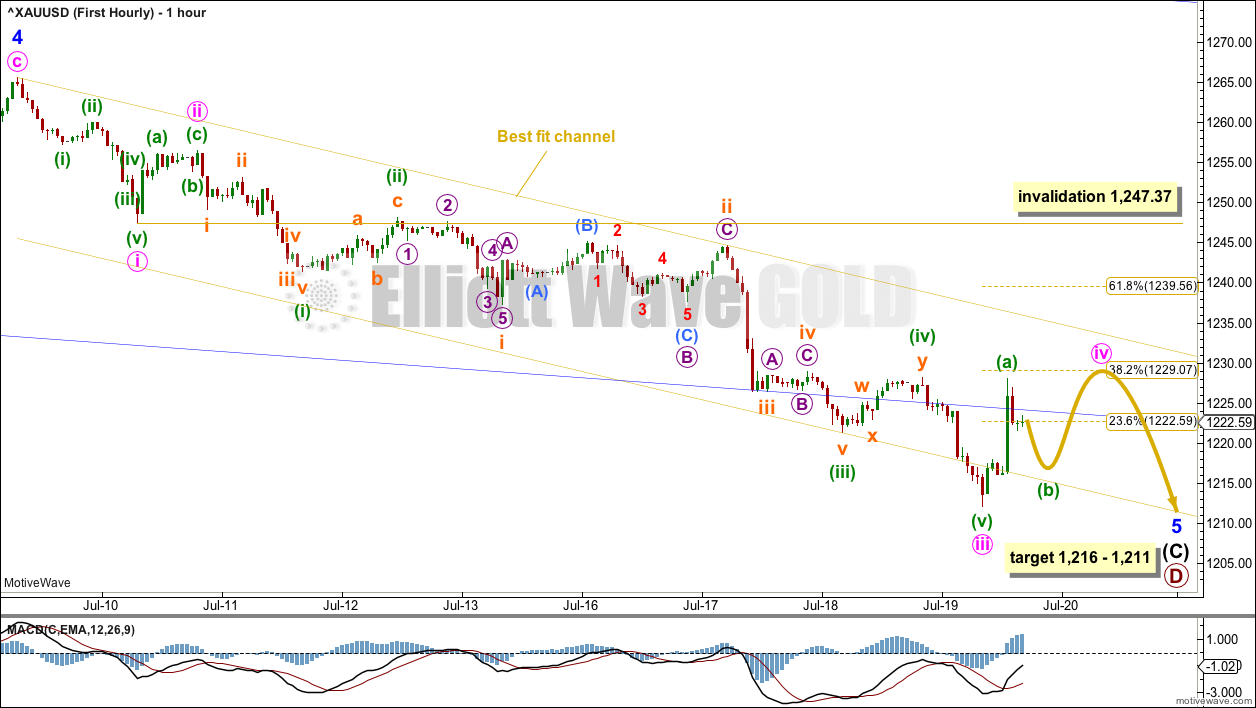
There is more than one way to see downwards movement of minor wave 5. This first hourly chart allows for more downwards movement to complete the impulse.
Within minor wave 5, minute waves i, ii and now iii may be complete. Minute wave iv may not move back up into minute wave i price territory above 1,247.37.
Minute wave ii was a relatively deep 0.50 single zigzag. Minute wave iv may be a flat, combination or triangle to exhibit alternation with minute wave ii. It may last more than one day; sideways types of corrections tend to be longer lasting than zigzags. If it is long lasting enough, then it may find resistance about the upper edge of the best fit channel.
When a small consolidation for minute wave iv is complete, then one final new low may complete the whole structure for primary wave D.
Minor wave 5 has overshot the lower edge of the blue Elliott channel; fifth waves for commodities are sometimes swift and strong.
SECOND HOURLY CHART
Click chart to enlarge.
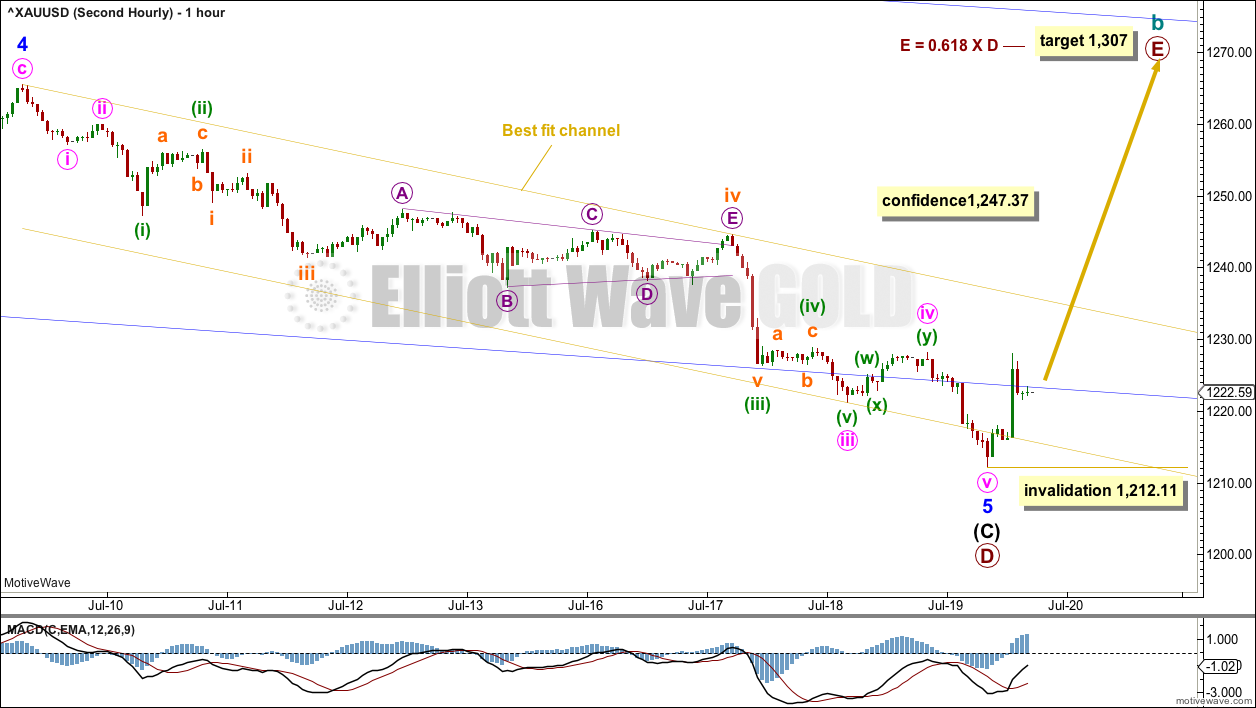
It is also again possible to see minor wave 5 as a complete impulse, ending almost right at the lower edge of the blue Elliott channel.
If minor wave 5 is over, then within the new upwards wave to start primary wave E no second wave correction may move beyond the start of its first wave below 1,212.11.
A new high above 1,247.37 would invalidate the first hourly wave count and provide strong confidence in this second wave count.
TECHNICAL ANALYSIS
WEEKLY CHART
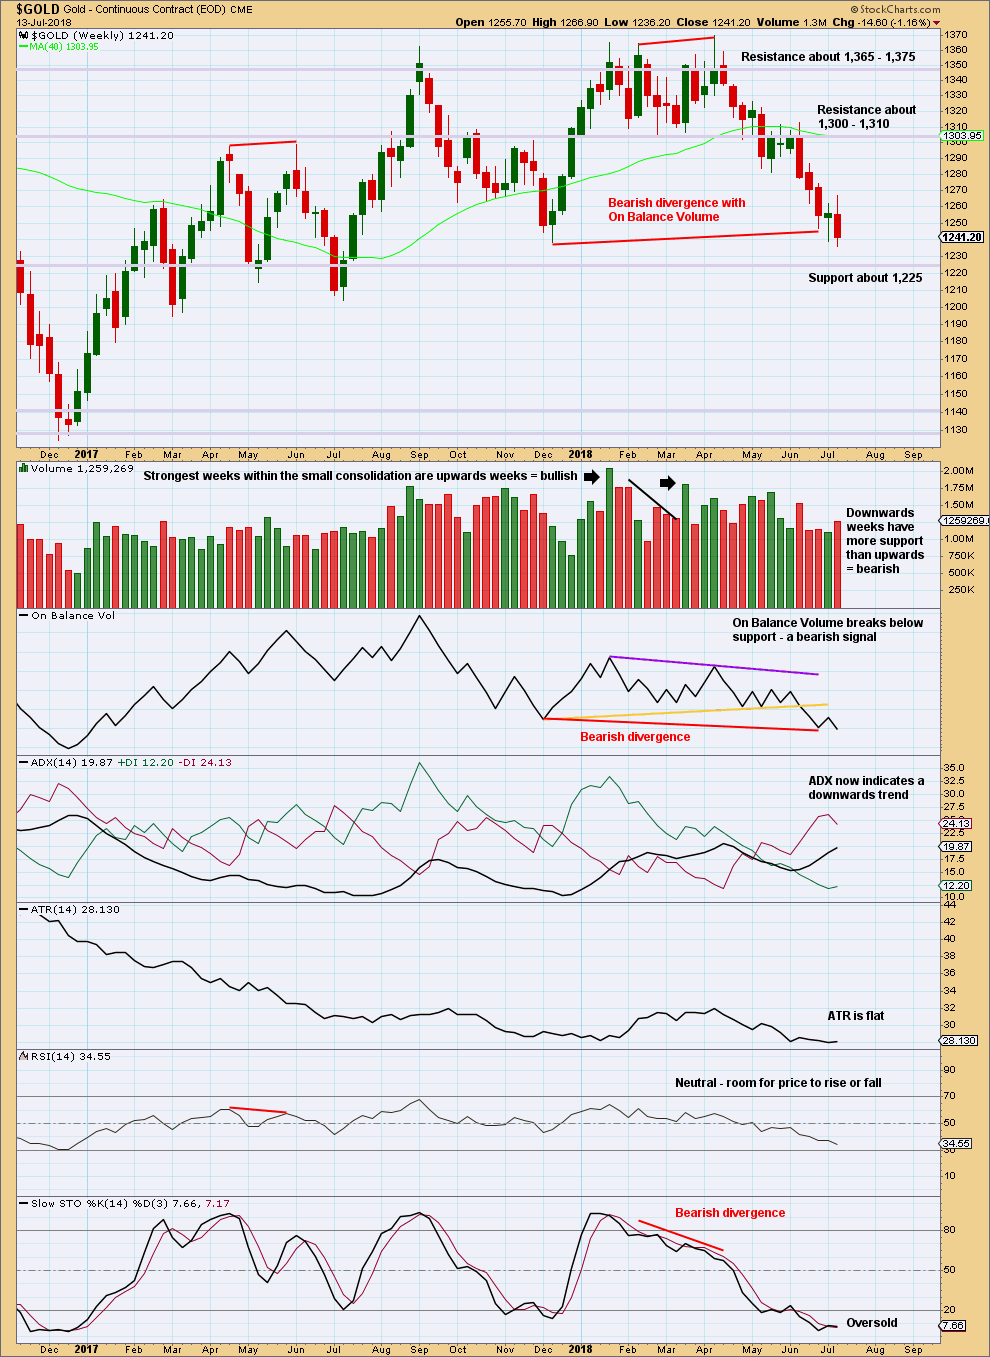
Click chart to enlarge. Chart courtesy of StockCharts.com.
A downwards week last week has support from volume.
There is single but weak bullish divergence between price and Stochastics.
DAILY CHART
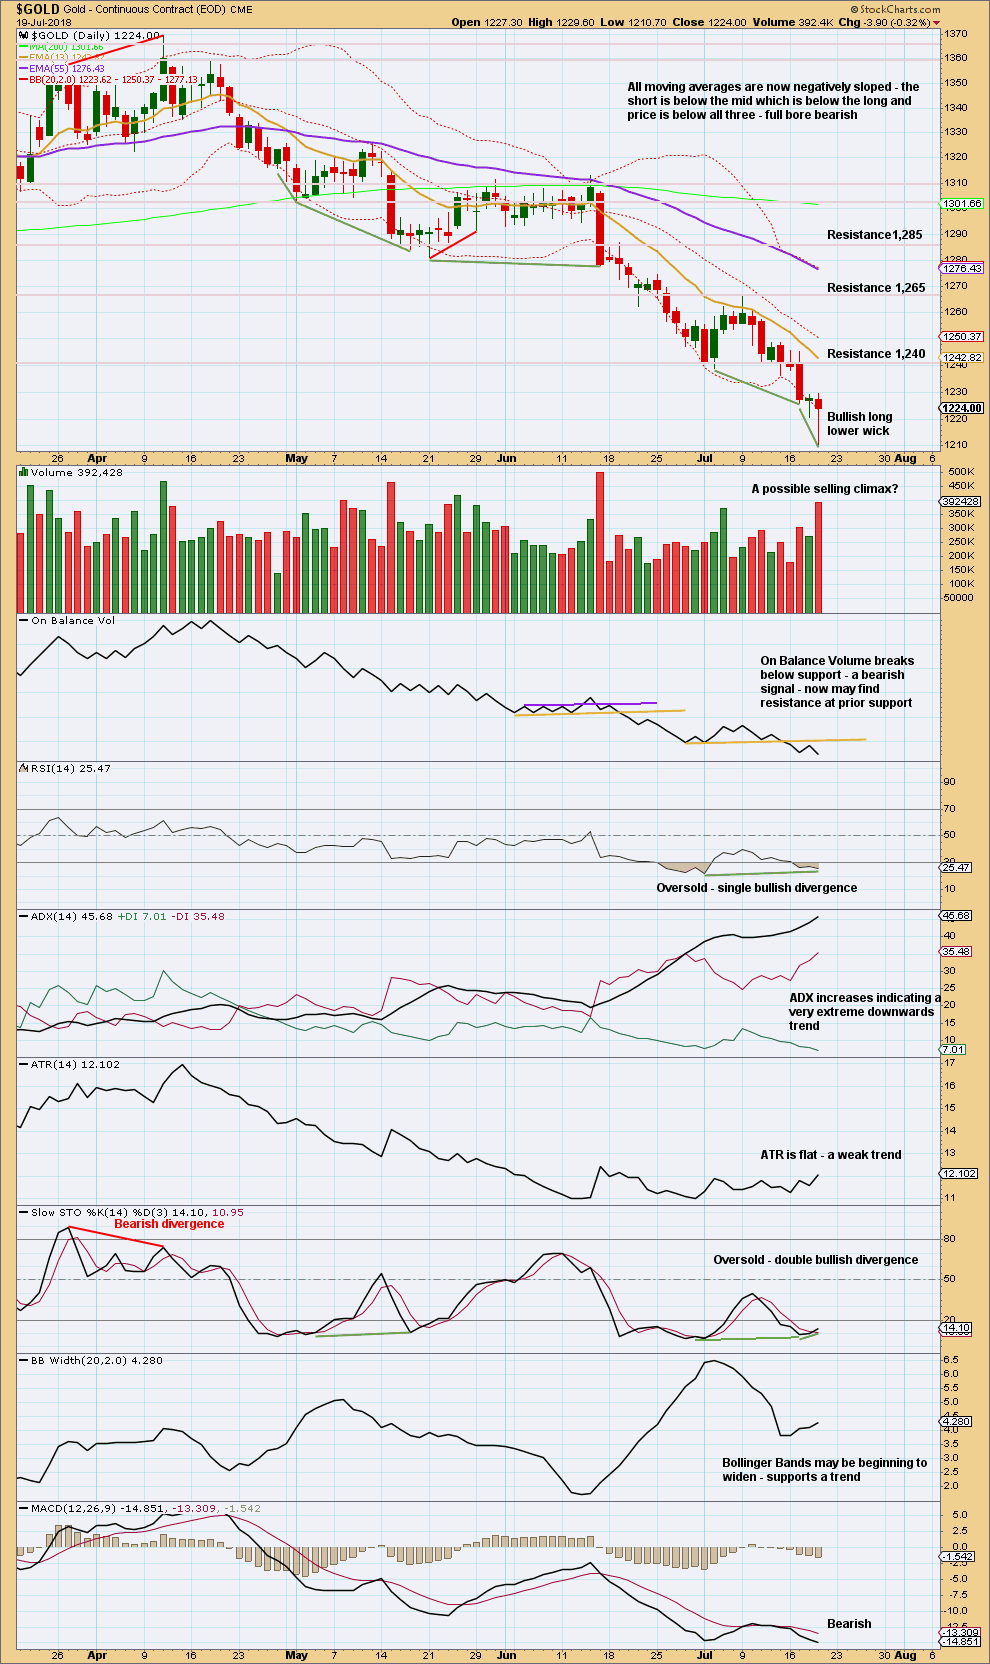
Click chart to enlarge. Chart courtesy of StockCharts.com.
The long lower wick on today’s candlestick is very bullish indeed. A low may be in place here or very soon.
Double bullish divergence now between price and Stochastics is more bullish than yesterday.
GDX WEEKLY CHART
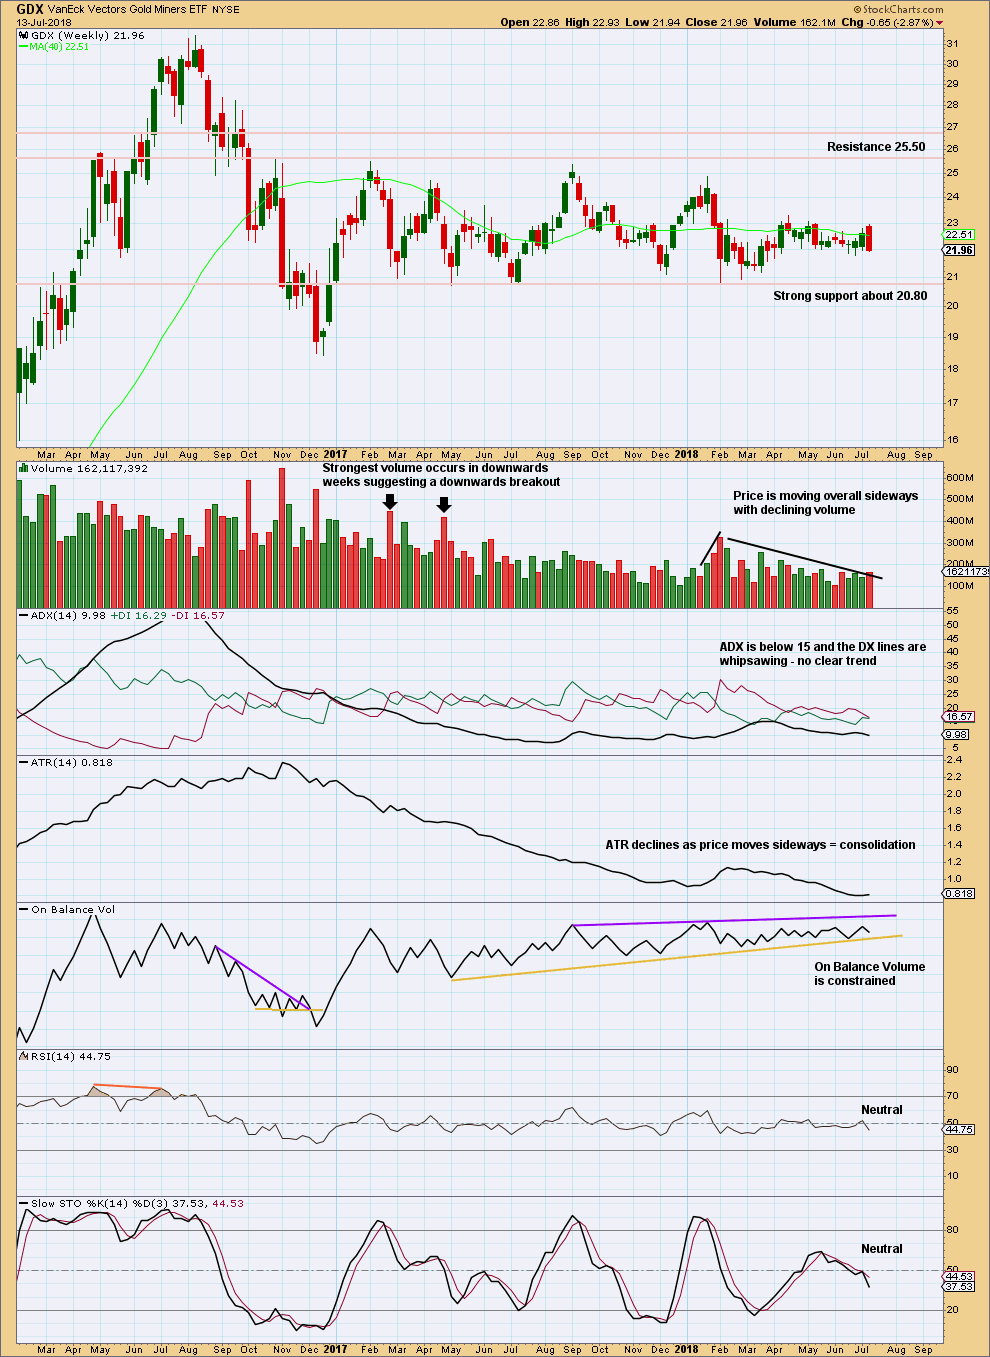
Click chart to enlarge. Chart courtesy of StockCharts.com.
Support about 20.80 has been tested about eight times and so far has held. The more often a support area is tested and holds, the more technical significance it has.
In the first instance, expect this area to continue to provide support. Only a strong downwards day, closing below support and preferably with some increase in volume, would constitute a downwards breakout from the consolidation that GDX has been in for a year now.
Resistance is about 25.50. Only a strong upwards day, closing above resistance and with support from volume, would constitute an upwards breakout.
There is some support this week for downwards movement from volume.
This weekly candlestick should not be read as a bearish engulfing pattern. For a candlestick reversal pattern to be read as such, there has to be something to reverse. Here, price is moving sideways and not trending.
GDX DAILY CHART
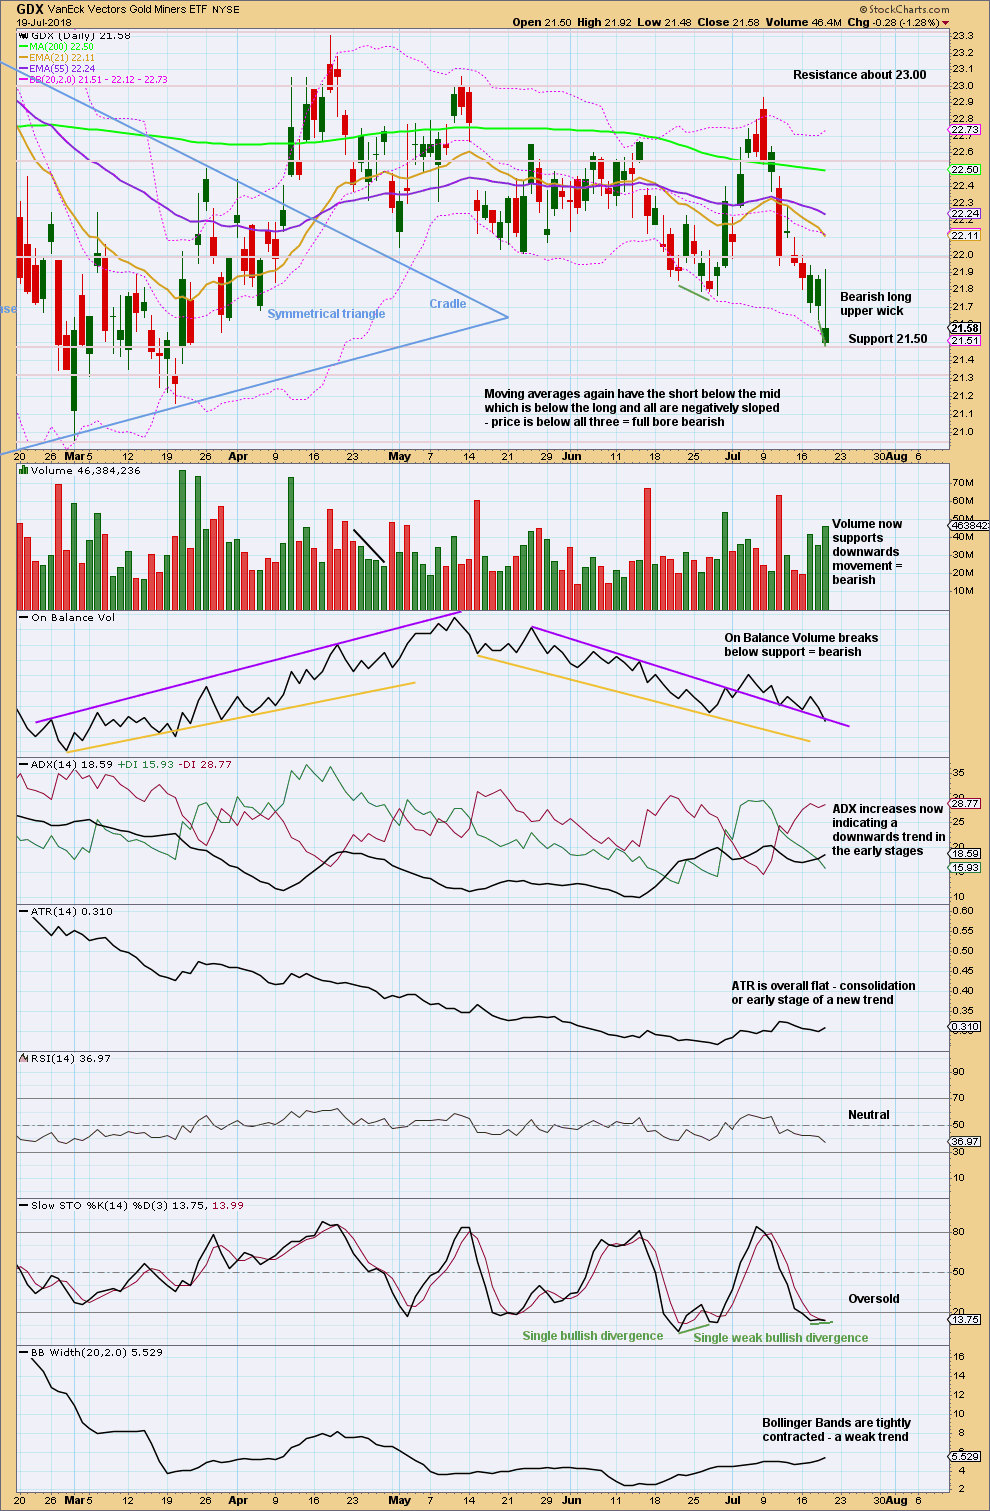
Click chart to enlarge. Chart courtesy of StockCharts.com.
GDX today looks more bearish than Gold for the very short term. If support here at 21.50 gives way, then next support is close by at 21.30.
Published @ 06:13 p.m. EST.
Here is the first hourly chart updated:
price remains within the channel, this could certainly be minute iv.
Hourly chart updated:
The second hourly may be the one, but the first remains valid too. Here is the second hourly for you.
Lara: Do I understand correctly from today’s analysis cycle wave b target is 1307 for main wave count? From there onward cycle wave c will begin in down trend for many months /years.
Yes, that is correct.
Primary E upwards to about 1,307 may be a typical back test of resistance which was prior support.
A target in the area about 1,305 – 1,310 for primary E looks most likely.