
Upwards or sideways movement was again expected for both Gold and GDX. A small doji candlestick that moved price slightly higher on both fits this expectation.
Summary: It is again possible for Gold that a low may be in place, but this needs some confirmation with a new high above 1,216.30. While price remains below 1,216.30, it is possible that the last four sessions are a small bounce within an ongoing downwards trend. A lack of support from volume for this bounce supports this view. If price keeps falling for Gold, expect it to reach below 1,147.
For GDX, a highly significant break below support occurred two weeks ago. The long term target is at 16.02. Look for resistance for this bounce, which looks very weak, at 19.74 in the first instance.
Always trade with stops to protect your account. Risk only 1-5% of equity on any one trade.
New updates to this analysis are in bold.
Grand SuperCycle analysis is here.
Last historic analysis with monthly charts and several weekly alternates is here, video is here.
Weekly charts will all again be reviewed at the end of this week.
MAIN ELLIOTT WAVE COUNT
WEEKLY CHART – TRIANGLE
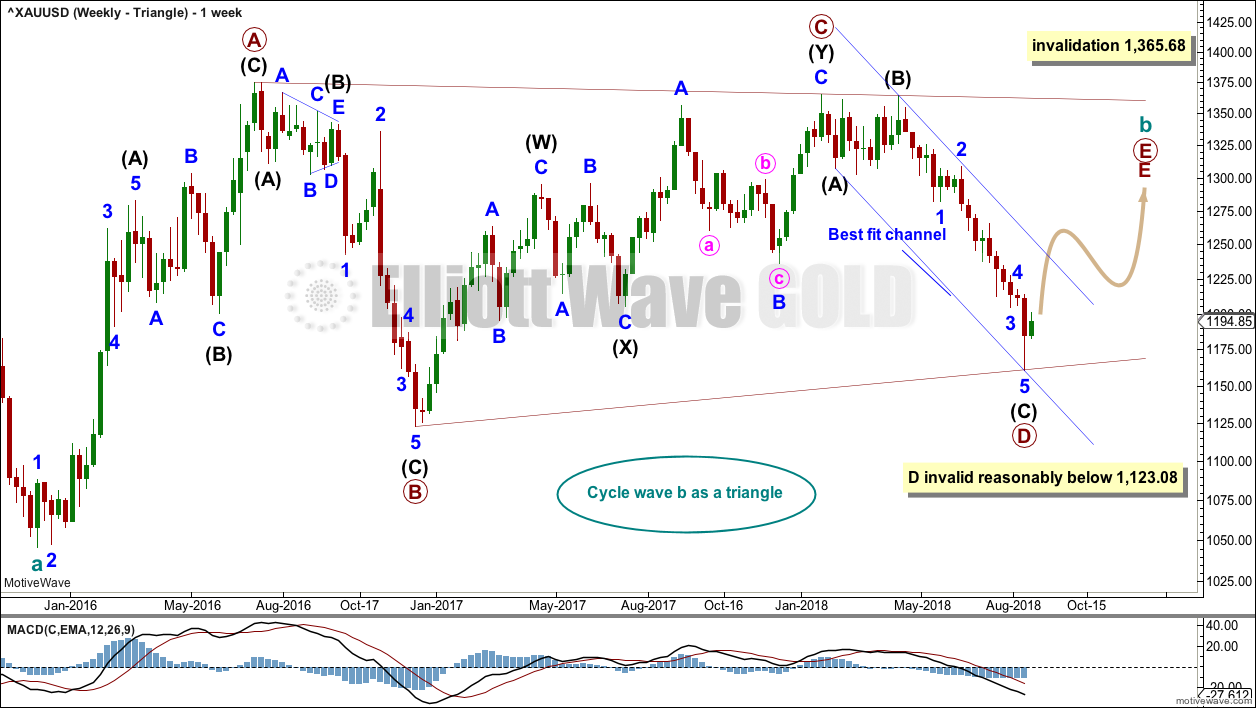
Click chart to enlarge.
There are four remaining weekly wave counts at this time for cycle wave b: a triangle, flat, combination or double zigzag.
At this stage, the direction for the triangle, flat and double zigzag does not diverge, but the combination wave count does diverge, so it will be published below daily.
The triangle so far has the best fit and look.
Cycle wave b may be an incomplete triangle. The triangle may be a contracting or barrier triangle, with a contracting triangle looking much more likely because the A-C trend line does not have a strong slope. A contracting triangle could see the B-D trend line have a stronger slope, so that the triangle trend lines converge at a reasonable rate. A barrier triangle would have a B-D trend line that would be essentially flat, and the triangle trend lines would barely converge.
Within a contracting triangle, primary wave D may not move beyond the end of primary wave B below 1,123.08. Within a barrier triangle, primary wave D may end about the same level as primary wave B at 1,123.08, so that the B-D trend line is essentially flat. Only a new low reasonably below 1,123.08 would invalidate the triangle.
Within both a contracting and barrier triangle, primary wave E may not move beyond the end of primary wave C above 1,365.68.
Four of the five sub-waves of a triangle must be zigzags, with only one sub-wave allowed to be a multiple zigzag. Primary wave C is the most common sub-wave to subdivide as a multiple, and this is how primary wave C for this example fits best.
Primary wave D must be a single structure, most likely a zigzag.
There are no problems in terms of subdivisions or rare structures for this wave count. It has an excellent fit and so far a typical look.
A new channel is drawn on all charts about the downwards wave of primary wave D. Here, it is labelled a best fit channel. If this channel is breached by upwards movement, that may provide reasonable confidence in this weekly triangle wave count and put serious doubt on the other three weekly wave counts.
This wave count now expects a consolidation for primary wave E to back test resistance at prior support, and then a significant new downwards wave for cycle wave C. For the long term, this is the most bearish wave count.
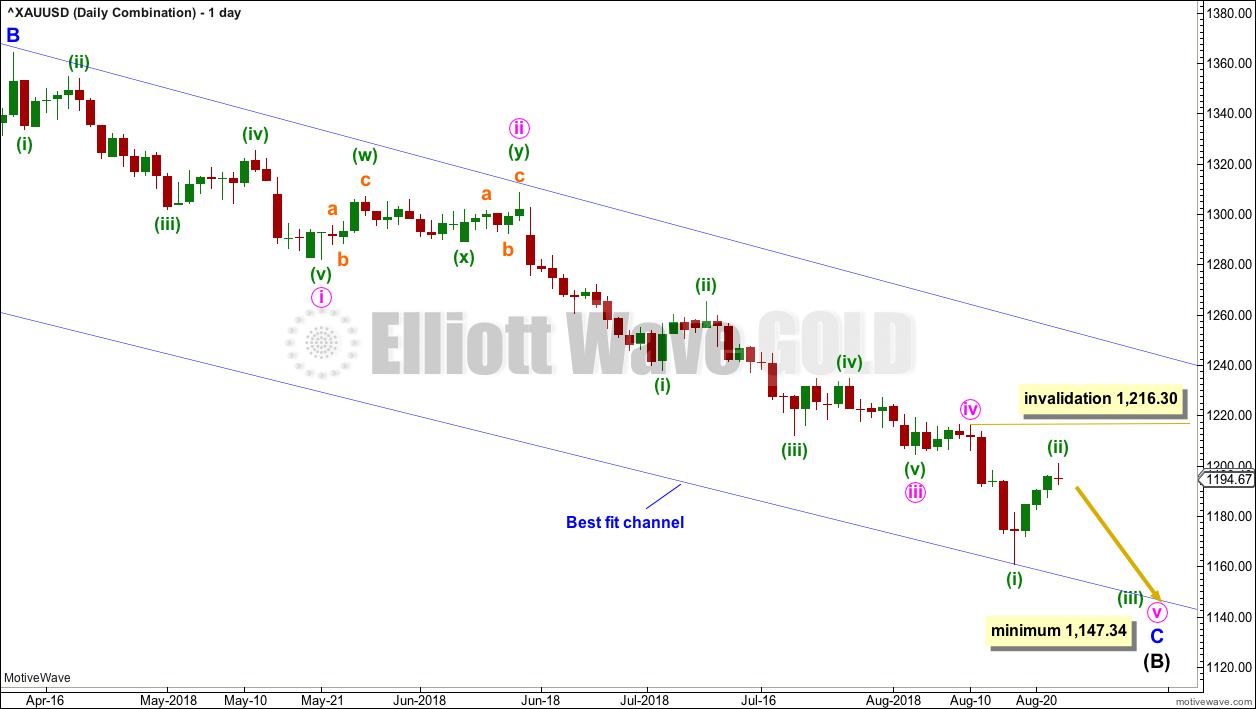
DAILY CHART – TRIANGLE
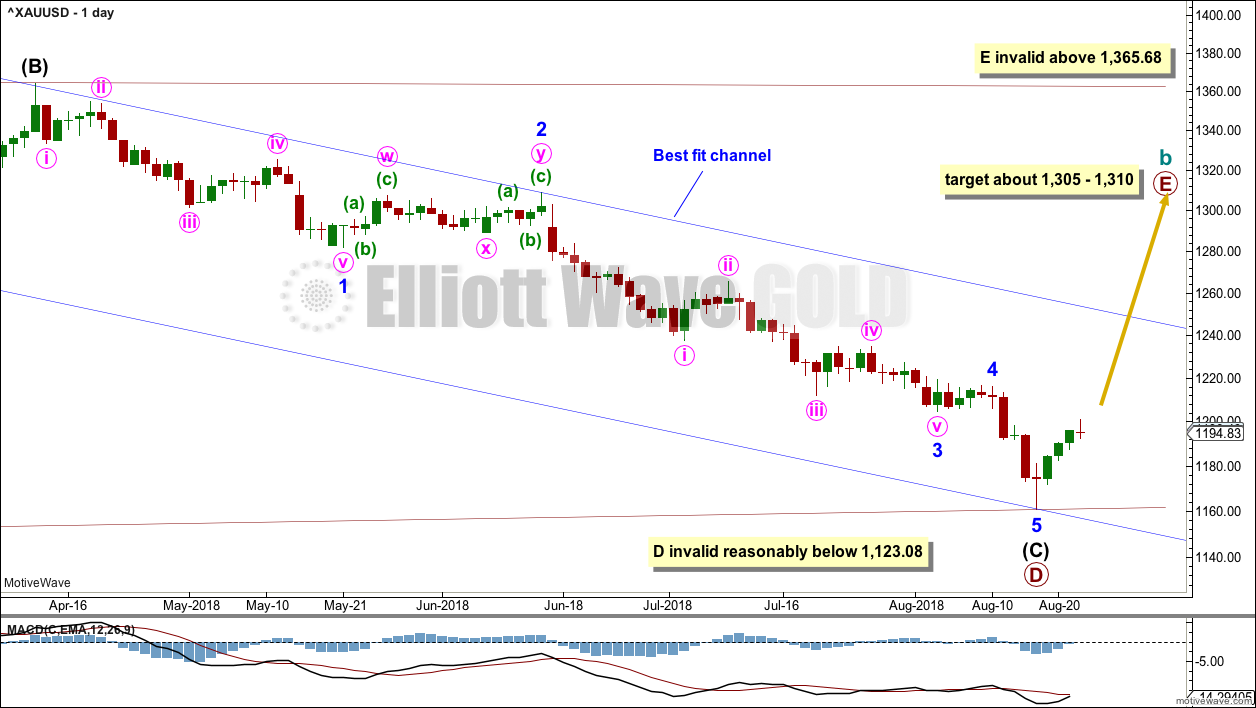
Click chart to enlarge.
Primary wave D may again be complete. For Barchart data, there is a Morning Doji Star candlestick reversal pattern at the low.
A new high above 1,216.30 would be required for reasonable confidence that a low is in place. This price point is the start of minor wave 5. A new high above the start of minor wave 5 may not be a second wave correction within minor wave 5, so at that stage minor wave 5 should be over.
While price remains below 1,216.30, it will remain possible that primary wave D could continue lower. However, primary wave D for this triangle wave count should end here or very soon, so that the B-D trend line has a reasonable slope ensuring the triangle trend lines converge at a reasonable rate. If primary wave D were to continue much lower, the B-D trend line would have too shallow a slope for a normal looking Elliott wave triangle.
A target for primary wave E is the strong zone of resistance about 1,305 to 1,310. Primary wave E must subdivide as a zigzag, and it should last at least a Fibonacci 13 weeks. Primary wave E may not move beyond the end of primary wave C above 1,365.68.
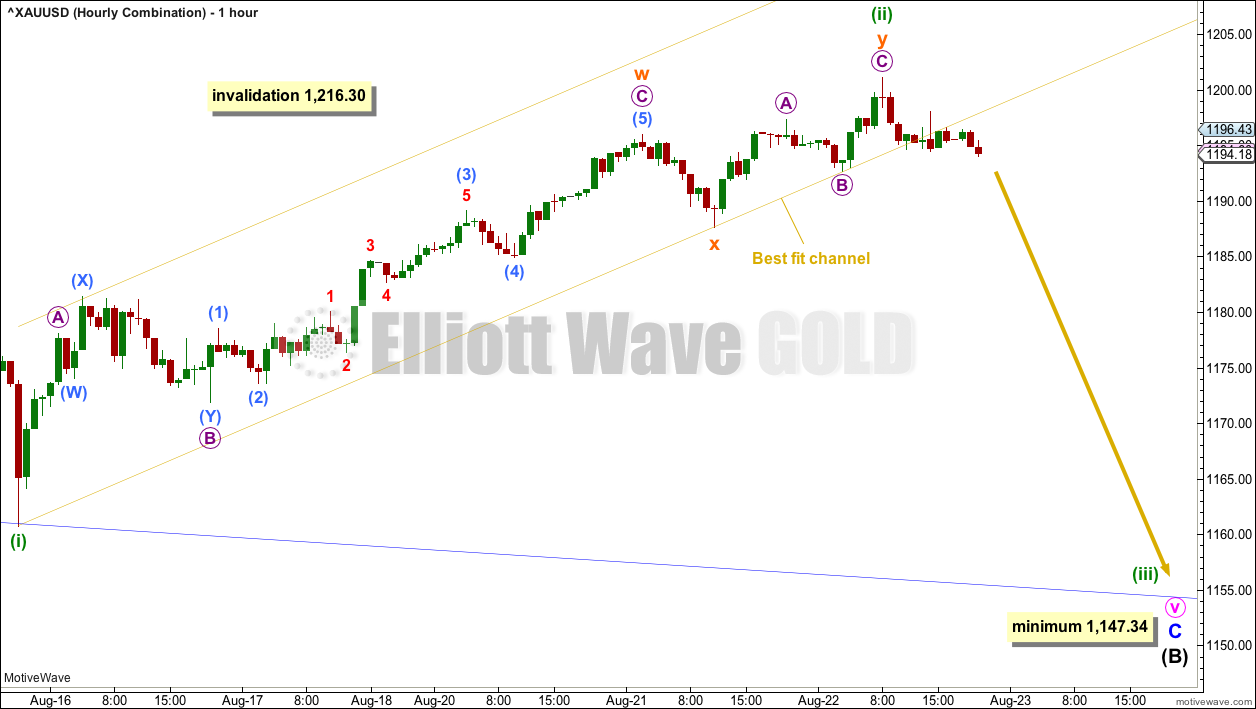
HOURLY CHART
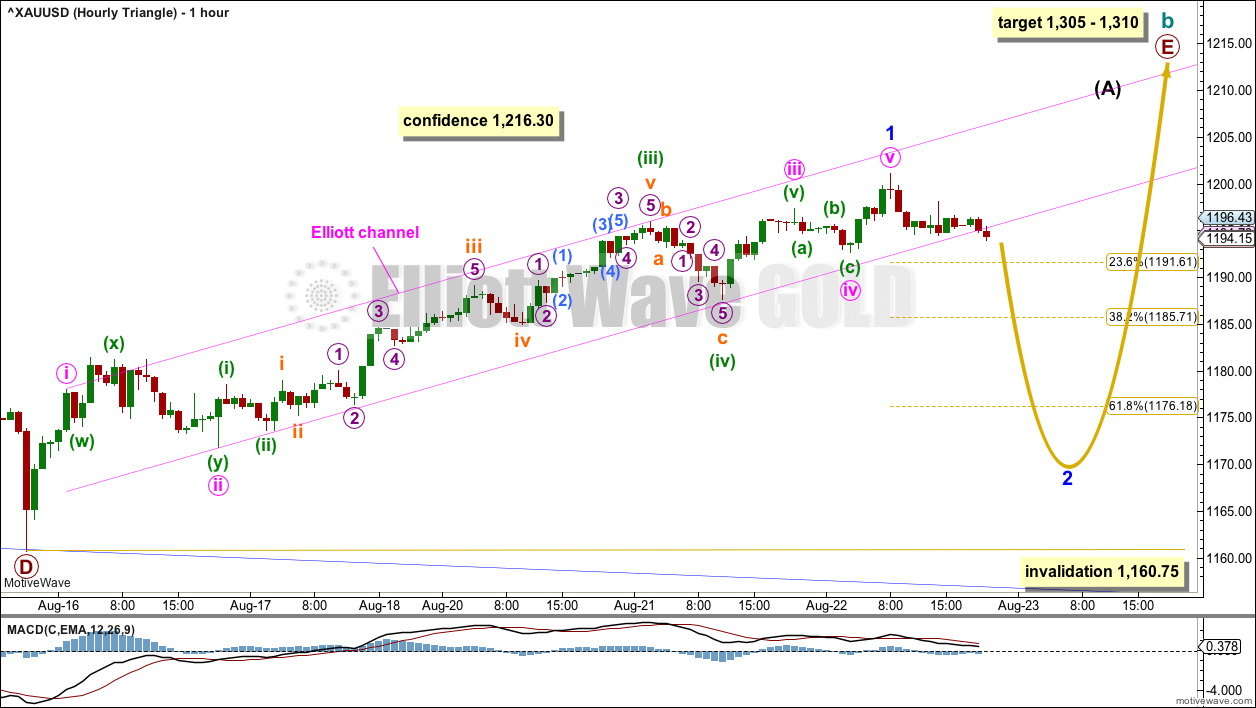
Click chart to enlarge.
Minor wave 5 may now be a complete impulse. This hourly wave still requires a new high above 1,216.30 for reasonable confidence.
If there has been a trend change at primary degree, then a five up should develop at the hourly and daily chart levels.
Minor wave 1 may now be complete at today’s high. It looks like price is now breaking below the lower edge of the pink Elliott channel, which may be an indication that minor wave 1 is over and minor wave 2 has begun.
Minor wave 2 may not move beyond the start of minor wave 1 below 1,160.75.
The first second wave correction of a new trend for Gold is often extremely deep. Minor wave 2 may correct to about 0.8 to 0.9 of minor wave 1.
WEEKLY CHART – COMBINATION
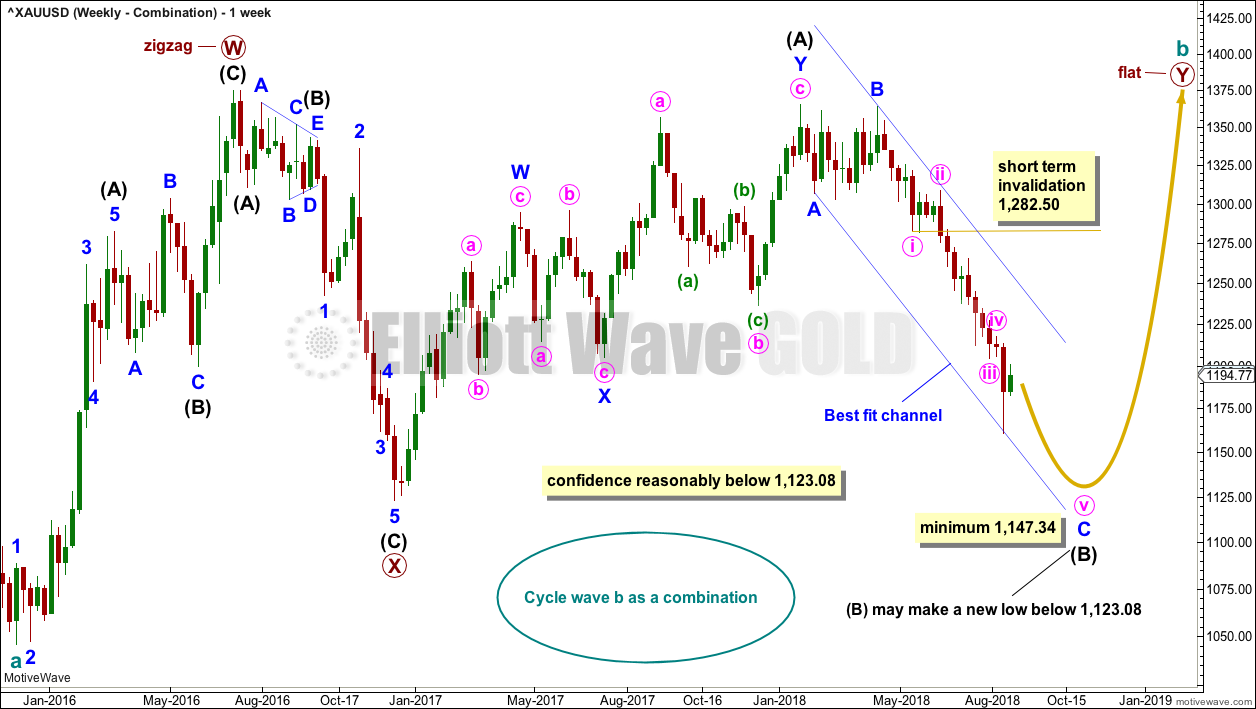
Click chart to enlarge.
It is essential when a triangle is considered to always consider alternates. Too many times over the years I have labelled a triangle as unfolding or even complete, only for it to be invalidated and the structure turning out to be something else.
When a triangle is invalidated, then the most common structure the correction turns out to be is a combination.
If cycle wave b is a combination, then the first structure in a double may be a complete zigzag labelled primary wave W.
The double may be joined by a three in the opposite direction, a zigzag labelled primary wave X.
The second structure in the double may be a flat correction labelled primary wave Y. My research on Gold so far has found that the most common two structures in a double combination are one zigzag and one flat correction. I have found only one instance where a triangle unfolded for wave Y. The most likely structure for wave Y would be a flat correction by a very wide margin, so that is what this wave count shall expect.
Within a flat correction for primary wave Y, the current downwards wave of intermediate wave (B) may be a single or multiple zigzag; for now it shall be labelled as a single. Intermediate wave (B) must retrace a minimum 0.9 length of intermediate wave (A) at 1,147.34. Intermediate wave (B) may move beyond the start of intermediate wave (A) as in an expanded flat.
Because the minimum requirement for intermediate wave (B) is not yet met, this wave count requires that minute wave v of minor wave C of intermediate wave (B) continues lower. This is the most immediately bearish of all four weekly wave counts.
When intermediate wave (B) is complete, then intermediate wave (C) would be expected to make at least a slight new high above the end of intermediate wave (A) at 1,365.68 to avoid a truncation. Primary wave Y would be most likely to end about the same level as primary wave W at 1,374.91, so that the whole structure takes up time and moves price sideways, as that is the purpose of double combinations.
While double combinations are very common, triples are extremely rare. I have found no examples of triple combinations for Gold at daily chart time frames or higher back to 1976. When the second structure in a double is complete, then it is extremely likely (almost certain) that the whole correction is over.
DAILY CHART – COMBINATION
Click chart to enlarge.
It is time to follow this wave count at both daily and hourly time frames as it now diverges from the other wave counts.
Minor wave C of intermediate wave (B) may be an incomplete five wave impulse. Within the impulse, minute waves i, ii, iii and iv may all be complete and minute wave v may now be unfolding.
Within minute wave v, the current small bounce may be minuette wave (ii), which may not move beyond the start of minuette wave (i) above 1,216.30.
HOURLY CHART
Click chart to enlarge.
Minuette wave (ii) may be a complete double zigzag.
The best fit channel is slightly adjusted, and it is now breached by downwards movement.
This wave count may now expect an increase in downwards momentum as a low degree third wave unfolds for minuette wave (iii).
TECHNICAL ANALYSIS
WEEKLY CHART
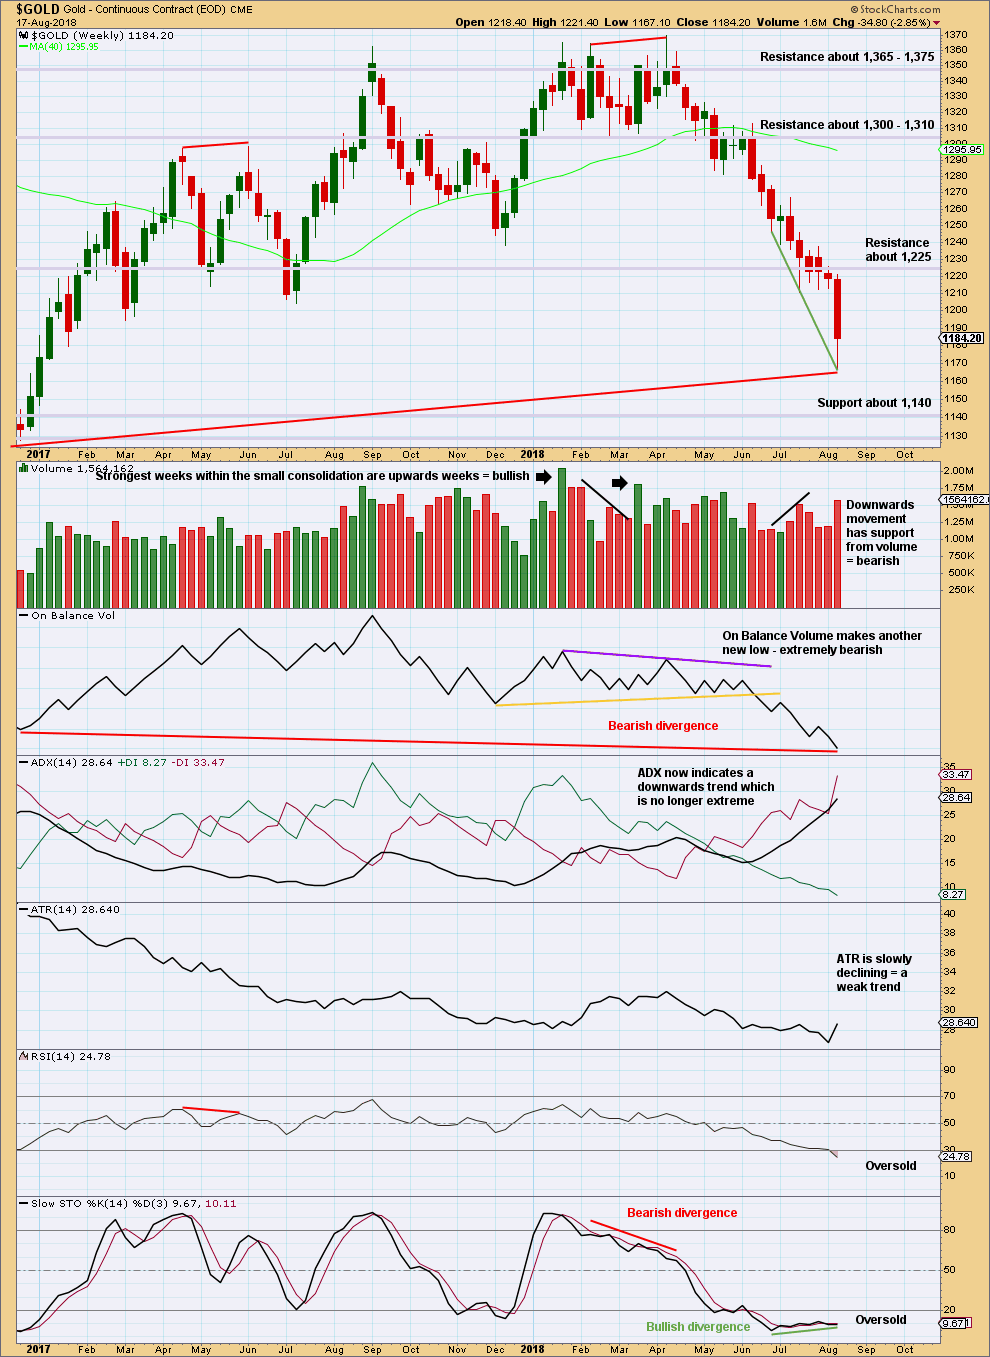
Click chart to enlarge. Chart courtesy of StockCharts.com.
On Balance Volume is lower than its prior point at the end of November 2015. This divergence is extremely bearish but does not rule out a consolidation unfolding here; the divergence does strongly support the Triangle wave count, which expects a consolidation or bounce up to test resistance now and then a continuation of a major bear market.
The long lower wick on this weekly candlestick is bullish, but that does not mean price can’t move a little lower next week. There is no bullish candlestick reversal pattern on the weekly chart at this time.
When Gold has a strong trend, ADX may remain very extreme for long periods of time and RSI can move more deeply into oversold. However, most recent lows since November 2015 were all found when RSI just reached oversold, so some caution here in looking out for a possible consolidation or trend change would be reasonable.
If price does continue lower, then look for next support about 1,140.
DAILY CHART
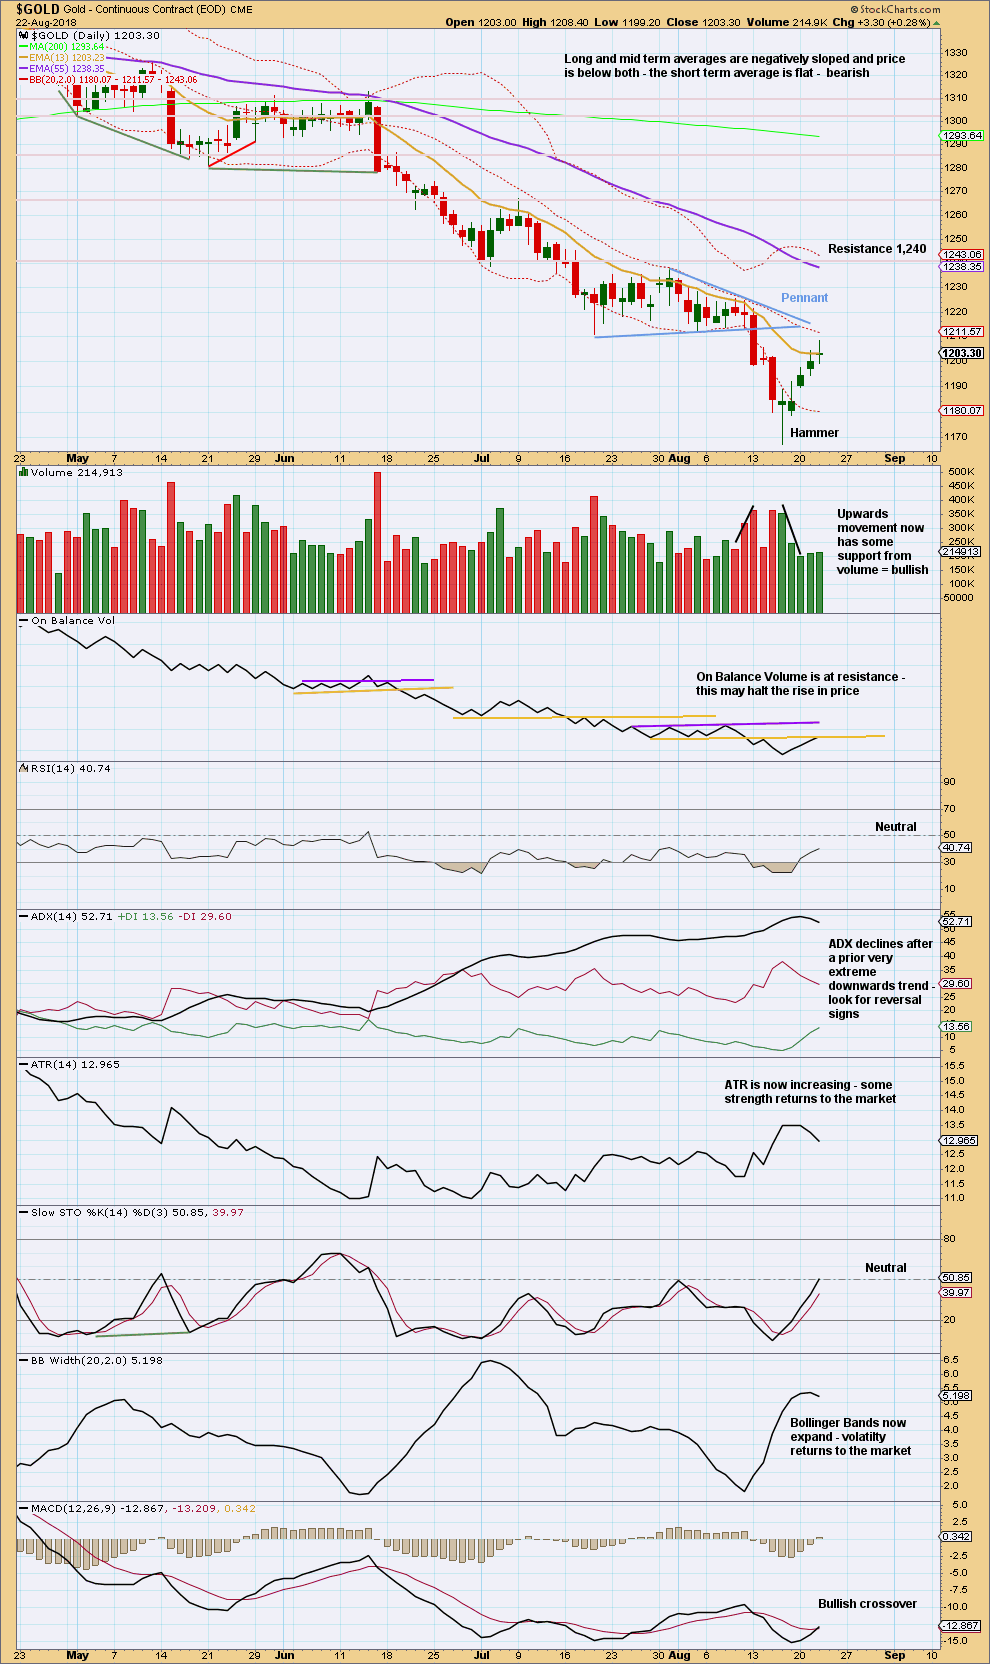
Click chart to enlarge. Chart courtesy of StockCharts.com.
A downwards breakout below the Pennant pattern has support from volume. The target using the length of the flagpole which precedes the Pennant is 1,157. This target has not yet been met, and it may not be as price may have fallen $10 short of it.
Support below is now about 1,140.
When a trend is very extreme, it is time to look out for candlestick reversal patterns and a possible trend reversal to the opposite direction, or a reasonable sideways move to relieve extreme conditions. Here, there is a Hammer reversal pattern at the low (it is almost a Dragonfly doji, but there is a little too great an upper shadow for that pattern). This is a warning that a low may now be in place.
There is very little support for upwards movement. Volume remains light overall, and the real bodies of the last four candlesticks are small with the last a doji. This upwards movement as a possible new trend looks unconvincing at this time. This may be a small consolidation within an ongoing downwards trend, and it is for this reason that the Combination Elliott wave count is published with daily and hourly charts now.
On Balance Volume here may provide resistance and halt the rise in price.
GDX WEEKLY CHART
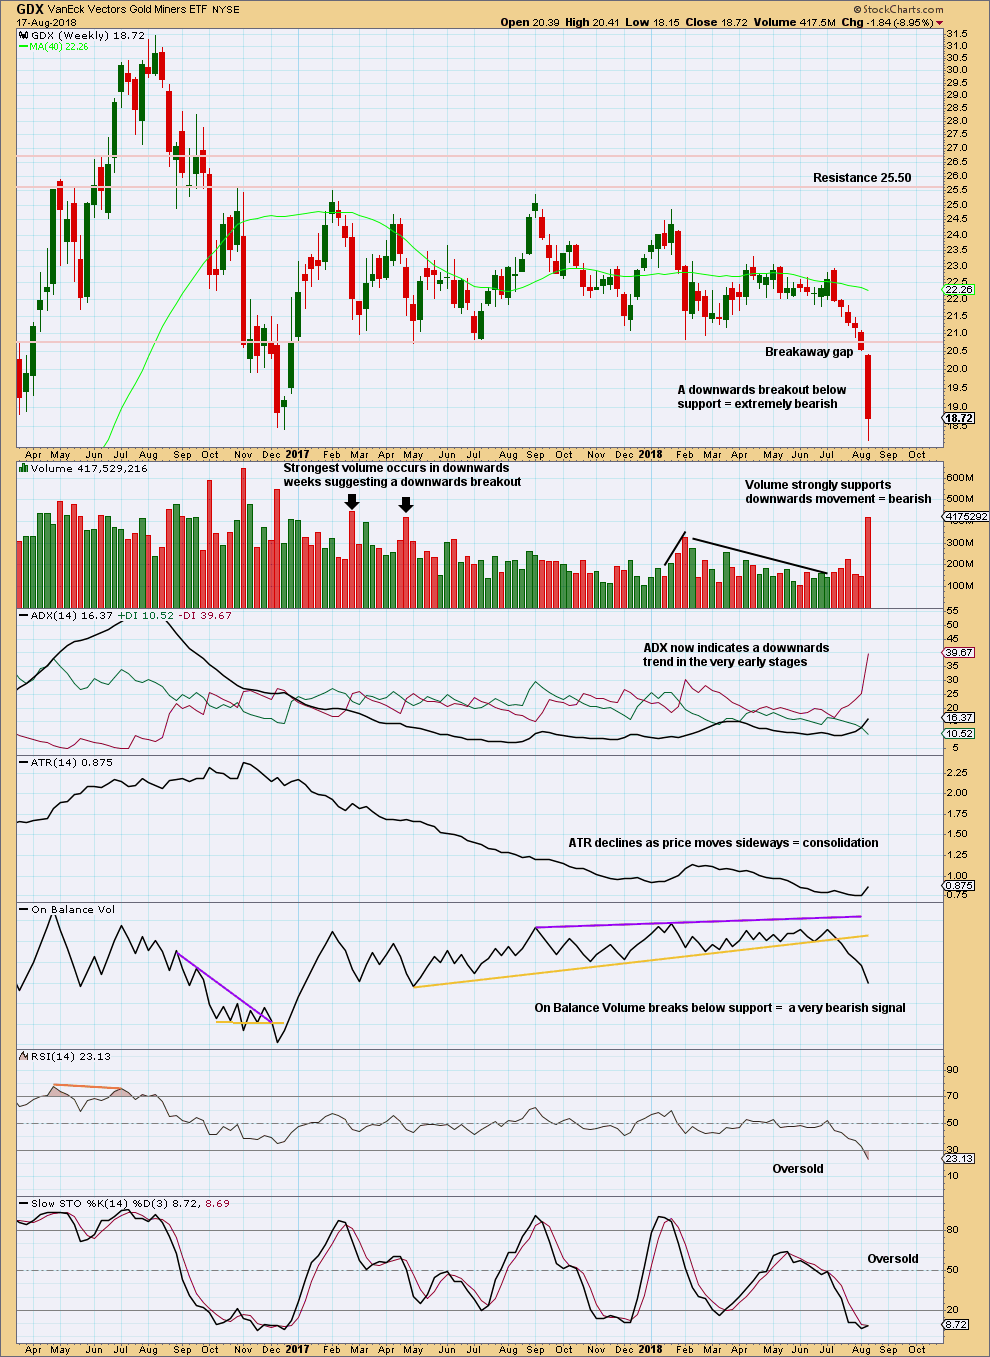
Click chart to enlarge. Chart courtesy of StockCharts.com.
GDX is now moving lower exactly as expected.
After a breakout, a technical principle is the longer that price consolidates sideways the longer the resulting trend may be expected to be. Also, the longer that price meanders sideways the more energy may be released after a breakout. This is what is happening now for GDX.
The target for this downwards trend to end is calculated using the measured rule. The widest part of the consolidation is added to the breakout point at 20.80 giving a target at 16.02. That is not yet met.
At the weekly chart level, there is a clear downwards breakout with a breakaway gap. As breakaway gaps should not be closed, they may be used to set stops that may be set just above a downwards breakaway gap.
GDX DAILY CHART
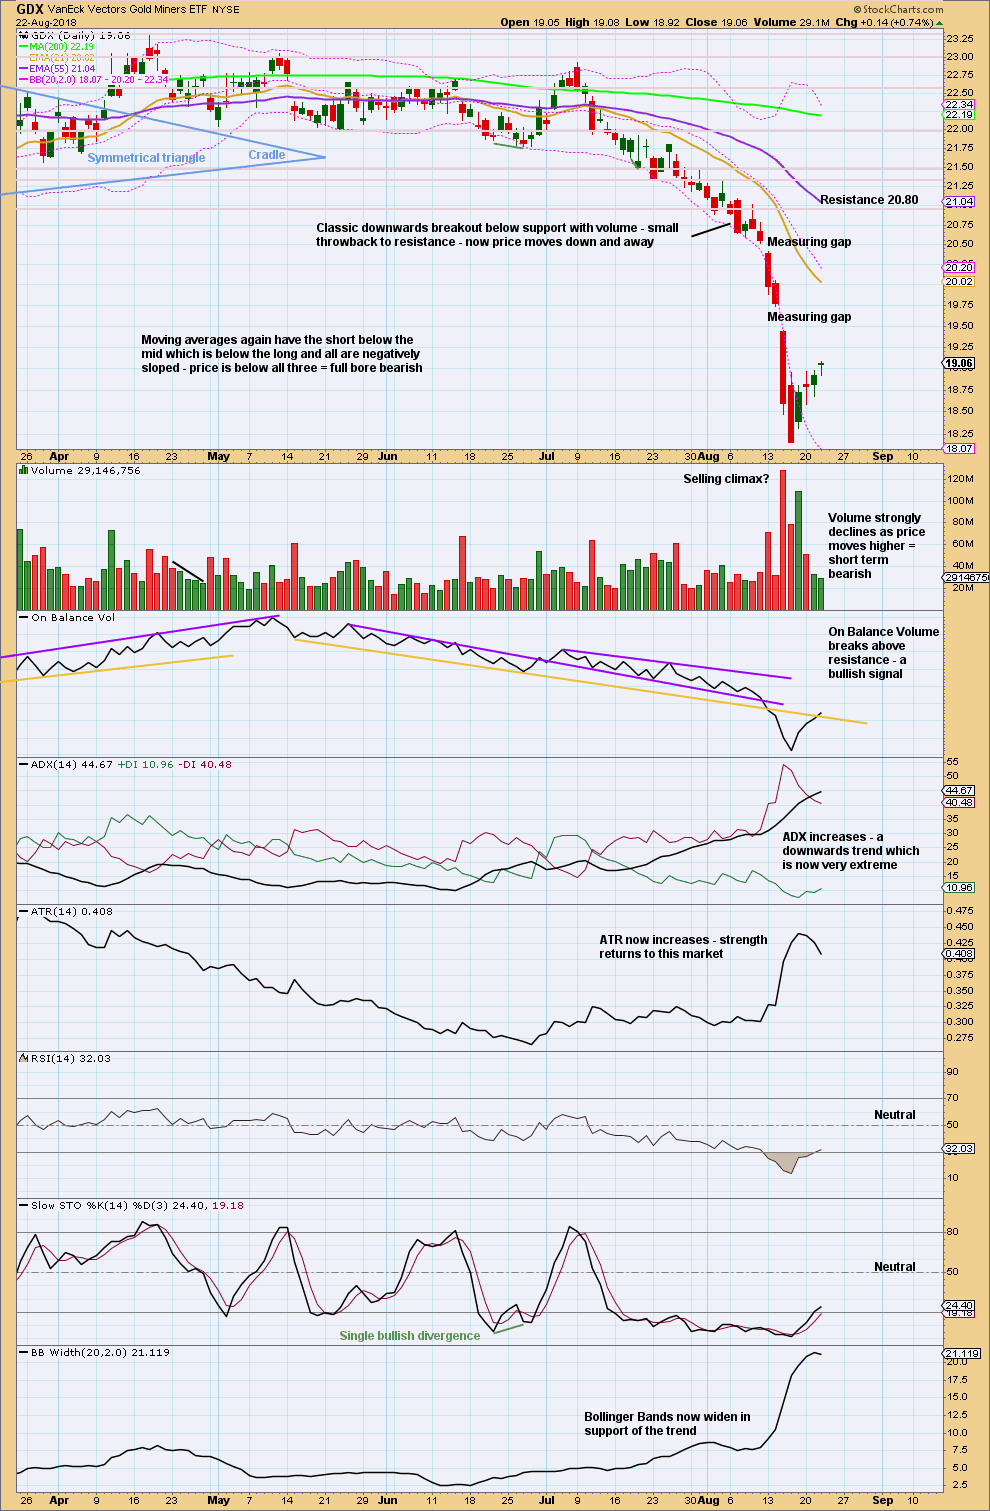
Click chart to enlarge. Chart courtesy of StockCharts.com.
GDX has now closed below support on a strong downwards day with support from volume. New lows are the lowest for GDX since December 2016. This is extremely significant for GDX.
GDX is in a downwards trend. Bounces and consolidations may be used as opportunities to join the trend. There is a small bounce of the last four days that looks now very weak despite a bullish signal today from On Balance Volume.
The last measuring gap may provide resistance. A closure of this gap with a new high above 19.74 would be significant; at that stage, it would not be a measuring gap but an exhaustion gap. Assume it is a measuring gap, until proven otherwise.
Looking back over the last 3 1/2 years at GDX, at the daily chart level, I see it can reach extreme levels and remain there while price continues to move a reasonable distance. Only when it has reached very extreme and then exhibits strong divergence may an end to a strong trend be indicated. I would advise members trading GDX at this time to take some time to look over price action of the last few years, with ADX and RSI especially, and study carefully what happened towards at the end of strong trends.
Please remember to protect your trading accounts by careful risk management. Follow my two Golden Rules:
1. Always trade with stops.
2. Risk only 1-5% of equity on any one trade.
A possible target for this downwards trend to end may be now calculated using the measured rule, giving a target about 16.02.
Published @ 08:48 p.m. EST.
An upwards wave is complete, now a new wave down or a pullback is underway.
The triangle count sees this as a possibly very deep minor wave 2.
It appears combination count is playing out. Expect low to be 1147.
Two years of sideways price movement from Aug 2016 to Aug 2018????
Price will have to make a new low to confirm that count.
yes one more low!!!
Not necessarily. For the main count a second wave correction here should be expected to be very deep indeed, the first second wave correction within a new trend for Gold usually is quite a bit deeper than the 0.618 Fibonacci ratio.
And so price won’t tell us until it makes a new low if the combination count is correct, and right before that happens both counts will look entirely viable.
Yes indeed! 🙂
If support holds, this may be a possibility
https://www.tradingview.com/x/zeHEXegB/
Oops. Bad idea