
An update of monthly charts.
Summary: The bigger picture sees Gold as most likely still within a B wave, most likely at cycle degree. Each end of week analysis will look at the various remaining viable structures this B wave may be.
This analysis also considers the possibility that the correction for Gold was over in November 2015 and a new bull market is developing.
New updates to this analysis are in bold.
Grand SuperCycle analysis is here.
MAIN ELLIOTT WAVE COUNT
MONTHLY CHART
Click chart to enlarge.
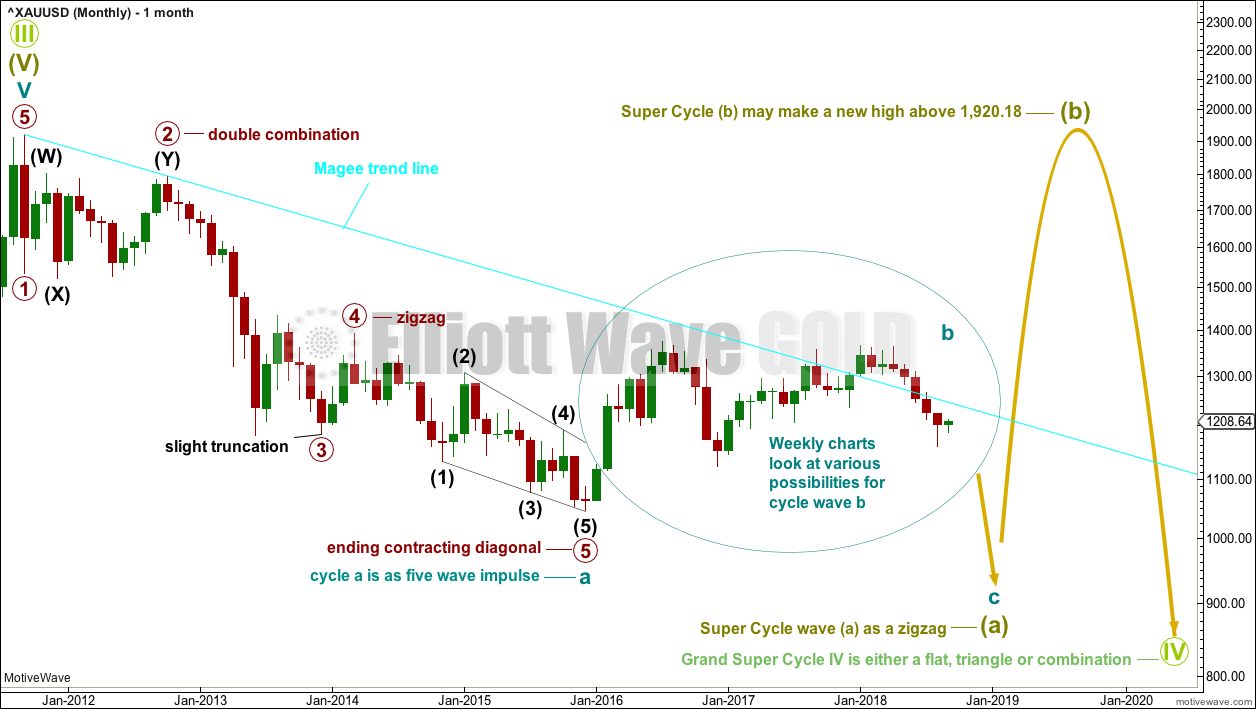
The main wave count will look at the large downwards wave from the all time high as a five wave impulse. For this main wave count, it will be labelled as cycle wave a, within a zigzag for Super Cycle wave (a).
It is also possible to move the degree of labelling up one degree and see this as a five wave structure complete for Super Cycle wave (a).
Both degrees of labelling would be valid, but in the interests of keeping charts and ideas to a manageable level only one shall be published at this stage. The difference will not be material for at least a year and probably more.
If cycle wave a is a five, then cycle wave b may not move beyond its start above 1,920.18.
Cycle wave b may be any one of more than 23 possible corrective structures. As cycle wave b unfolds the various possibilities which remain valid will be considered on a weekly basis.
When cycle wave b is complete, then cycle wave c downwards should unfold. Cycle wave c would most likely reach about equality in length with cycle wave a.
If this wave count unfolds as expected, then a huge zigzag downwards may be complete when cycle wave c completes. That would then be expected to be followed by a huge three wave structure upwards, most likely another zigzag for Super Cycle wave (b), which may make a new all time high.
The larger structure for Grand Super Cycle wave (IV) would be starting out with a huge zigzag downwards, indicating either a flat, triangle or combination.
FIRST ALTERNATE ELLIOTT WAVE COUNT
MONTHLY CHART
Click chart to enlarge.
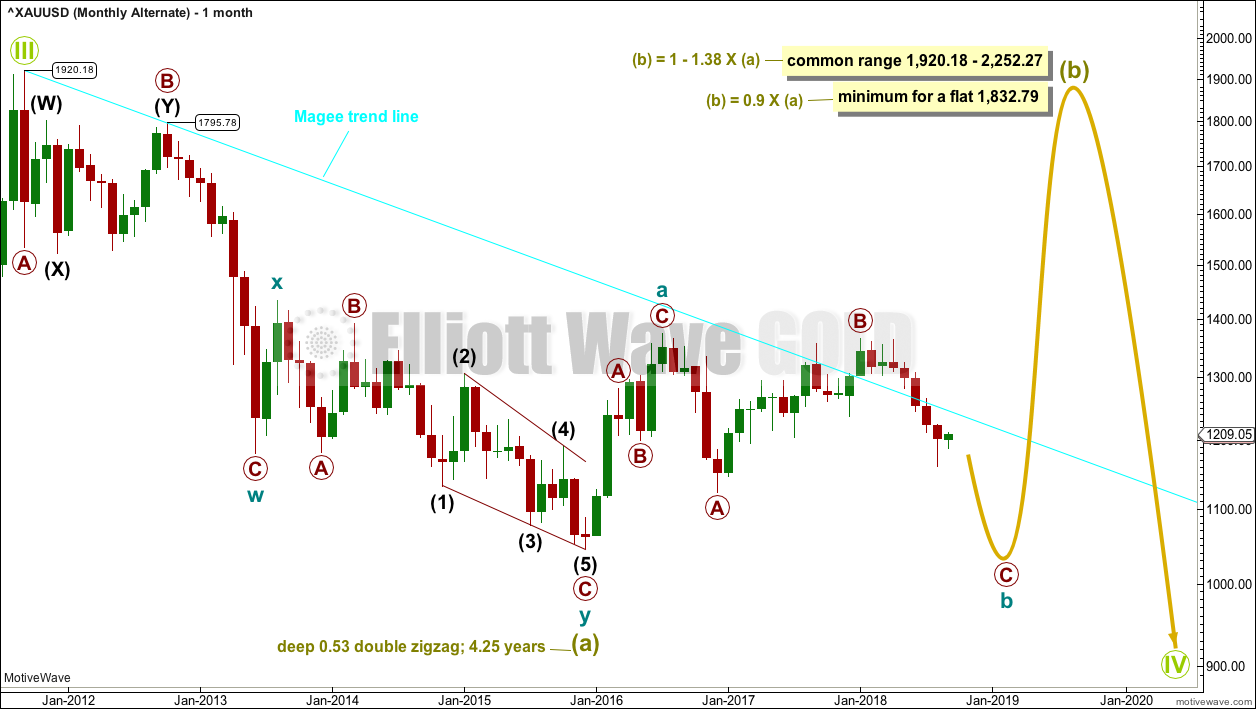
The large wave down from September 2011 to November 2015 may also be seen as a three wave structure, a double zigzag.
If the big wave down is a multiple three wave structure, then Grand Super Cycle wave (IV) may be either a flat or triangle. It may not be a combination because they may not have multiples within multiples.
If Grand Super Cycle wave (IV) is a flat correction, then within it Super Cycle wave (b) must retrace a minimum 0.9 length of Super Cycle wave (a) at 1,832.79.
If Grand Super Cycle wave (IV) is a triangle, then there is no minimum requirement for Super Cycle wave (b). There is only the structural requirement that it should be a three wave structure. Super Cycle wave (b) would need to move higher for a triangle to have the right look.
At this stage, it looks like Super Cycle wave (b) for this wave count may be an unfolding expanded flat correction. Flats are common structures for B waves in particular. An expanded flat for Super Cycle wave (b) may see its C wave reach up to the minimum requirement at 1,832.79 for a flat correction, for the structure one degree higher at Grand Super Cycle degree.
SECOND ALTERNATE ELLIOTT WAVE COUNT
MONTHLY CHART
Click chart to enlarge.
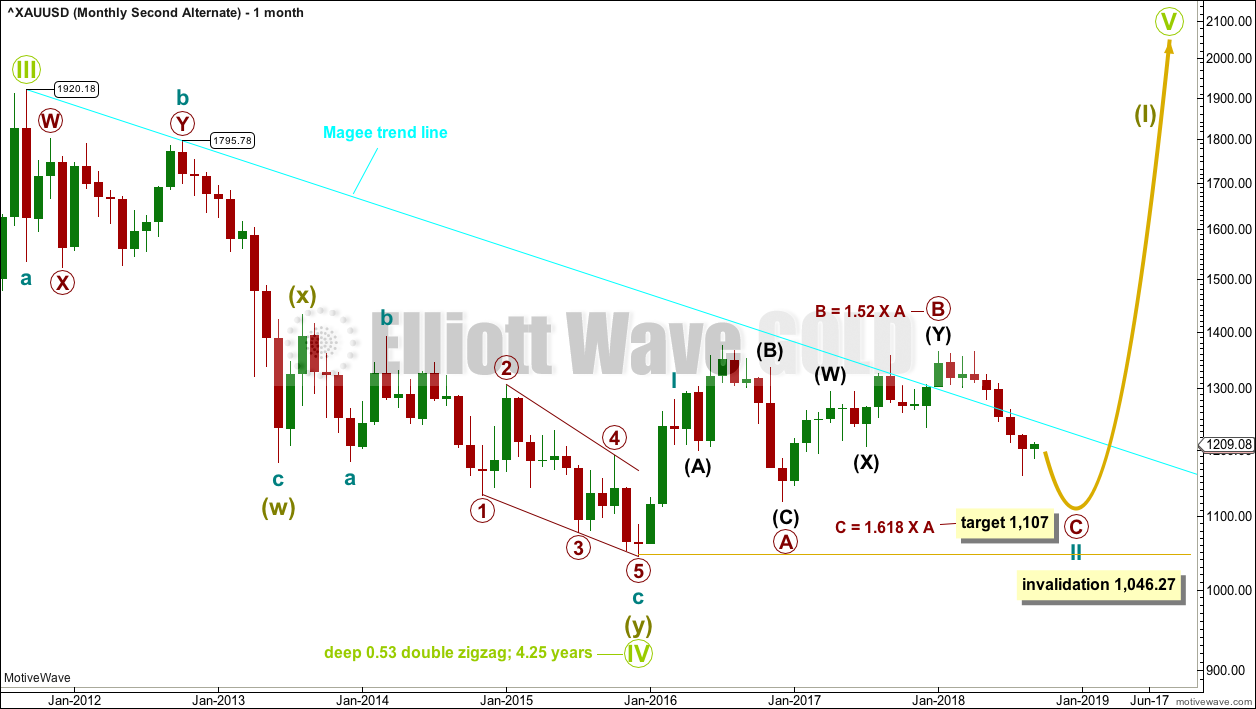
By simply moving the degree of labelling within the last huge wave down all up one degree, it is possible to see that Grand Super Cycle wave IV could be over. It would be rather brief though at only 4.25 years. However, Grand Super Cycle wave II in the Grand Super Cycle analysis is expected to have lasted only about 8 years, so this possibility should be accepted.
If there has been a trend change at Grand Super Cycle degree in the end of November 2015, then a new five wave structure upwards should develop from there at the monthly chart level.
Gold will often form long slow basing movements. Its first waves can be short and its second waves long lasting and deep.
Cycle wave I may have been complete and relatively short and brief at only 3 months duration.
Cycle wave II may now be an incomplete expanded flat correction. Within the expanded flat, primary wave B is longer than the most common range of up to 1.38 times the length of primary wave A, but it is still within allowable limits of up to 2 times the length of primary wave A.
For this wave count, a new low below 1,123.08 would be required for primary wave C of cycle wave II to avoid a truncation and a very rare running flat. A running flat here would not be acceptable; the probability would be minuscule.
A target is calculated for primary wave C that expects it to exhibit the most common Fibonacci ratio to primary wave A within an expanded flat.
If price makes a new low below 1,123.08 and does not make a new low below 1,046.27, and then turns up strongly, then this wave count must be considered to be valid.
TECHNICAL ANALYSIS
MONTHLY CHART
Click chart to enlarge. Chart courtesy of StockCharts.com.
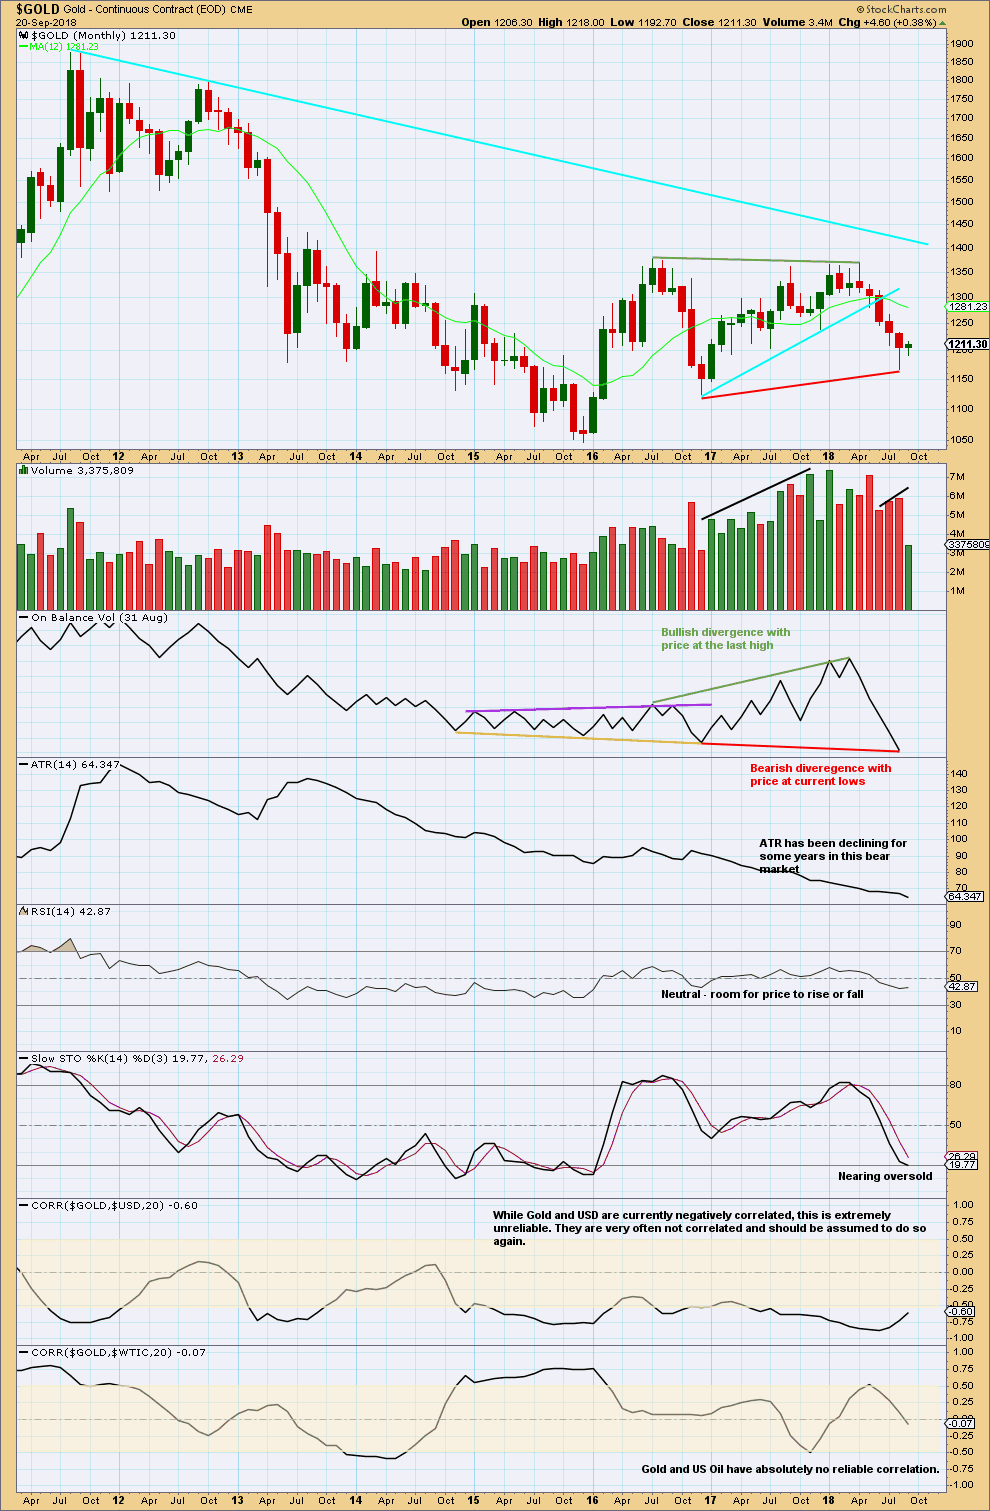
A break of the upwards sloping cyan line was significant. At this time, the short term trend is down until proven otherwise.
Volume supported the last rise in price. At this time, volume still offers some support to falling price.
Volume during the sideways consolidation that began after the low in November 2015 has substantially increased from the prior downwards wave. This may not support the idea of a B wave unfolding here; it is possible that the last wave down ended a correction and a new trend is developing with some basing action, and this would support the second alternate monthly chart.
It needs to be noted that divergence between On Balance Volume and price here may not correctly predict the next move for price. After a new high by On Balance Volume in March 2008, price did not follow through with a new major swing high. Now a new low by On Balance Volume may not necessarily be followed through by a new major swing low from price.
Declining ATR does support the idea that this consolidation may be a B wave. This may support the main or first alternate monthly Elliott wave counts.
Stochastics reaching oversold on the monthly chart is not a good timing tool in predicting when a low may be found. It is a warning only. Price may continue reasonably lower and Stochastics may remain oversold for a many months before a low is found.
This analysis is considered independently of the USD index analysis and US Oil analysis because neither of those markets have a reliable correlation to Gold. For an explanation of how to use a correlation co-efficient please read this post here.
Published @ 04:56 a.m. EST on 21st September, 2018.
Thanks for doing this Lara. It is always nice to have the big picture
You’re welcome.