

S&P 500
Upwards movement continues as expected.
On Balance Volume this week gives important signals on the daily and weekly charts.
Summary: The pullback looks like is over. On Balance Volume makes new all time highs this week on the daily and weekly charts; this supports a bullish wave count.
A new all time high above 2,916.50 would confirm the bullish wave count. At that stage, the target would then be in a small zone from 3,041 (Elliott wave) to 3,045 (classic analysis).
A new low below 2,802.49 would strongly indicate the bearish wave count is most likely. The target for a multi month consolidation of primary wave 4 would then be at either 2,698 (0.236 Fibonacci ratio) or 2,563 (0.382 Fibonacci ratio).
The final target for this bull market to end remains at 3,616, which may be met in October 2019.
The biggest picture, Grand Super Cycle analysis, is here.
Last historic analysis with monthly charts is here, video is here.
MAIN ELLIOTT WAVE COUNT – BULL
WEEKLY CHART
Click chart to enlarge.
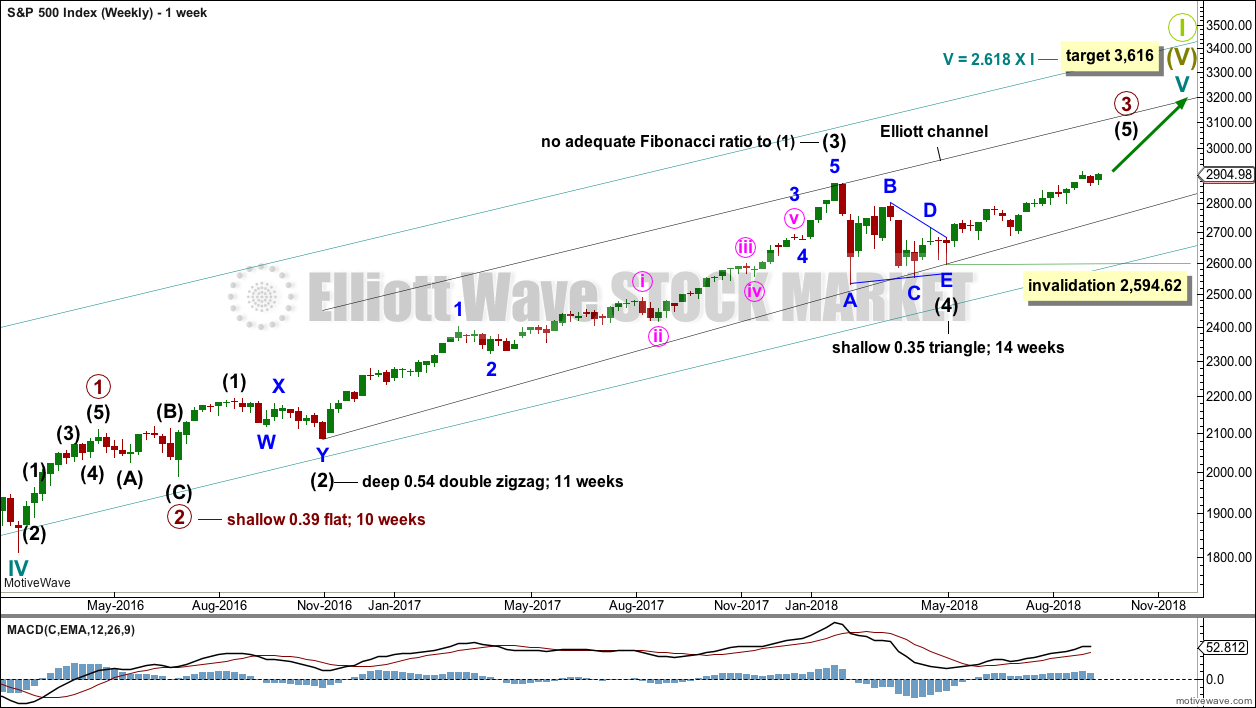
Cycle wave V must complete as a five structure, which should look clear at the weekly chart level and also now at the monthly chart level. It may only be an impulse or ending diagonal. At this stage, it is clear it is an impulse.
Within cycle wave V, the third waves at all degrees may only subdivide as impulses.
Intermediate wave (4) has breached an Elliott channel drawn using Elliott’s first technique. The channel is redrawn using Elliott’s second technique: the first trend line from the ends of intermediate waves (2) to (4), then a parallel copy on the end of intermediate wave (3). Intermediate wave (5) may end either midway within the channel, or about the upper edge.
There is perfect alternation and excellent proportion between intermediate waves (2) and (4).
At this stage, the expectation is for the final target to me met in October 2019. If price gets up to this target and either the structure is incomplete or price keeps rising through it, then a new higher target would be calculated.
DAILY CHART
Click chart to enlarge.
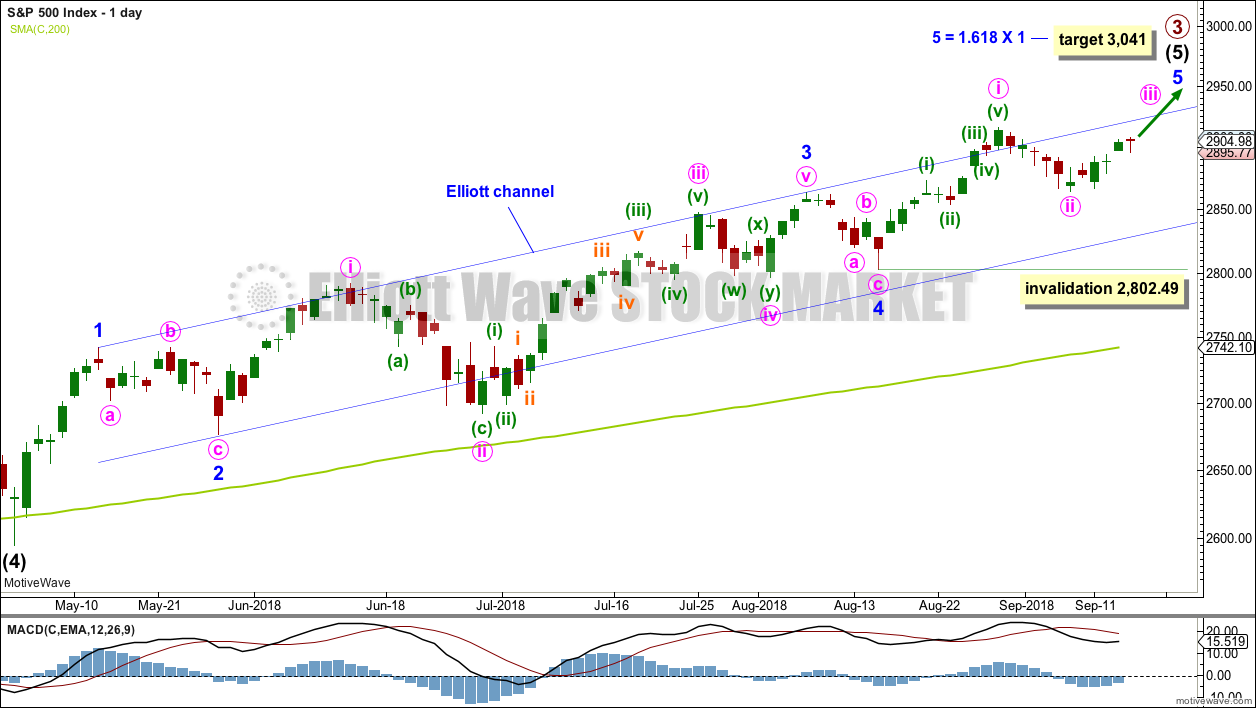
Intermediate wave (5) avoided a truncation now that it has a new high above the end of intermediate wave (3) at 2,872.87.
Intermediate wave (3) exhibits no Fibonacci ratio to intermediate wave (1). It is more likely then that intermediate wave (5) may exhibit a Fibonacci ratio to either of intermediate waves (1) or (3). Intermediate wave (5) has passed equality in length with intermediate wave (1). The next target was at 2,922, 1.618 the length of intermediate wave (1), which may have been almost met.
A target for intermediate wave (5) to end is recalculated at minor degree. Because this target is so close to the classic analysis target at 3,045, it does have a reasonable probability.
Intermediate wave (5) is unfolding as an impulse, and within it minor waves 1 through to 4 may now all be complete.
Assume the upwards trend remains intact while price remains above 2,802.49. The trend remains the same until proven otherwise.
ALTERNATE ELLIOTT WAVE COUNT – BEAR
WEEKLY CHART
Click chart to enlarge.
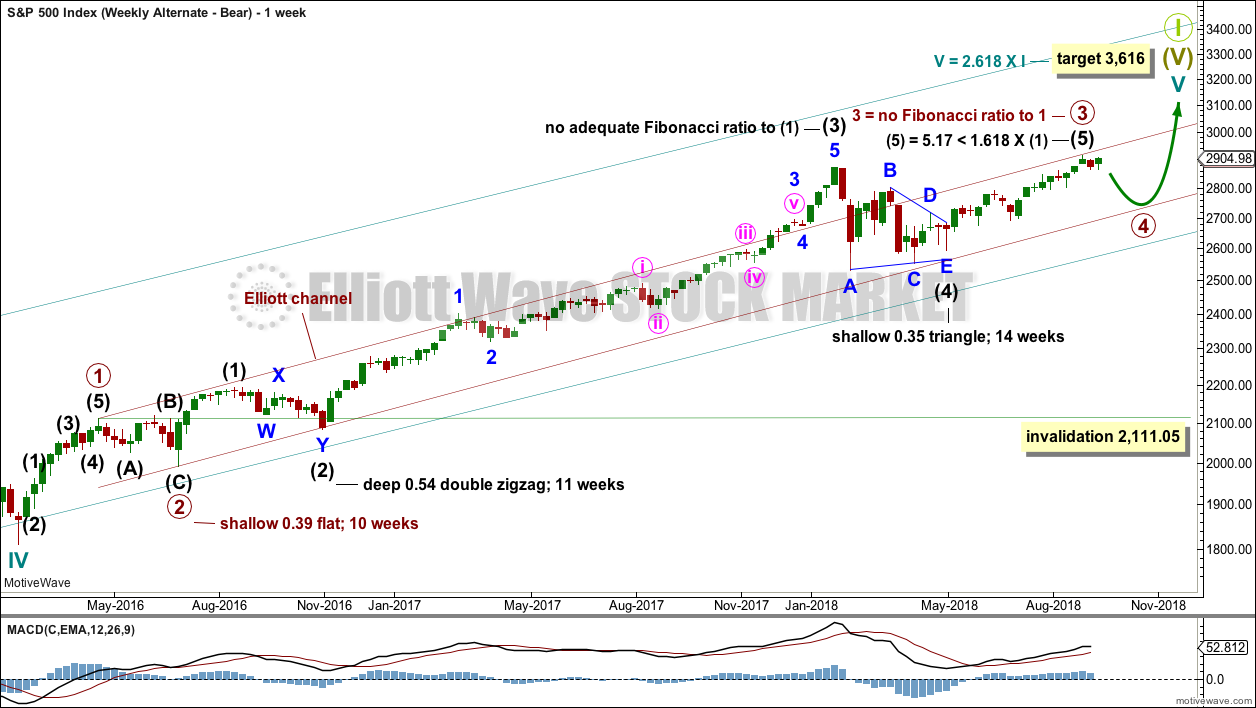
The probability of this alternate wave count is reduced at the end of this week because it does not have support from classic technical analysis.
It is possible that primary wave 3 was over at the last high. Fibonacci ratios are noted on the chart.
Primary wave 2 was a shallow flat lasting 10 weeks. Primary wave 4 may be expected to exhibit alternation in one or both of depth and structure. Primary wave 4 may last about a Fibonacci 8, 13 or possibly even 21 weeks to exhibit reasonable proportion to primary wave 2.
Primary wave 2 shows up on the monthly chart. Primary wave 4 may be expected to last at least one month, and likely longer, for the wave count to have the right look at the monthly chart level.
Primary wave 4 may end about the lower edge of the maroon Elliott channel. Primary wave 4 may end within the price territory of the fourth wave of one lesser degree: intermediate wave (4) has its price territory from 2,872.87 to 2,532.69.
The channel on this bear wave count is redrawn about primary degree waves using Elliott’s first technique. The overshoot at the end of intermediate wave (3) is very typical; third waves are usually the strongest wave within an impulse and may end with strength. The lower edge of this channel contains all deeper pullbacks since the end of primary wave 2, and so it looks fairly likely that primary wave 4 may end about the lower edge of this maroon channel.
If primary wave 4 is deeper than expected, then it should find very strong support at the lower edge of the teal channel. This channel, copied over from the monthly chart, has provided support for all deeper pullbacks within this bear market since March 2009.
Primary wave 4 may not move into primary wave 1 price territory below 2,111.05.
DAILY CHART
Click chart to enlarge.
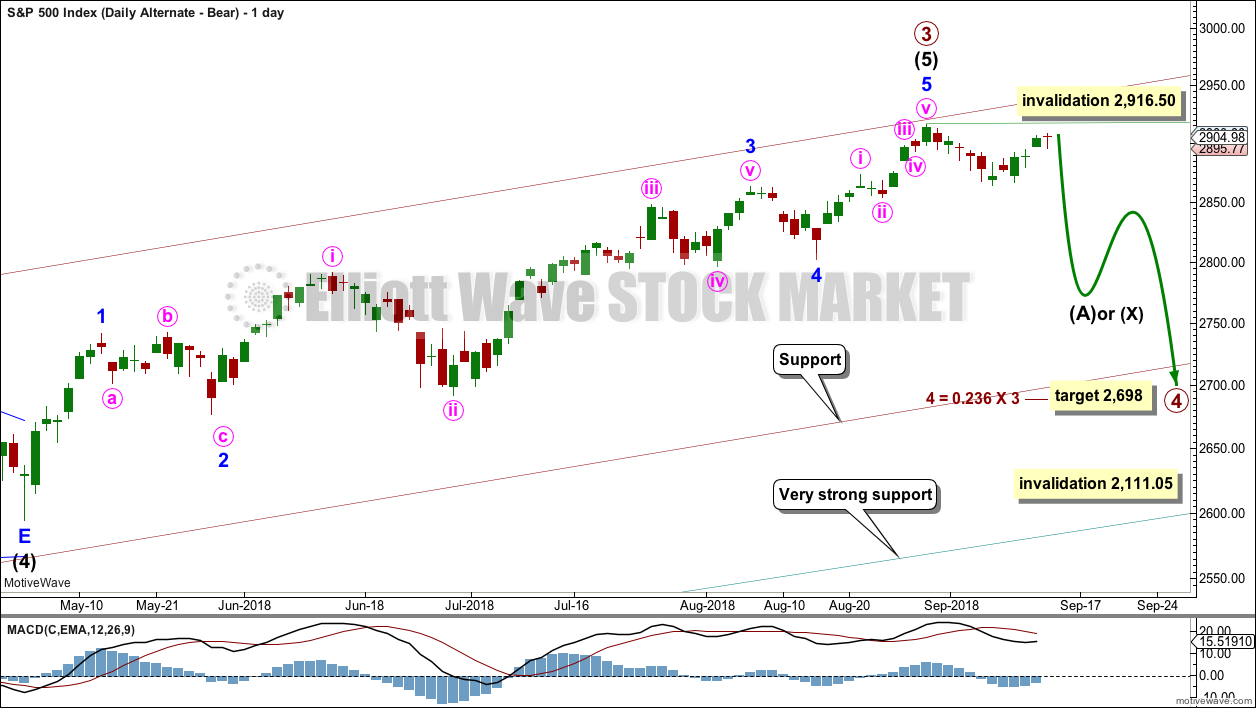
The first movement down within primary wave 4 should be a five wave structure, which should be visible at the daily chart level. While that is incomplete, no second wave correction may move beyond the start of the first wave above 2,916.50.
Within the target range of 2,872.87 to 2,532.69 sit the 0.236 and 0.382 Fibonacci ratios of primary wave 3. The 0.236 Fibonacci ratio at 2,698 would be the first target. If price keeps falling through this first target, then the next target would be the 0.382 Fibonacci ratio at 2,563.
Primary wave 4 would most likely be a zigzag, combination or triangle. Within a zigzag, intermediate wave (A) must subdivide as a five wave structure. Within a combination or triangle, intermediate wave (A) (or (X) ) should subdivide as a three wave structure, most likely a zigzag.
Within primary wave 4, downwards waves may be swift and very strong.
TECHNICAL ANALYSIS
WEEKLY CHART
Click chart to enlarge. Chart courtesy of StockCharts.com.
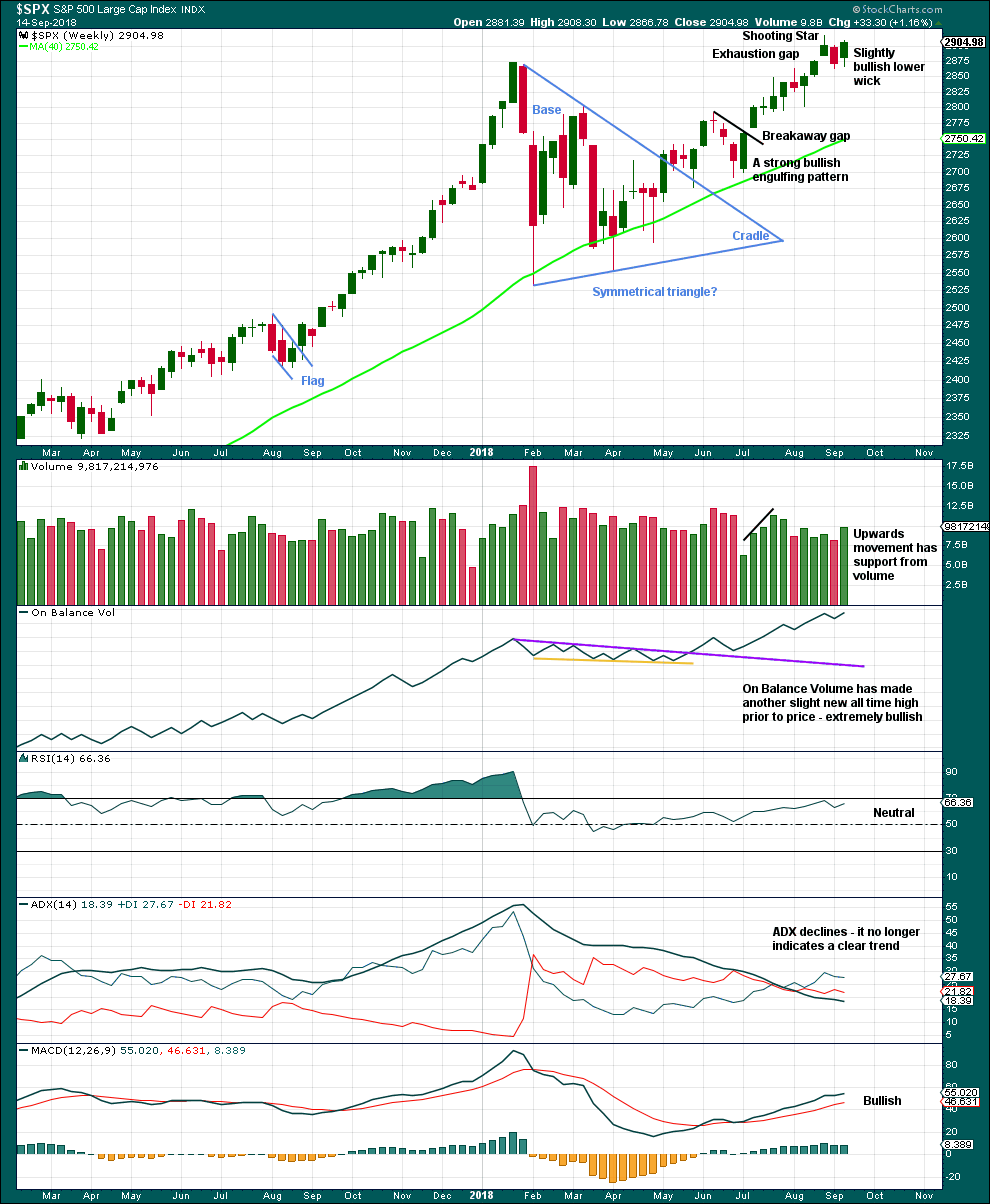
The symmetrical triangle base distance is 340.18. Added to the breakout point of 2,704.54 this gives a target at 3,044.72. This is very close to the new Elliott wave target at 3,041.
It now looks most likely that the downwards week last week is a typical backtest of support after the new all time high.
The bullish signal from On Balance Volume is given reasonable weight in this analysis. It supports the main Elliott wave count.
DAILY CHART
Click chart to enlarge. Chart courtesy of StockCharts.com.
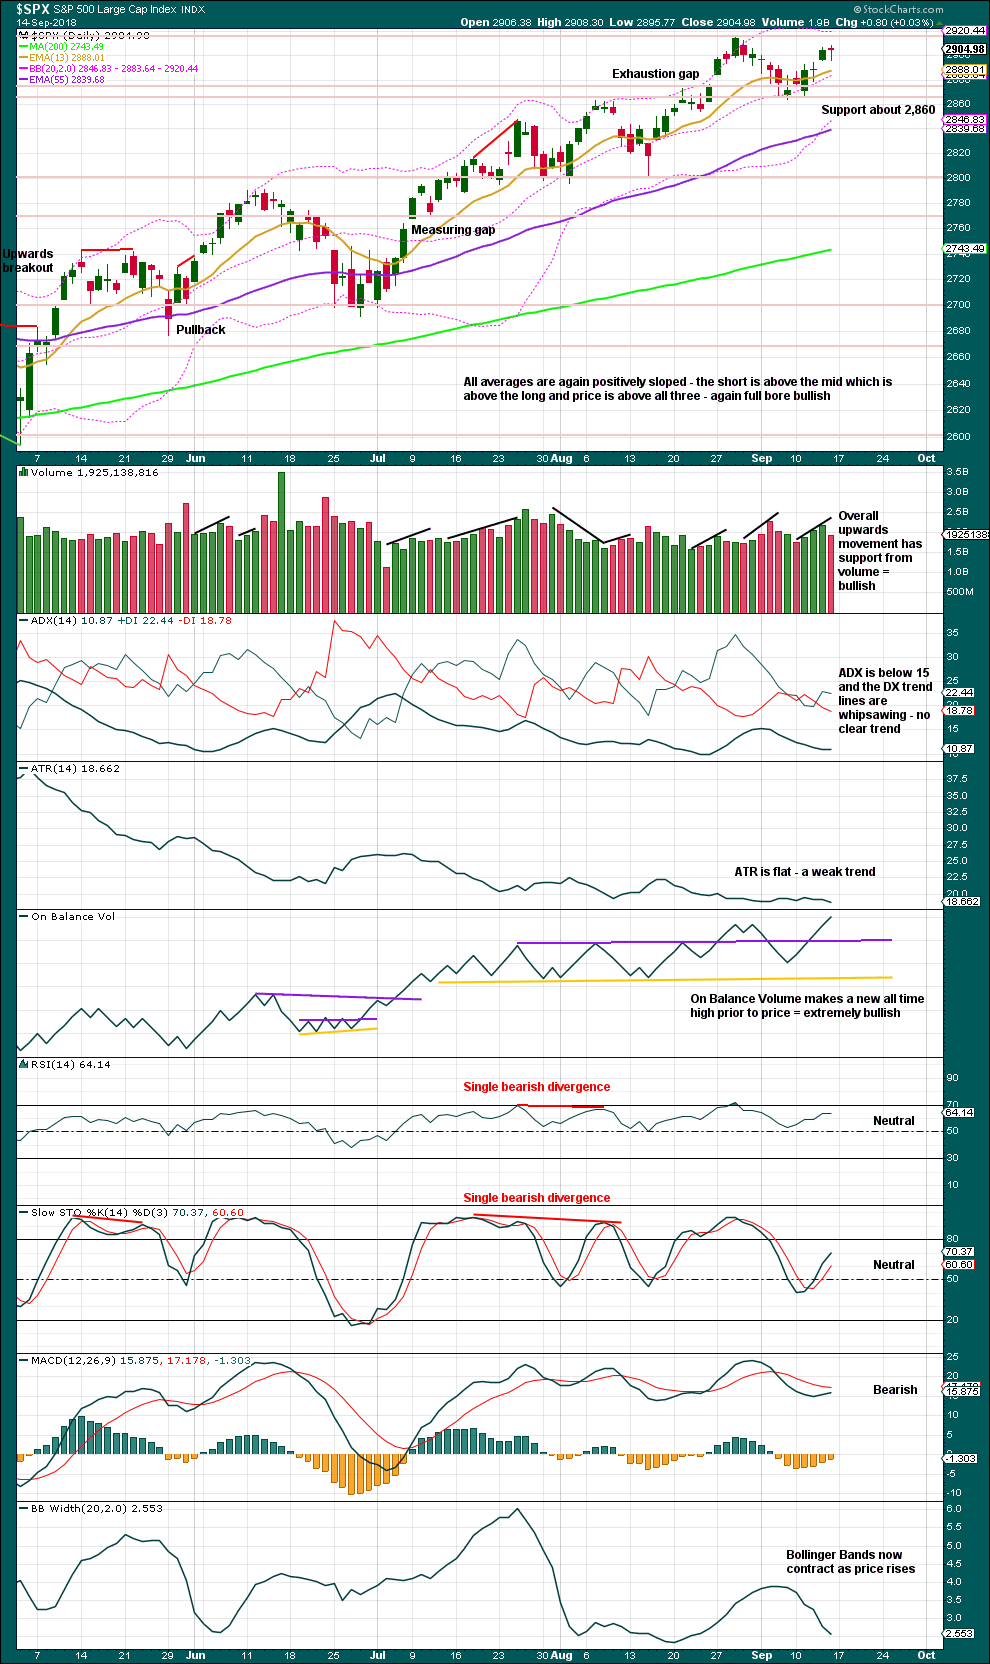
Since the low on the 2nd of April, 2018, price has made a series of higher highs and higher lows. While the last swing low at 2,802.49 has not been breached, there will still be a series of higher highs and higher lows in place; the upwards trend should be assumed to remain intact until proven otherwise. A bullish engulfing candlestick pattern with support from volume comes after another pullback. This is a strong indication that the pullback may be over. Look now for the upwards trend to resume.
Downwards movement looks corrective; this does not look like a convincing start to primary wave 4. ATR is weak and volume is now declining.
The gap upwards on Thursday may only be a pattern gap; these are usually closed. However, the gap may also be a breakaway gap; a new all time high would indicate a breakaway gap. At this time, while the picture is unclear, the gap will not be labelled as either pattern or breakaway.
Another new all time high from On Balance Volume means that overall this chart is now very bullish.
An exhaustion gap is the most bearish signal on this chart, and it is for this reason that a bearish alternate is still charted at all time frames.
VOLATILITY – INVERTED VIX CHART
WEEKLY CHART
Click chart to enlarge. Chart courtesy of StockCharts.com. So that colour blind members are included, bearish signals
will be noted with blue and bullish signals with yellow.
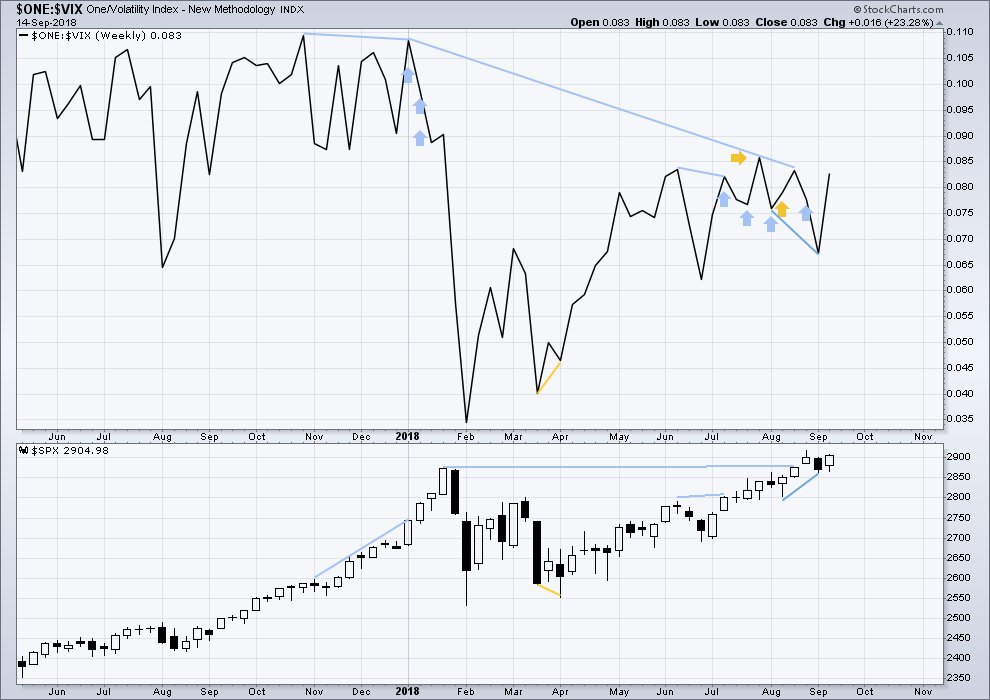
To keep an eye on the all time high for inverted VIX a weekly chart is required at this time.
Notice how inverted VIX has very strong bearish signals four weeks in a row just before the start of the last large fall in price. At the weekly chart level, this indicator may be useful again in warning of the end of primary wave 3.
At this time, there is mid term bearish divergence between price and inverted VIX: price has made a new all time high, but inverted VIX has not. This divergence may persist for some time. It may remain at the end of primary wave 3, and may develop further to the end of primary wave 5.
Strong bearish divergence noted last week has now been followed by an upwards week. It is considered to have failed.
Upwards movement in price has support this week from a normal corresponding decline in market volatility. There is no new divergence.
DAILY CHART
Click chart to enlarge. Chart courtesy of StockCharts.com. So that colour blind members are included, bearish signals
will be noted with blue and bullish signals with yellow.
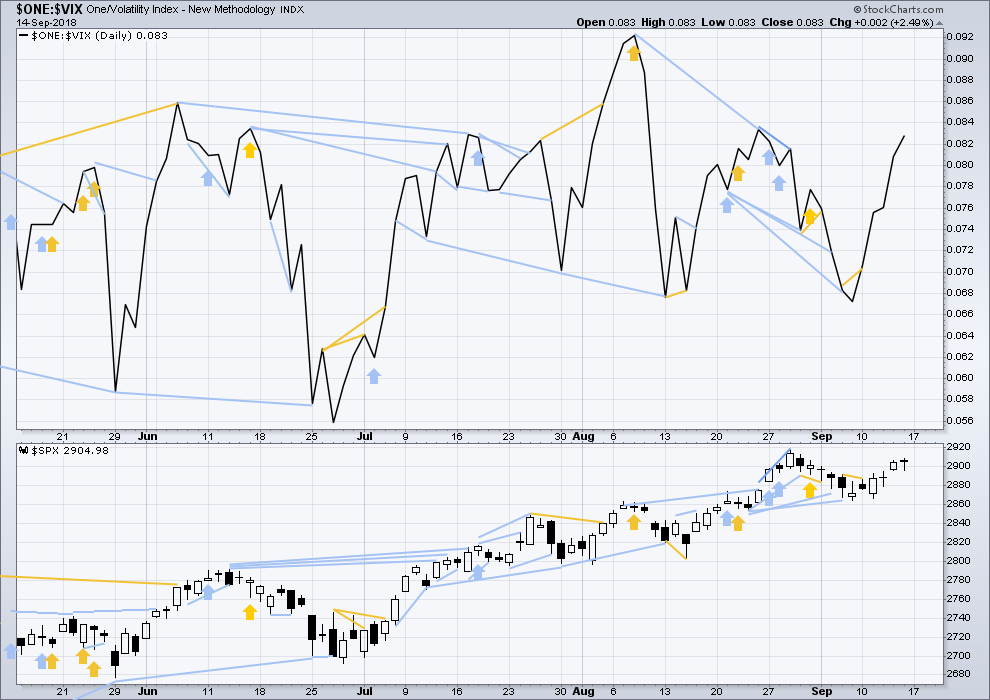
Normally, volatility should decline as price moves higher and increase as price moves lower. This means that normally inverted VIX should move in the same direction as price.
There is mid term divergence with a new all time high from price not supported by a corresponding new all time high from inverted VIX. This divergence is bearish.
Rising price comes with a normal corresponding decline in market volatility. There is no new divergence.
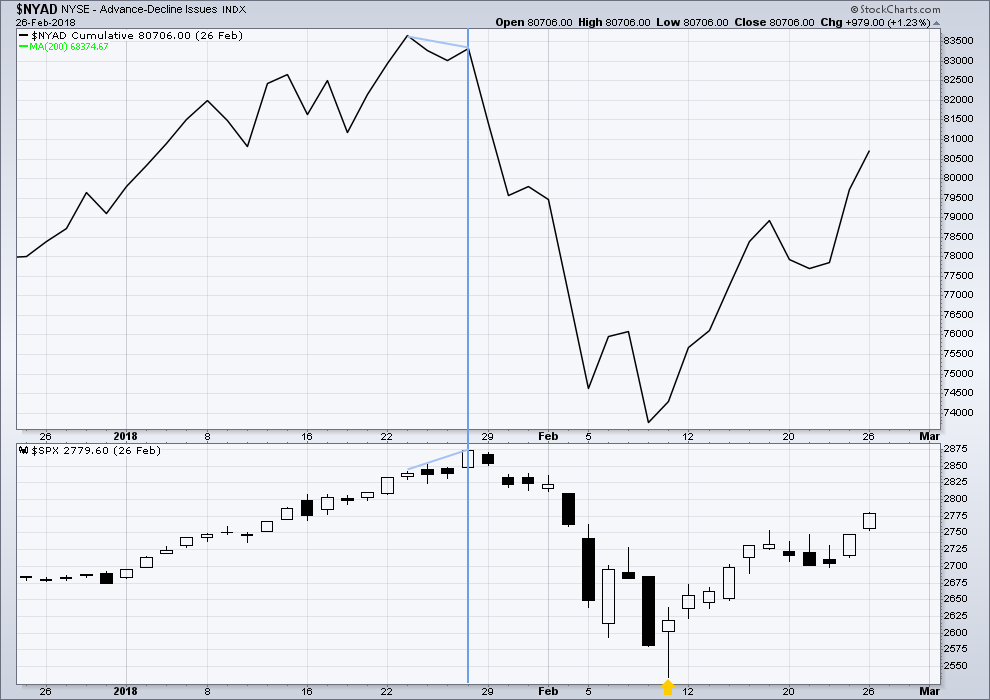
BREADTH – AD LINE
WEEKLY CHART
Click chart to enlarge. Chart courtesy of StockCharts.com.
When primary wave 3 comes to an end, it may be valuable to watch the AD line at the weekly time frame as well as the daily.
Short term weak divergence between price and the AD line noted last week has now been followed by an upwards week. It is considered to have failed.
There is no new divergence this week between price and the AD line.
DAILY CHART
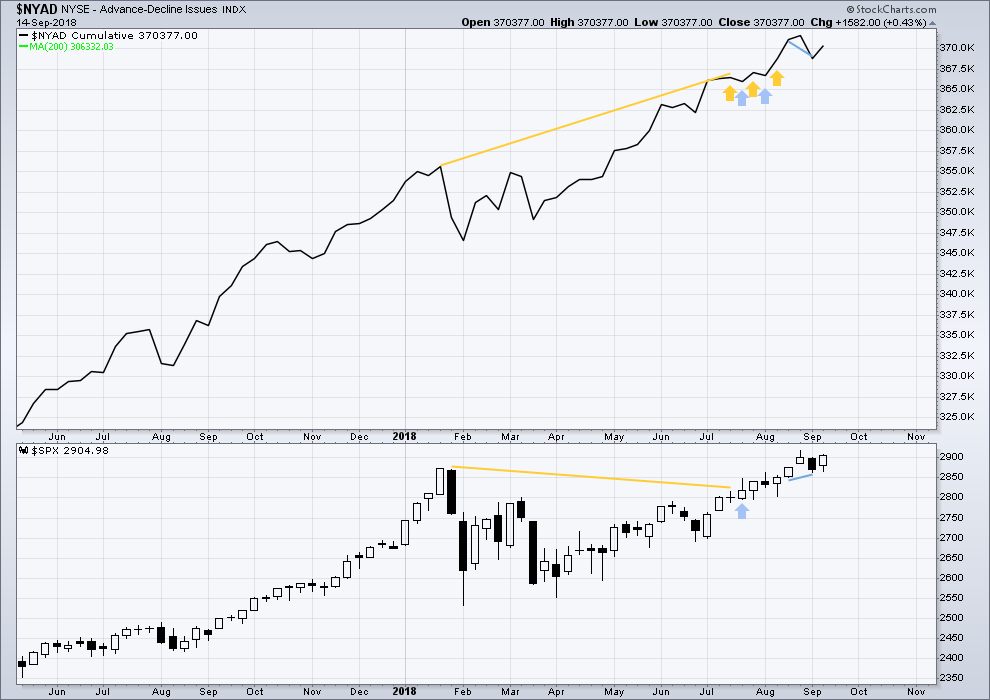
Click chart to enlarge. Chart courtesy of StockCharts.com.
There is normally 4-6 months divergence between price and market breadth prior to a full fledged bear market. This has been so for all major bear markets within the last 90 odd years. With no longer term divergence yet at this point, any decline in price should be expected to be a pullback within an ongoing bull market and not necessarily the start of a bear market. New all time highs from the AD line means that any bear market may be an absolute minimum of 4 months away. It may of course be a lot longer than that. My next expectation for the end of this bull market may now be October 2019.
Breadth should be read as a leading indicator.
Rising price has support from rising market breadth, but breadth is not rising as fast as price. This is a little bearish. Some divergence towards the end of primary wave 3 may be expected to develop; this bearishness may fit the main Elliott wave count.
All of small, mid and large caps made new all time highs on the 27th of August. There is a little divergence here in breadth with large caps continuing to make new all time highs on the 29th of August and small and mid caps lagging.
All of small, mid and large caps saw price rise this week. The rise in price has support from market breadth.
DOW THEORY
The following lows need to be exceeded for Dow Theory to confirm the end of the bull market and a change to a bear market:
DJIA: 23,360.29.
DJT: 9,806.79.
S&P500: 2,532.69.
Nasdaq: 6,630.67.
Nasdaq and DJT and now the S&P500 have all made recent new all time highs. For Dow Theory confirmation of the ongoing bull market, DJIA needs to make a new all time high.
DJT made another new all time high this week. It may be leading the market.
ANALYSIS OF THE END OF INTERMEDIATE WAVE (3)
TECHNICAL ANALYSIS
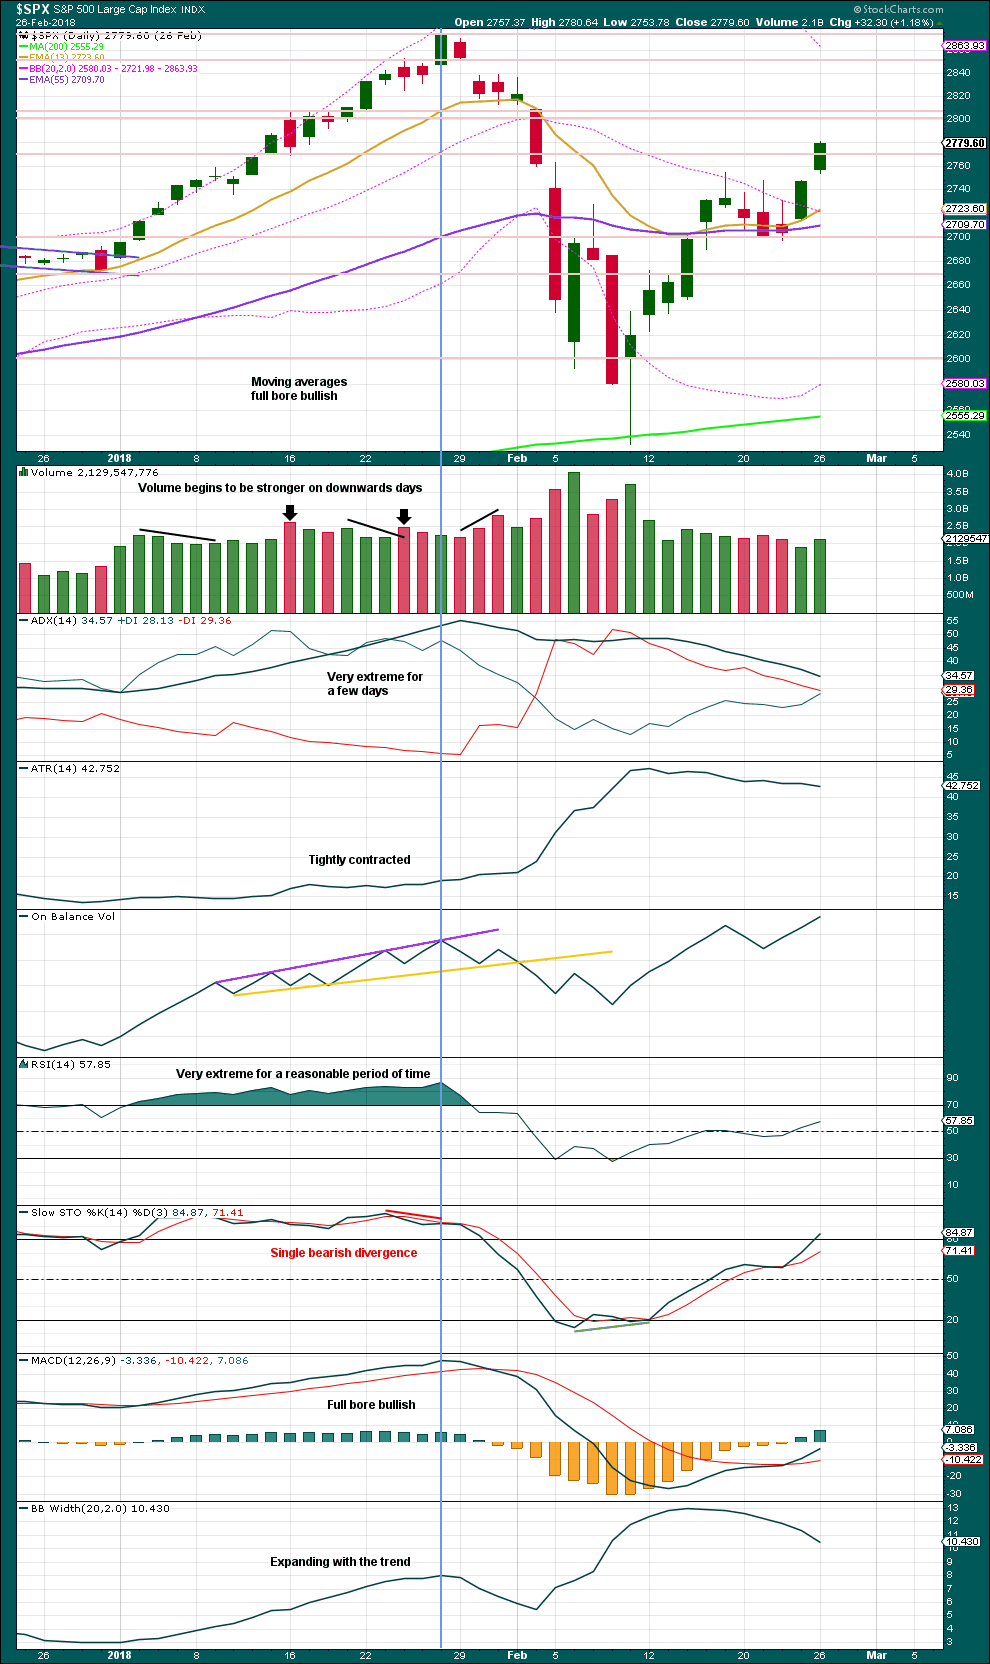
Click chart to enlarge. Chart courtesy of StockCharts.com.
This chart looked overly bullish at the end of intermediate wave (3). The only warning in hindsight may have been from volume spiking slightly on downwards days. There was no bearish divergence between price and either of RSI or On Balance Volume.
Single bearish divergence between price and Stochastics was weak, which is often an unreliable signal.
VIX
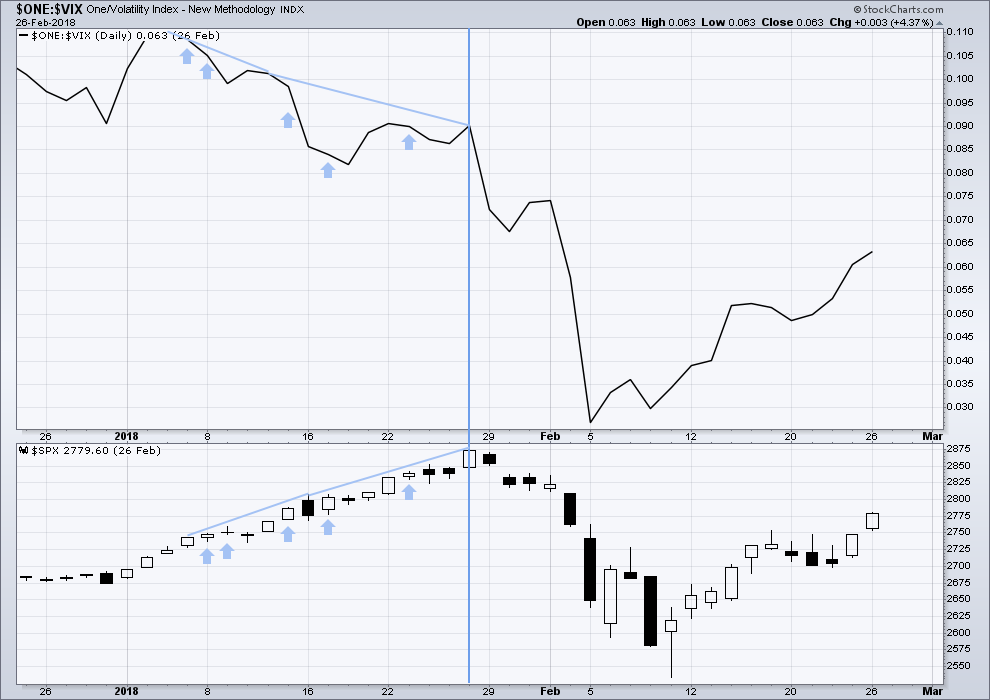
Click chart to enlarge. Chart courtesy of StockCharts.com.
This is a daily chart.
The strongest warning of an approaching intermediate degree correction at the daily chart level came from inverted VIX.
There was strong double bearish divergence at the high of intermediate wave (3), which is noted by the vertical line. There was also a sequence of five days of bearish divergence, days in which price moved higher but inverted VIX moved lower.
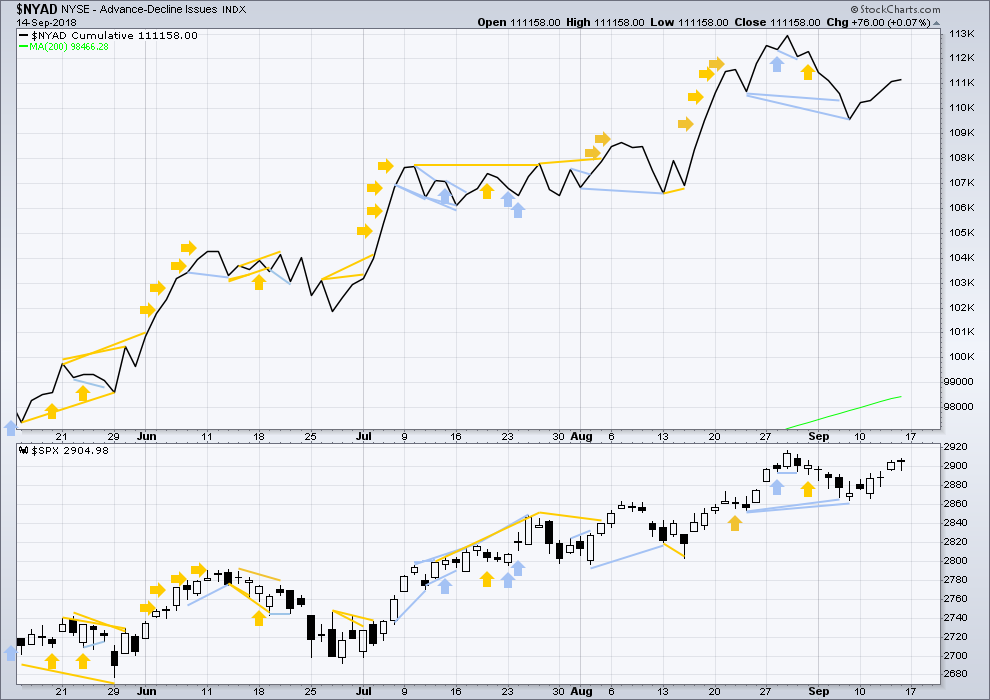
AD LINE
Click chart to enlarge. Chart courtesy of StockCharts.com.
This is a daily chart.
There was only single bearish divergence between price and the AD line at the end of intermediate wave (3). Approaching the high, there were no instances of price moving higher and the AD line moving lower.
Conclusion: When studying the behaviour of price and these indicators just before the start of intermediate wave (4), we may see some clues for warning us of primary wave 4. A cluster of bearish signals from VIX along with a bearish divergence from price and the AD line or On Balance Volume may warn of primary wave 4. The next instance will probably not behave the same as the last, but there may be similarities.
At this time, it does not look like primary wave 4 may begin right now, but we need to be aware of its approach.
GOLD
Sideways movement this week continued for Gold exactly as expected.
All four weekly Elliott wave counts will again be reviewed at the end of this week.
Summary: The trend is down and may not be complete for Gold. Expect some more sideways movement before the trend continues.
The target for Gold is now at 1,132.
The downwards trend for GDX reached very extreme and exhibited divergence with RSI. Look now for a bounce to relieve oversold and extreme conditions. If resistance at 18.50 is broken, then next resistance is at 19.74; if resistance at 19.74 is broken, then the bounce may end about 20.80 (where resistance is extreme).
Grand SuperCycle analysis is here.
Last historic analysis with monthly charts and several weekly alternates is here. Video is here.
Weekly charts are reviewed in today’s end of week analysis.
MAIN ELLIOTT WAVE COUNT
WEEKLY CHART – COMBINATION
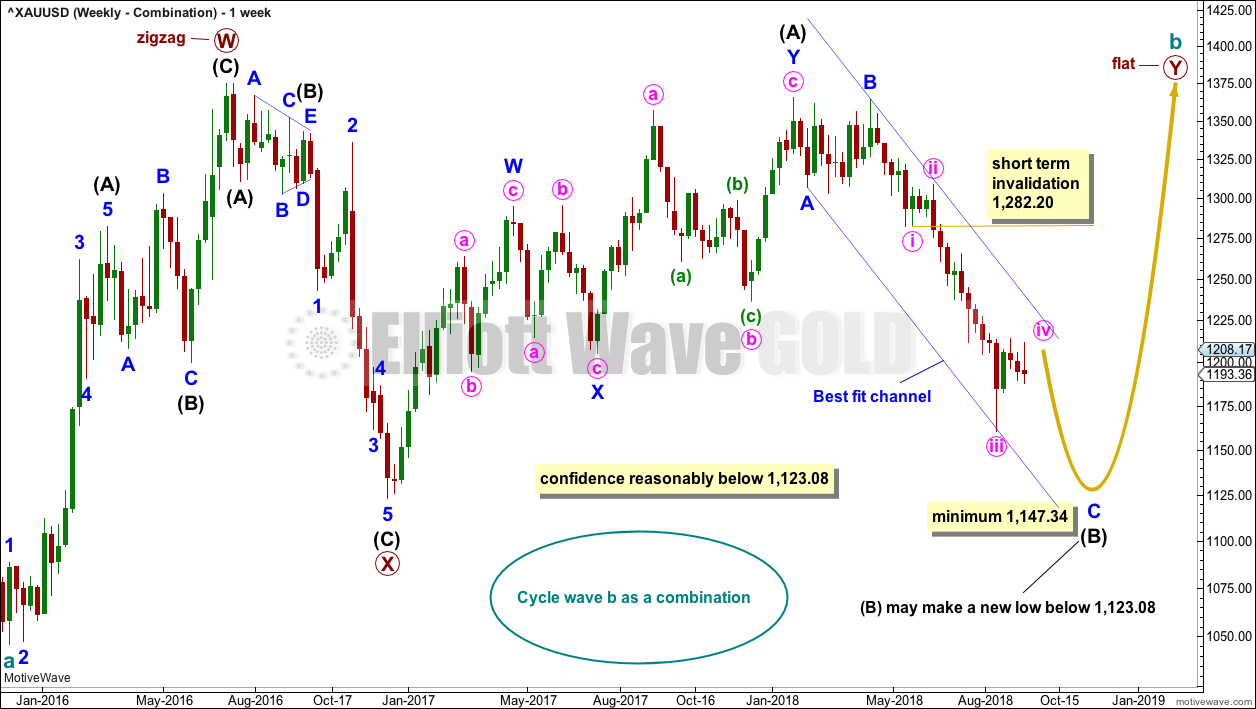
Click chart to enlarge.
There are four remaining weekly wave counts at this time for cycle wave b: a triangle, flat, combination or double zigzag.
All four weekly wave counts are again considered at the end of this week. Only two shall be followed on a daily basis.
At this stage, this wave count may have a slightly higher probability than the other three weekly wave counts because it has more support from classic technical analysis.
If cycle wave b is a combination, then the first structure in a double may be a complete zigzag labelled primary wave W.
The double may be joined by a three in the opposite direction, a zigzag labelled primary wave X.
The second structure in the double may be a flat correction labelled primary wave Y. My research on Gold so far has found that the most common two structures in a double combination are one zigzag and one flat correction. I have found only one instance where a triangle unfolded for wave Y. The most likely structure for wave Y would be a flat correction by a very wide margin, so that is what this wave count shall expect.
Within a flat correction for primary wave Y, the current downwards wave of intermediate wave (B) may be a single or multiple zigzag; for now it shall be labelled as a single. Intermediate wave (B) must retrace a minimum 0.9 length of intermediate wave (A) at 1,147.34. Intermediate wave (B) may move beyond the start of intermediate wave (A) as in an expanded flat.
Because the minimum requirement for intermediate wave (B) is not yet met, this wave count requires that minute wave v of minor wave C of intermediate wave (B) continues lower. This is the most immediately bearish of all four weekly wave counts.
When intermediate wave (B) is complete, then intermediate wave (C) would be expected to make at least a slight new high above the end of intermediate wave (A) at 1,365.68 to avoid a truncation. Primary wave Y would be most likely to end about the same level as primary wave W at 1,374.91, so that the whole structure takes up time and moves price sideways, as that is the purpose of double combinations.
While double combinations are very common, triples are extremely rare. I have found no examples of triple combinations for Gold at daily chart time frames or higher back to 1976. When the second structure in a double is complete, then it is extremely likely (almost certain) that the whole correction is over.
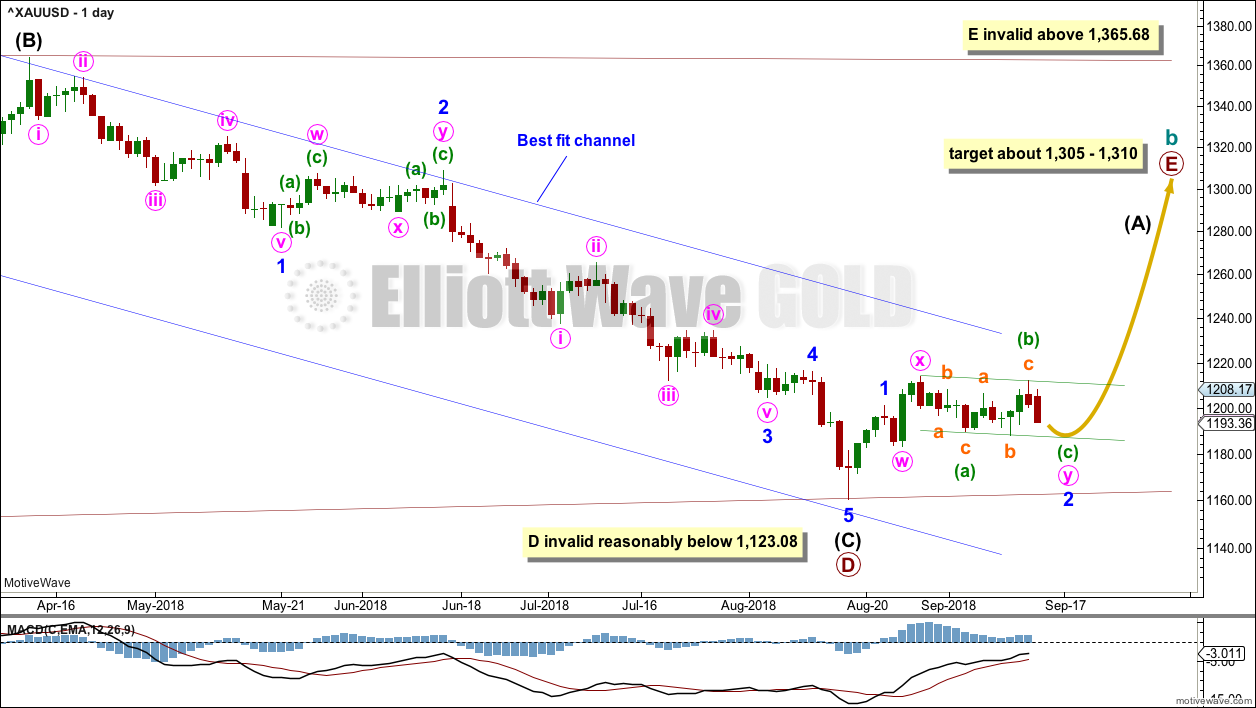
DAILY CHART – COMBINATION
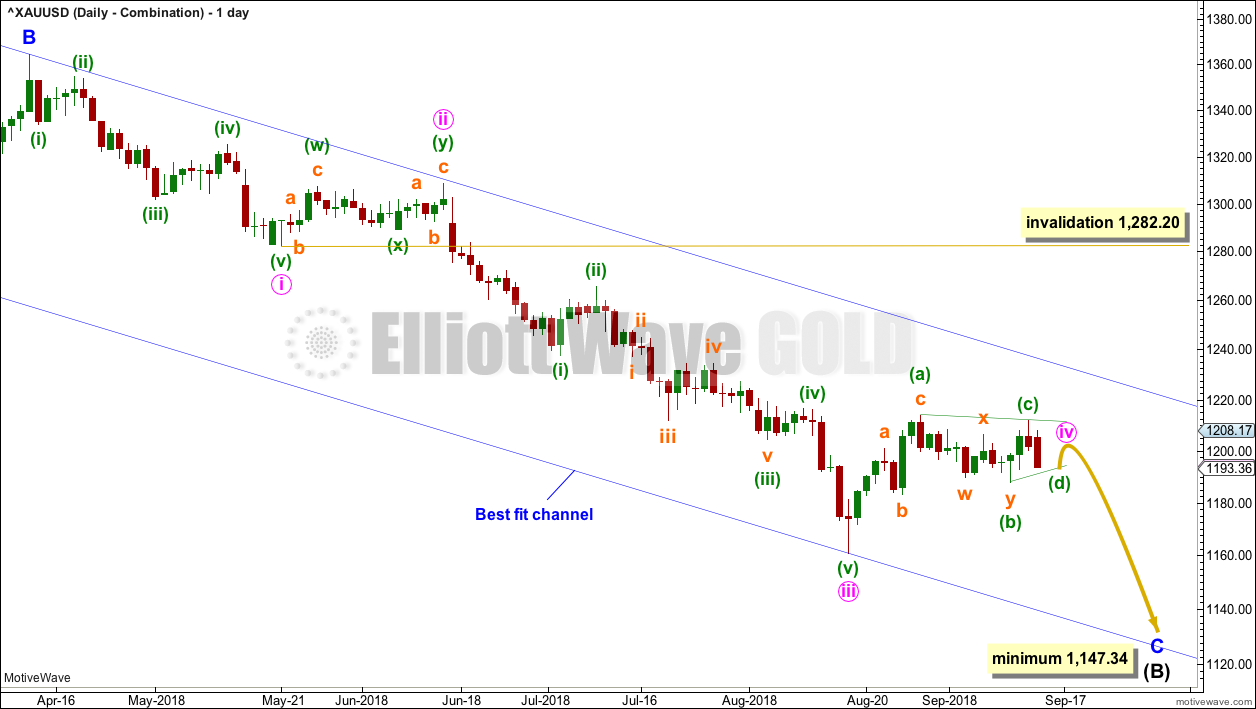
Click chart to enlarge.
Intermediate wave (B) may be unfolding lower as either a single or double zigzag. At this stage, a single zigzag will be considered; the expected direction nor minimum requirement at 1,147.34 do not differ from a double zigzag.
If intermediate wave (B) is unfolding as a single zigzag, then within it minor wave C must subdivide as a five wave impulse.
It now looks most likely that minute wave iv may be continuing sideways as a triangle, although this may morph into a double combination. When a complete structure can be seen for minute wave iv, then a downwards breakout to new lows would be expected. When minute wave iv may again be seen as complete, then a target may be calculated for minute wave v to end.
WEEKLY CHART – TRIANGLE
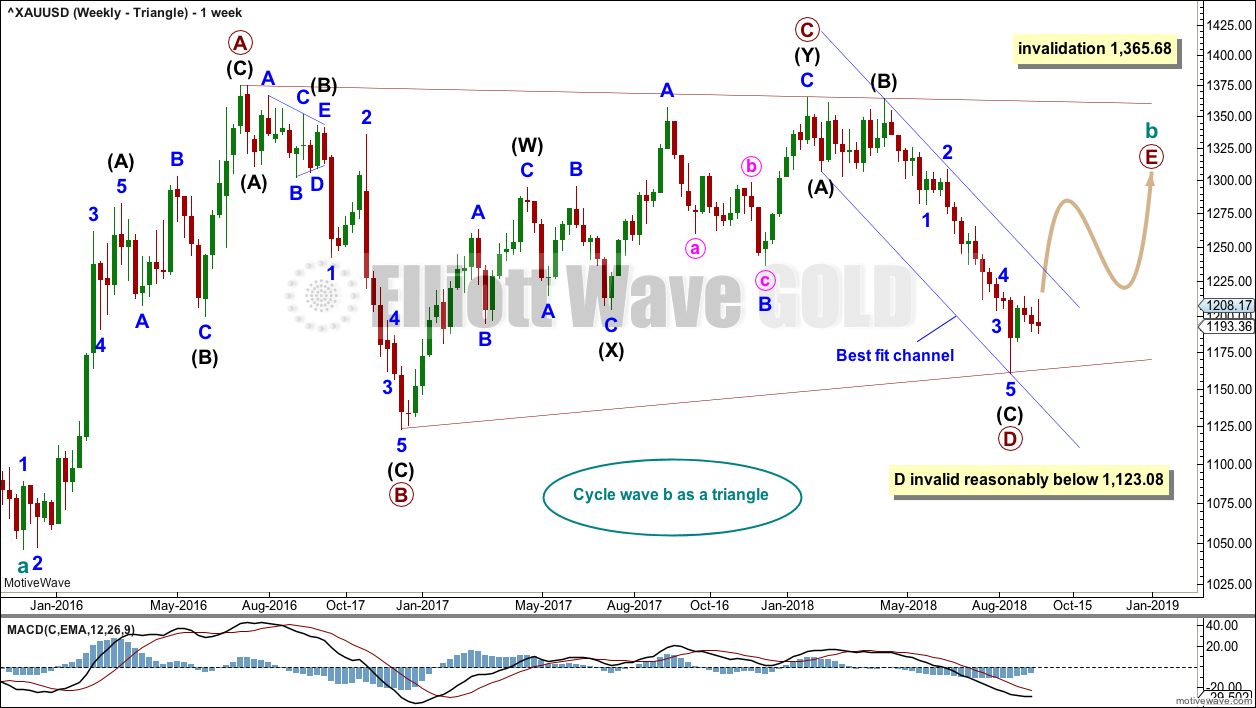
Click chart to enlarge.
The triangle so far has the best fit and look, but at this stage it no longer has good support from classic technical analysis. It is now judged to have a slightly lower probability than the combination wave count.
Cycle wave b may be an incomplete triangle. The triangle may be a contracting or barrier triangle, with a contracting triangle looking much more likely because the A-C trend line does not have a strong slope. A contracting triangle could see the B-D trend line have a stronger slope, so that the triangle trend lines converge at a reasonable rate. A barrier triangle would have a B-D trend line that would be essentially flat, and the triangle trend lines would barely converge.
Within a contracting triangle, primary wave D may not move beyond the end of primary wave B below 1,123.08. Within a barrier triangle, primary wave D may end about the same level as primary wave B at 1,123.08, so that the B-D trend line is essentially flat. Only a new low reasonably below 1,123.08 would invalidate the triangle.
Within both a contracting and barrier triangle, primary wave E may not move beyond the end of primary wave C above 1,365.68.
Four of the five sub-waves of a triangle must be zigzags, with only one sub-wave allowed to be a multiple zigzag. Primary wave C is the most common sub-wave to subdivide as a multiple, and this is how primary wave C for this example fits best.
Primary wave D must be a single structure, most likely a zigzag.
There are no problems in terms of subdivisions or rare structures for this wave count. It has an excellent fit and so far a typical look.
A channel is drawn on all charts about the downwards wave of primary wave D. Here, it is labelled a best fit channel. If this channel is breached by upwards movement, that may provide reasonable confidence in this weekly triangle wave count and the double zigzag count, and put serious doubt on the combination and flat wave counts.
This wave count now expects a consolidation for primary wave E to back test resistance at prior support, and then a significant new downwards wave for cycle wave C. For the long term, this is the most bearish wave count.
DAILY CHART – TRIANGLE
Click chart to enlarge.
Primary wave D may again be complete. For Barchart data, there is a Morning Doji Star candlestick reversal pattern at the low.
For confidence, this wave count now requires a breach of the upper edge of the blue best fit channel. This channel is drawn the same way on all weekly and daily charts, all on a semi-log scale.
Minor wave 1 may have been over on the 22nd of August.
Minor wave 2 may be an incomplete double combination: zigzag – X – flat. Minute wave y may be an incomplete regular flat correction. Regular flats usually fit neatly into a trend channel, which is drawn about minute wave y here on the daily chart.
A target for primary wave E is the strong zone of resistance about 1,305 to 1,310. Primary wave E is most likely to subdivide as a zigzag (although it may also subdivide as a triangle to create a rare nine wave triangle), and it should last at least a Fibonacci 13 weeks. Primary wave E may not move beyond the end of primary wave C above 1,365.68.
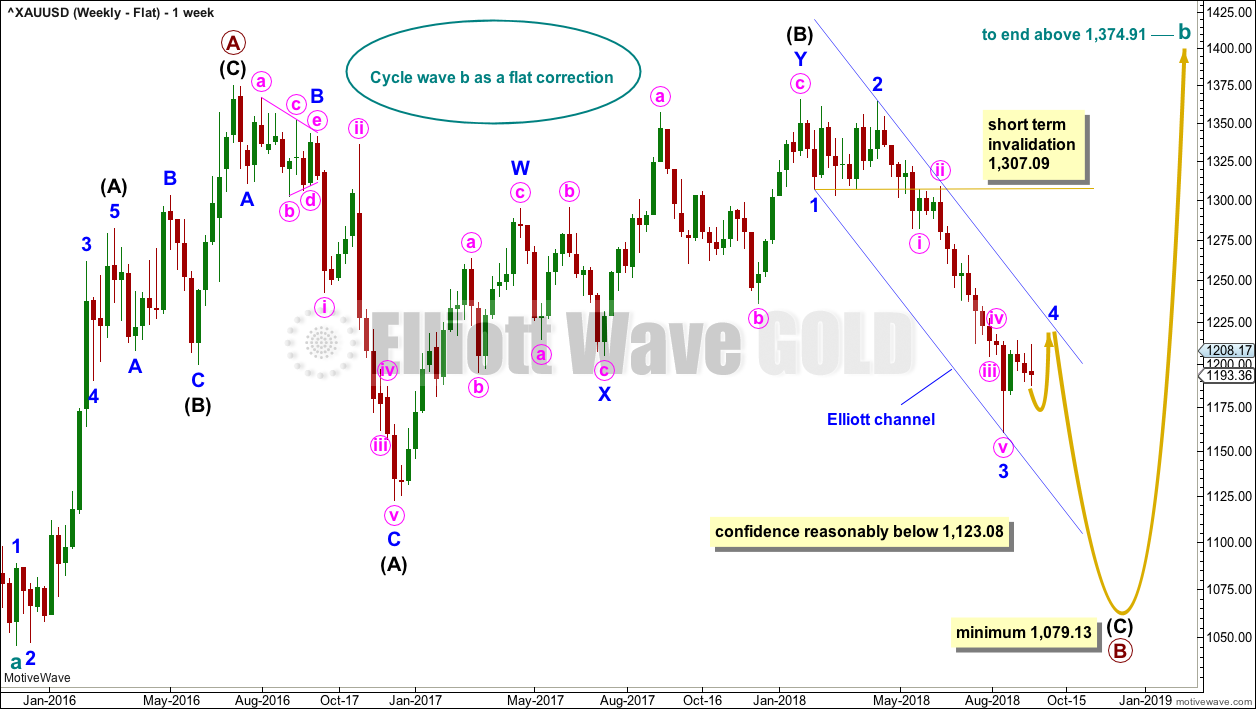
WEEKLY CHART – FLAT
Click chart to enlarge.
It is possible that cycle wave b may be a flat correction. Within a flat correction, primary wave B must retrace a minimum 0.9 length of primary wave A at 1,079.13 or below. Primary wave B may make a new low below the start of primary wave A at 1,046.27 as in an expanded flat correction.
Only a new low reasonably below 1,123.08 would provide reasonable confidence in this wave count.
Intermediate wave (C) must subdivide as a five wave structure; it may be unfolding as an impulse. Within intermediate wave (C), minor waves 1, 2 and now 3 may be complete. A consolidation to last about 5 to 13 weeks may now continue sideways for minor wave 4. Minor wave 4 may not move into minor wave 1 price territory above 1,307.09.
This wave count differs from the triangle wave count in that it expects a possibly more brief and more shallow correction to unfold here.
The blue channel here is drawn using Elliott’s first technique. Minor wave 4 would be most likely to remain contained within this channel, and may find resistance about the upper edge if it gets there. A strong breach of this channel by upwards movement would reduce the probability of this wave count.
Minor wave 2 was a double zigzag lasting nine weeks. To exhibit alternation and reasonable proportion minor wave 4 may be a flat, combination or triangle and may last a little longer than nine weeks as these types of corrections can be longer lasting than zigzags or zigzag multiples.
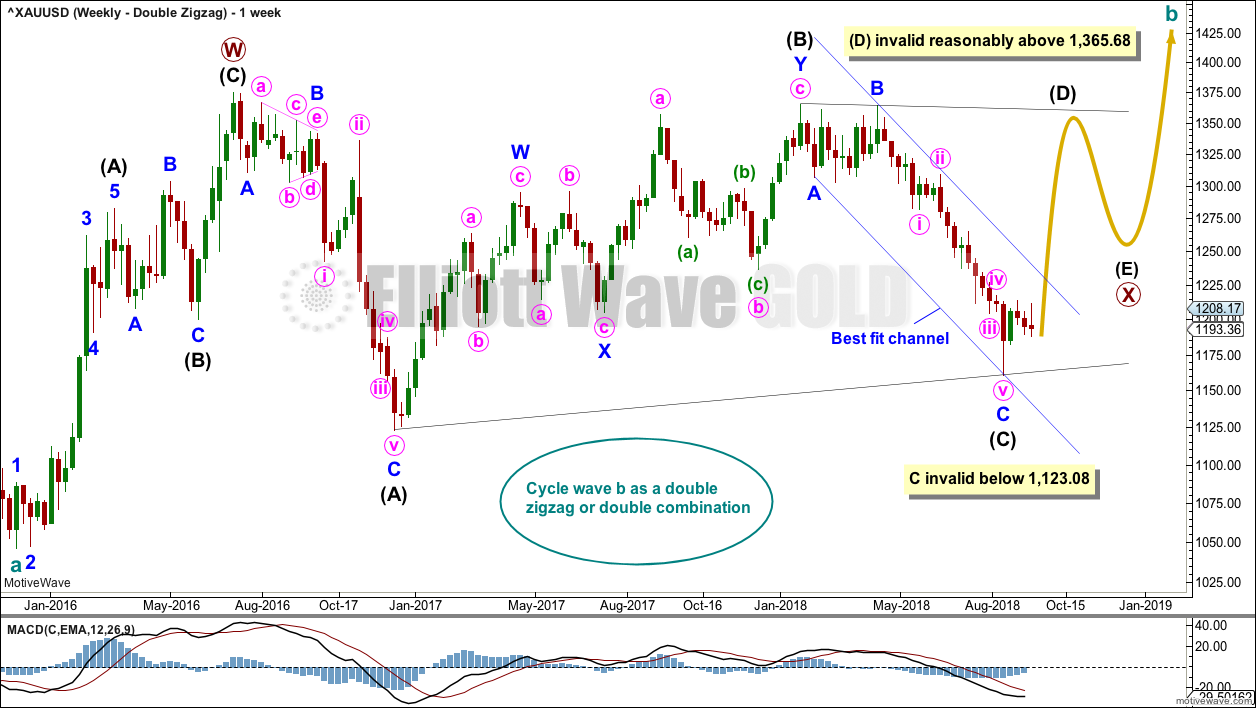
WEEKLY CHART – DOUBLE ZIGZAG
Click chart to enlarge.
Finally, it is also possible that cycle wave b may be a double zigzag or a double combination.
The first zigzag in the double is labelled primary wave W. This has a good fit.
The double may be joined by a corrective structure in the opposite direction, a triangle labelled primary wave X. The triangle would be about two thirds complete.
Within the triangle of primary wave X, intermediate wave (C) may now be complete. It may not move beyond the end of intermediate wave (A) below 1,123.08. The A-C trend line for both a barrier and contracting triangle should have some reasonable slope. For the triangle of primary wave X to have the right look, intermediate wave (C) should end here or very soon indeed.
This wave count may now expect choppy overlapping movement in an ever decreasing range for several more months. After the triangle is complete, then an upwards breakout would be expected from it.
Primary wave Y would most likely be a zigzag because primary wave X would be shallow; double zigzags normally have relatively shallow X waves.
Primary wave Y may also be a flat correction if cycle wave b is a double combination, but combinations normally have deep X waves. This would be less likely.
This wave count has good proportions and no problems in terms of subdivisions.
TECHNICAL ANALYSIS
WEEKLY CHART
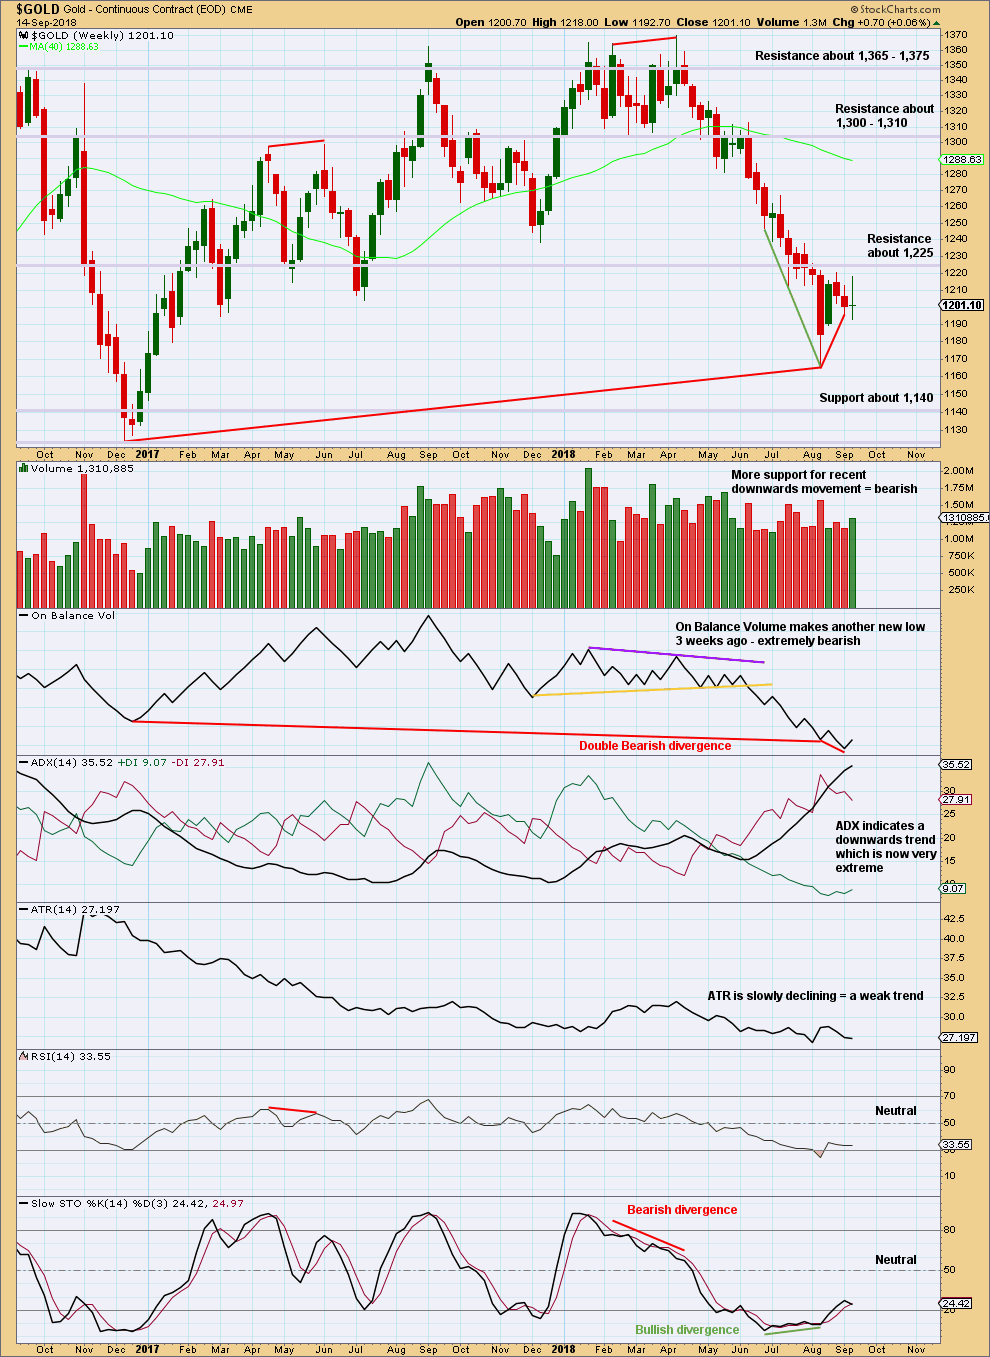
Click chart to enlarge. Chart courtesy of StockCharts.com.
On Balance Volume is lower than its prior point at the end of November 2015. This divergence is extremely bearish but does not rule out a consolidation unfolding here; the divergence does strongly support the Triangle wave count, which expects a consolidation or bounce up to test resistance now and then a continuation of a major bear market. It could also support the flat wave count that allows for a new low below 1,046.27 in coming months.
On Balance Volume has made another new low, but price has not. There is now double bearish divergence between price and On Balance Volume.
When Gold has a strong trend, ADX may remain very extreme for long periods of time and RSI can move more deeply into oversold. However, most recent lows since November 2015 were all found when RSI just reached oversold, so some caution here in looking out for a possible consolidation or trend change would be reasonable.
This week completes an outside week with the balance of volume upwards. Upwards movement within the week has support from volume. The long legged doji candlestick represents indecision; this is typical during a consolidation.
If price does continue lower, then look for next support about 1,140.
DAILY CHART
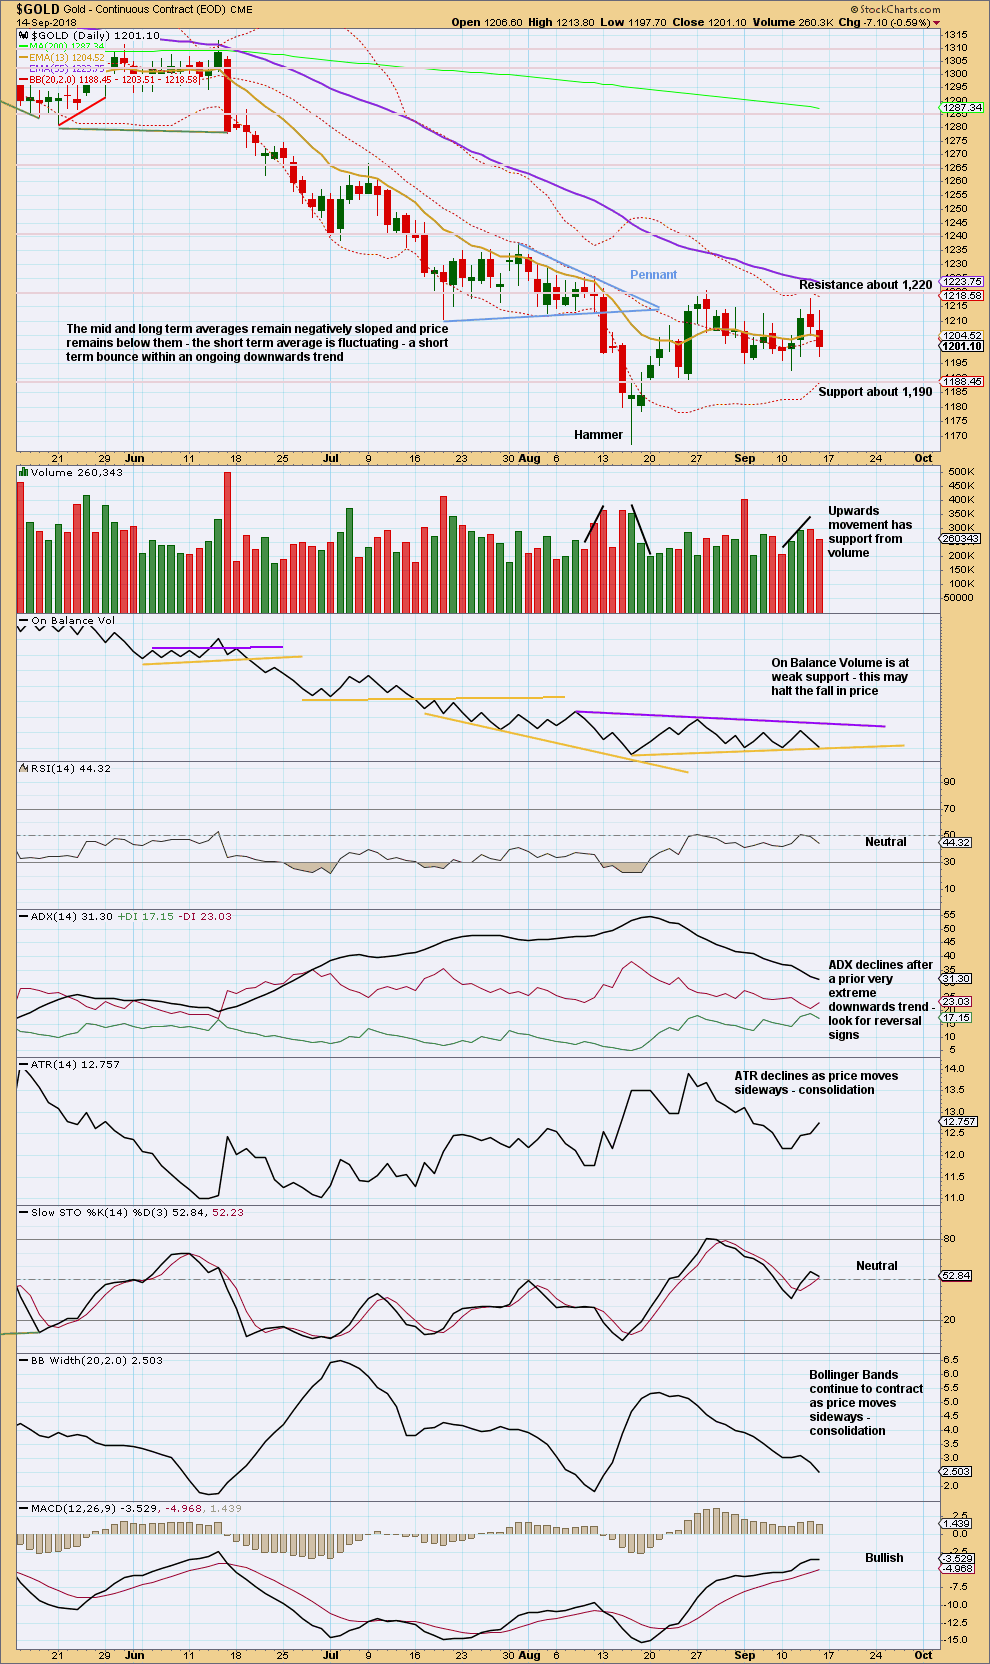
Click chart to enlarge. Chart courtesy of StockCharts.com.
Gold is now range bound. Resistance and support are identified on the chart. It is a downwards day that has strongest volume during this small range bound movement so far, suggesting a downwards breakout may be more likely than upwards. This technique does not always work, but it does work more often than it fails.
On Balance Volume is also range bound, and the trend lines are converging. On Balance Volume will give a signal; if it does so prior to price breaking out, then a direction would be indicated.
The downwards swing may end here: On Balance Volume is at support, and volume is declining.
GDX WEEKLY CHART
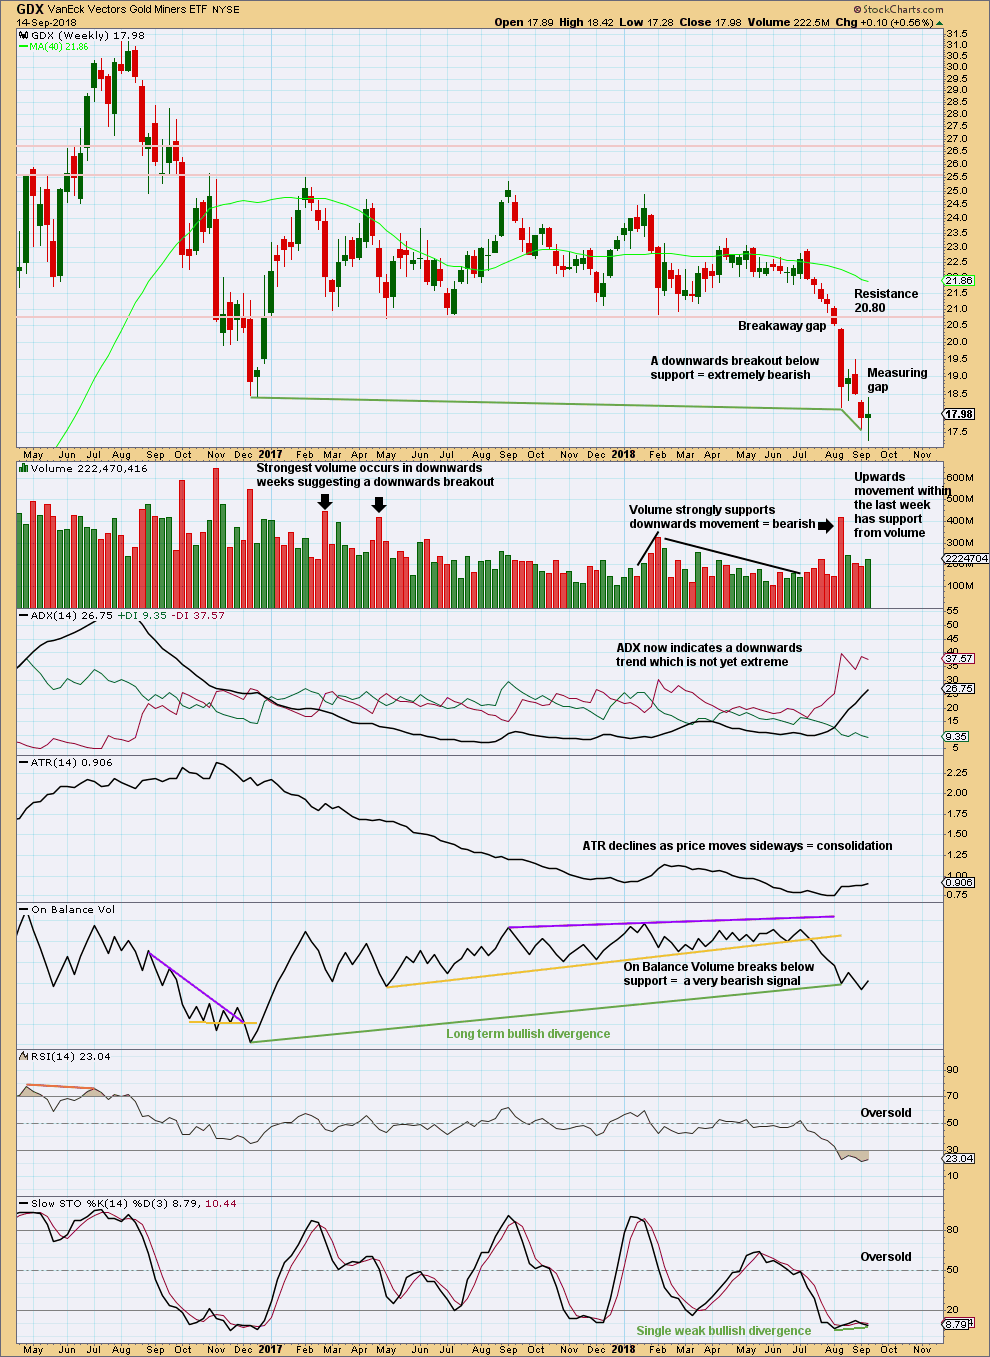
Click chart to enlarge. Chart courtesy of StockCharts.com.
GDX is now moving lower exactly as expected.
After a breakout, a technical principle is the longer that price consolidates sideways the longer the resulting trend may be expected to be. Also, the longer that price meanders sideways the more energy may be released after a breakout. This is what is happening now for GDX.
A target for this downwards trend to end calculated using the measured rule is at 16.02. That is not yet met. The last gap lower was used to calculate a new target at 17.37 for the short term, which has been met. The gap remains open and so far is providing resistance.
At the weekly chart level, there is a clear downwards breakout with a breakaway gap. As breakaway gaps should not be closed, they may be used to set stops that may be set just above a downwards breakaway gap.
The bullish divergence between price and On Balance Volume noted with green trend lines is also not a strong signal. On Balance Volume is a leading indicator; when it leads, it offers a signal, but it does not always lead price.
There is short term bullish divergence between price and Stochastics. A consolidation may develop here to relieve extreme conditions.
An outside week closes green with the balance of volume upwards. The consolidation has some support from volume at this stage. A long legged doji is typical during a consolidation.
GDX DAILY CHART
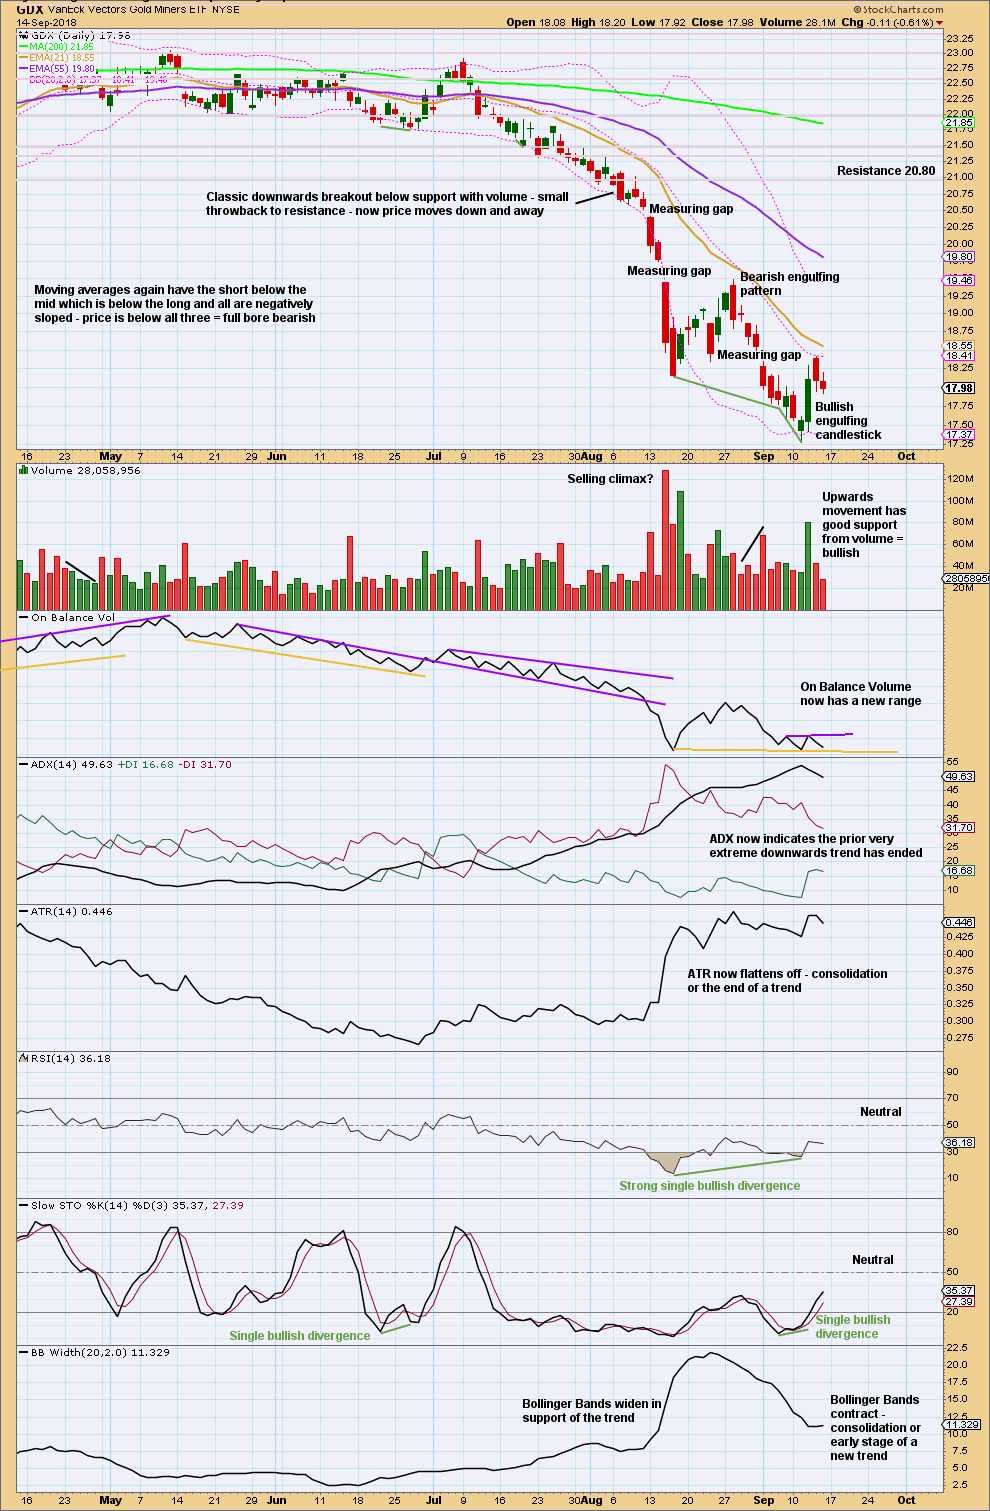
Click chart to enlarge. Chart courtesy of StockCharts.com.
GDX has now closed below support on a strong downwards day with support from volume. New lows are the lowest for GDX since December 2016. This is extremely significant for GDX.
GDX is in a downwards trend. Bounces and consolidations may be used as opportunities to join the trend.
The measuring gap at 19.74 – 19.45 provided resistance, this may continue to provide resistance for any future bounces or consolidations.
If the last measuring gap is closed, then it may be relabelled an exhaustion gap. It remains just open. Then look for resistance next at 19.74. If resistance here is overcome, then a much deeper and longer lasting bounce may take price back up to very strong resistance at 20.80. If that happens, use it as an opportunity for another short entry; it may be a typical throwback to resistance after the strong downwards breakout.
US OIL
On Balance Volume gives a weak signal this week that slightly favours one Elliott wave count over the other.
Overall, the larger trend remains the same.
Summary: The Elliott wave structure for intermediate wave (4) does not look complete. It may continue sideways now for another 5 weeks.
The triangle wave count now has a little support from a weak bullish signal from On Balance Volume.
For the short term, it looks like some upwards movement may continue next week. The target is at 73.82. If price reaches up to 74.18, then it is possible it may make a new high above 75.26 as part of this consolidation, before turning for a final downwards swing.
An overshoot of resistance may occur before the upwards swing ends and a new downwards swing begins.
The larger trend remains upwards, so pullbacks may be used as opportunities to join the trend. If another downwards swing reaches support in the next few weeks, that may be the last opportunity for a very good entry point for a long position.
MAIN WAVE COUNT
MONTHLY CHART
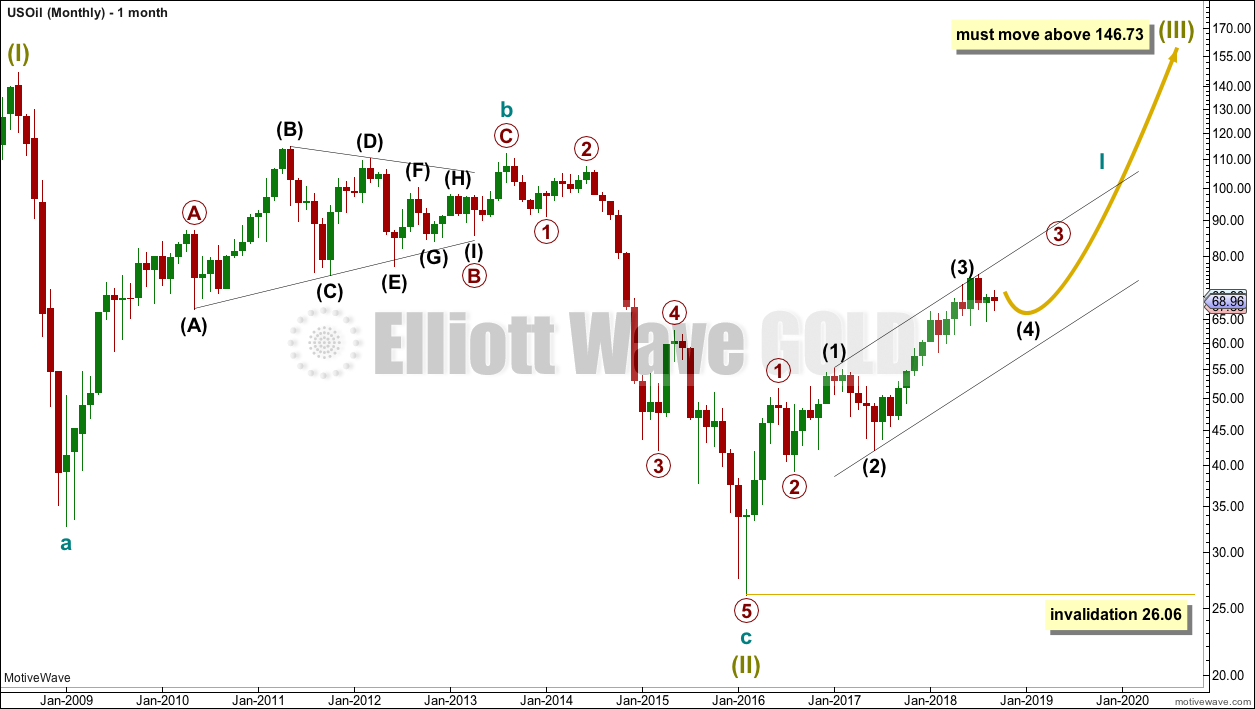
Click chart to enlarge.
The bear market for US Oil looks to be over and a new bull market looks to be in its early stages. The prior bearish wave count has been invalidated, leaving only this very bullish wave count.
A huge zigzag down to the last low may be complete and is labelled here Super Cycle wave (II).
Cycle wave b must be seen as complete in August 2013 for this wave count to work. It cannot be seen as complete at the prior major swing high in May 2011.
Cycle wave b is seen as a zigzag, and within it primary wave B is seen as a running contracting triangle. These are fairly common structures, although nine wave triangles are uncommon. All subdivisions fit.
Primary wave C moves beyond the end of primary wave A, so it avoids a truncation. But it does not have to move above the price territory of primary wave B to avoid a truncation, which is an important distinction.
If cycle wave b begins there, then cycle wave c may be seen as a complete five wave impulse.
Super Cycle wave (III) must move beyond the end of Super Cycle wave (I). It must move far enough above that point to allow room for a subsequent Super Cycle wave (IV) to unfold and remain above Super Cycle wave (I) price territory.
Cycle wave I may be incomplete. It may be unfolding as an impulse and may have now moved through the middle portion. Commodities have a tendency to exhibit swift strong fifth waves, and this tendency is especially prevalent for third wave impulses. Intermediate wave (5) to end primary wave 3 may be very swift and strong, ending with a blow off top.
When cycle wave I is complete, then cycle wave II may be a deep correction that may not move beyond the start of cycle wave I below 26.06.
Data from FXCM for USOil does not go back to the beginning of Super Cycle wave (I). Without an accurate known length of Super Cycle wave (I) a target cannot be calculated for Super Cycle wave (III) to end using Fibonacci ratios. The target for Super Cycle wave (III) may be calculated when cycle waves I, II, III and IV within it are complete. That cannot be done for many years.
WEEKLY CHART
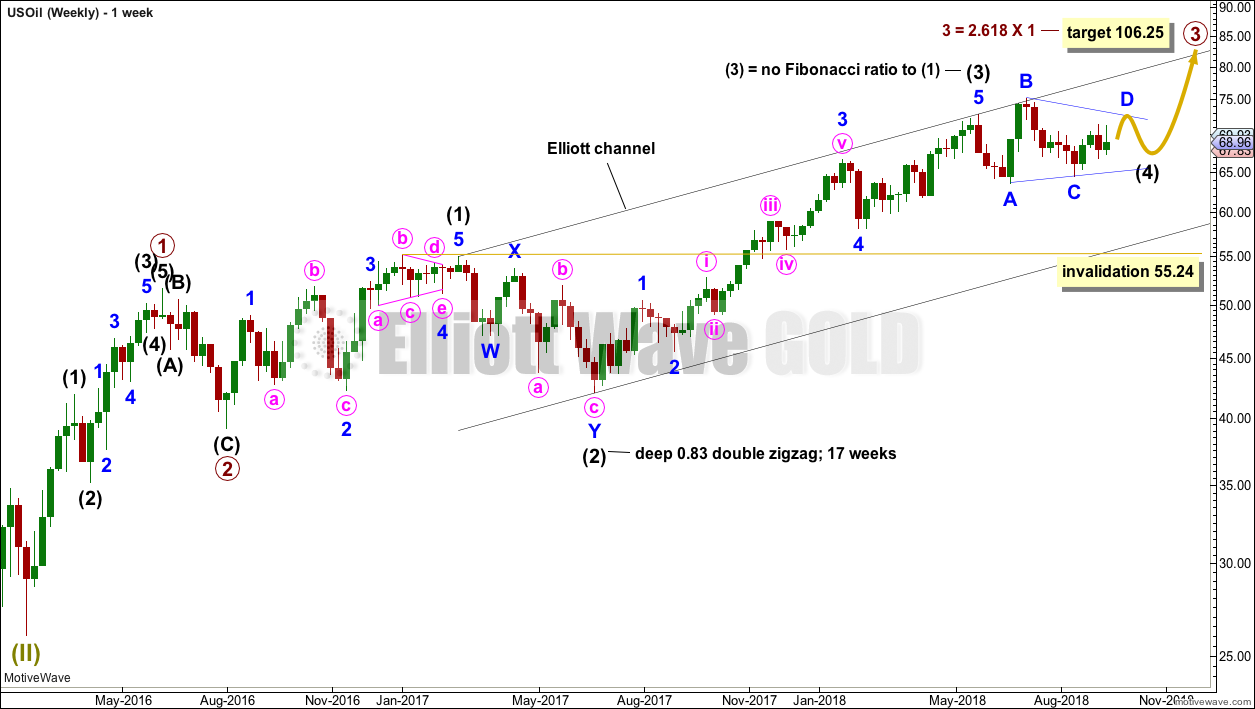
Click chart to enlarge.
Intermediate wave (3) may now be complete. There is no Fibonacci ratio between intermediate waves (1) and (3), and intermediate wave (3) is longer than 1.618 the length of intermediate wave (1).
This wave count fits with classic technical analysis at the monthly and daily chart levels.
Intermediate wave (2) was a deep double zigzag. Given the guideline of alternation, intermediate wave (4) may be expected to most likely be a shallow flat, triangle or combination. It may be about even in duration with intermediate wave (2), or it may be a little longer because triangles and combinations are more time consuming structures.
Intermediate wave (4) has now lasted 16 weeks. At the daily chart level, at this stage, I cannot see it as a complete corrective structure. The next expectation will now be for it to possibly complete in a further 5 weeks to total a Fibonacci 21. It may not exhibit a Fibonacci duration though (this is a rough guideline only).
Intermediate wave (4) may find support about the lower edge of the black Elliott channel. It may end within the price territory of the fourth wave of one lesser degree; minor wave 4 has its territory from 66.65 to 59.13.
At this stage, only two structural options fit for intermediate wave (4) at the daily chart level: a triangle and a combination. They are both equally valid and have about an even probability.
Because the last wave down to support, ending on the 16th of August, now looks like a complete structure and will only subdivide as a three, it cannot be wave C of a flat correction. For this reason, a flat correction at this time does not fit and has been discarded.
TRIANGLE
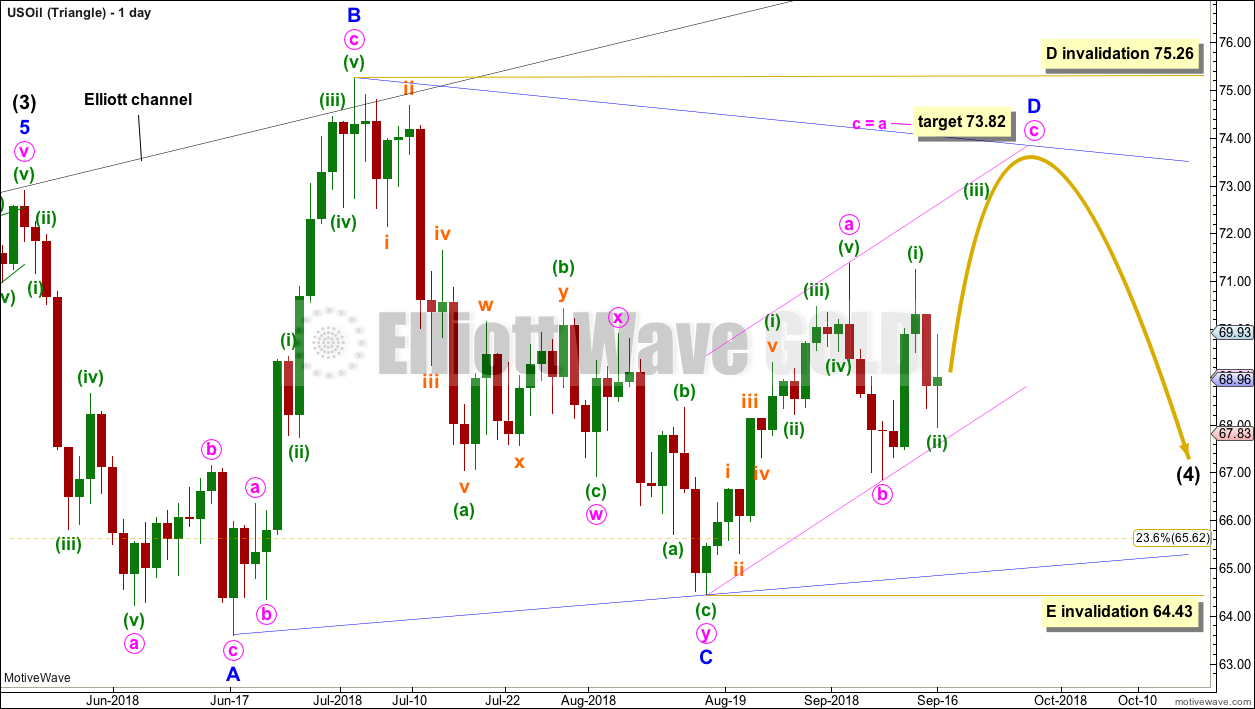
Click chart to enlarge.
Intermediate wave (4) may be unfolding as a triangle.
Minor wave A is seen as a single zigzag, which has a reasonable look. Minor wave B is also seen as a single zigzag.
Minor wave C may have been a complete double zigzag, which has a very good fit. C waves are the most common triangle sub-waves to subdivide as a multiple, so this labelling fits with a common pattern.
Minor wave D is an incomplete zigzag. A target is calculated for minor wave D to end.
Within the zigzag of minor wave D, minute wave c must subdivide as a five wave impulse. So far only minuette waves (i) and (ii) may be complete. While minor wave D continues, pullbacks may find support about the lower edge of the small channel containing it.
Minor wave D within a contracting triangle may not move beyond the end of minor wave B above 75.26. The A-C trend line has a shallow slope, so the upper B-D trend line should have a reasonable slope for the triangle trend lines to have a reasonable rate of convergence. A contracting triangle would have a sloping B-D trend line, so this looks most likely.
Minor wave D within a barrier triangle may end about the same level as minor wave B at about 75.26, so that the B-D trend line is essentially flat. A barrier triangle here would not produce triangle trend lines that converge at a reasonable rate. This would not have the right look. A barrier triangle looks unlikely.
When minor wave D is a complete zigzag, then a final zigzag down for minor wave E would most likely end reasonably short of the A-C trend line. Minor wave E may not move beyond the end of minor wave C below 64.43.
COMBINATION
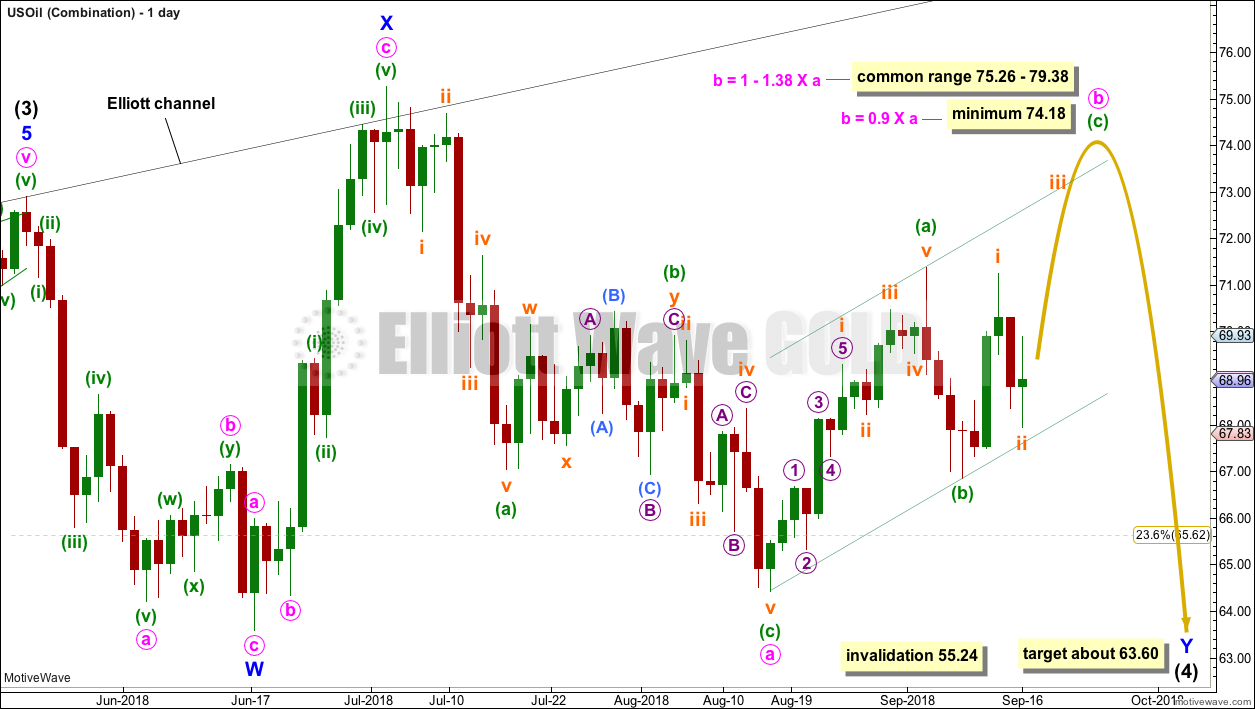
Click chart to enlarge.
Intermediate wave (4) may be unfolding as a double combination.
The first structure in a double combination may be a complete zigzag labelled minor wave W. There is a little disproportion within minute wave a between the corrections of minuette waves (ii) and (iv), but this is slight enough to be acceptable for this market.
The double is joined by a complete three in the opposite direction, a zigzag labelled minor wave X. X waves within combinations have no minimum nor maximum allowable length, and may make new price extremes beyond the start of wave W as this one does. The only guideline in terms of depth for X waves is that they are normally very deep.
The second structure in a double combination would most likely be a flat correction as the two most common structures in a double combination are one zigzag and one flat.
Within a possible flat correction for minor wave Y, minute wave a looks like a completed three. Minute wave b must now retrace a minimum 0.9 length of minute wave a, and it may move beyond the start of minute wave a as in an expanded flat. Minute wave b should exhibit clear weakness, should exhibit lack of support from volume, and at its end should exhibit some divergence between price and either or both of Stochastics and RSI.
Minute wave b may be subdividing as a single zigzag. Within the zigzag, minuette wave (c) must complete as a five wave structure. While minute wave b continues to move higher, downwards pullbacks may find support about the lower edge of the small channel drawn about it.
When minute wave b is complete, then minute wave c would need to end at least slightly below the end of minute wave a at 64.43 to avoid a truncation.
The purpose of the second structure in a double combination is to take up time and move price sideways. To achieve this purpose minor wave Y would be most likely to end about the same level as minor wave W about 63.60.
TECHNICAL ANALYSIS
MONTHLY CHART
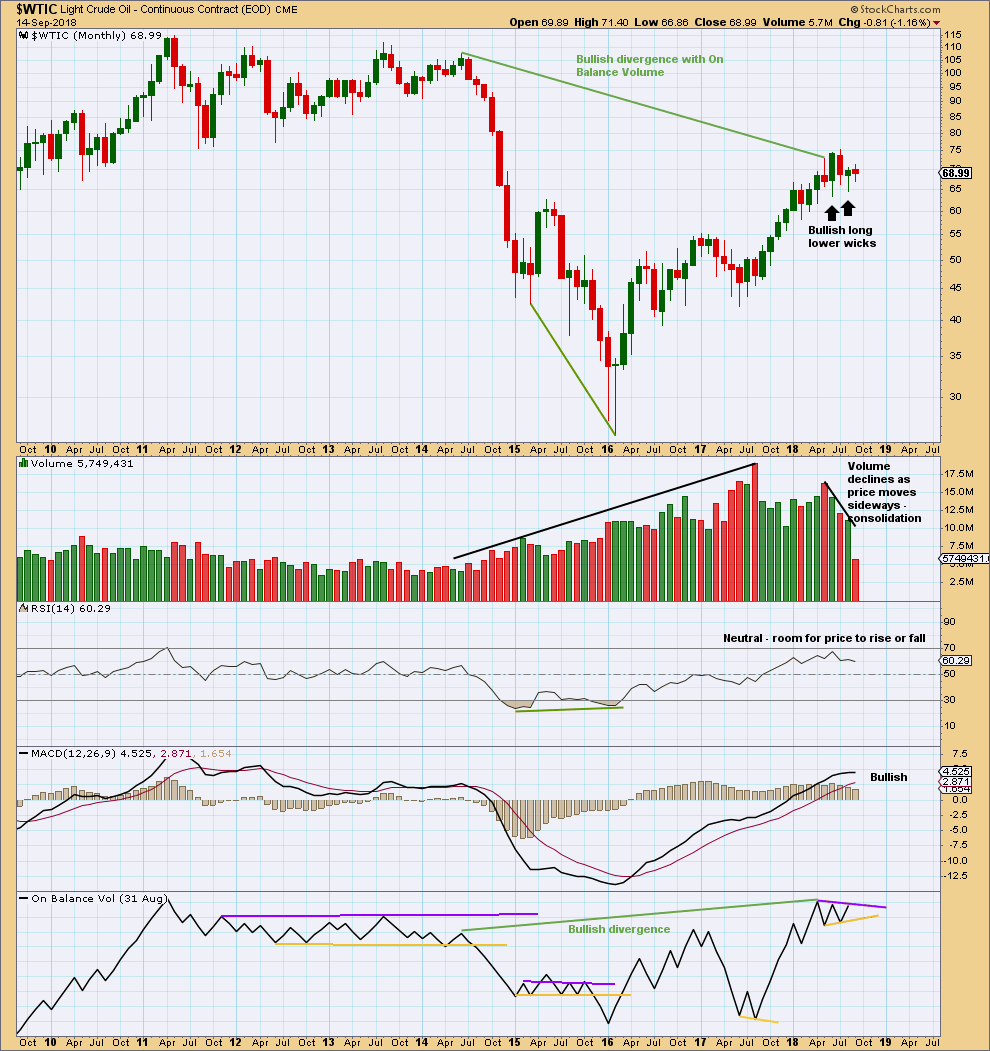
Click chart to enlarge. Chart courtesy of StockCharts.com.
The short term volume profile is bearish: the strongest month in the last few months was the downwards month of May (where the balance of volume was down) and now June shows a decline in volume, so volume has not supported upwards movement here.
July saw another red monthly candlestick with the balance of volume downwards, but the market fell of its own weight; it was not supported by volume. This is not necessarily bullish, but it does point to a consolidation as somewhat more likely here.
August saw more downwards movement, but the balance of volume was upwards and the candlestick closed green with a long lower wick. This looks like a consolidation within an ongoing upwards trend.
A new range is outlined for On Balance Volume. A breakout here would provide a weak signal. With On Balance Volume at resistance, a downwards month for September looks likely.
The larger trend is upwards.
WEEKLY CHART
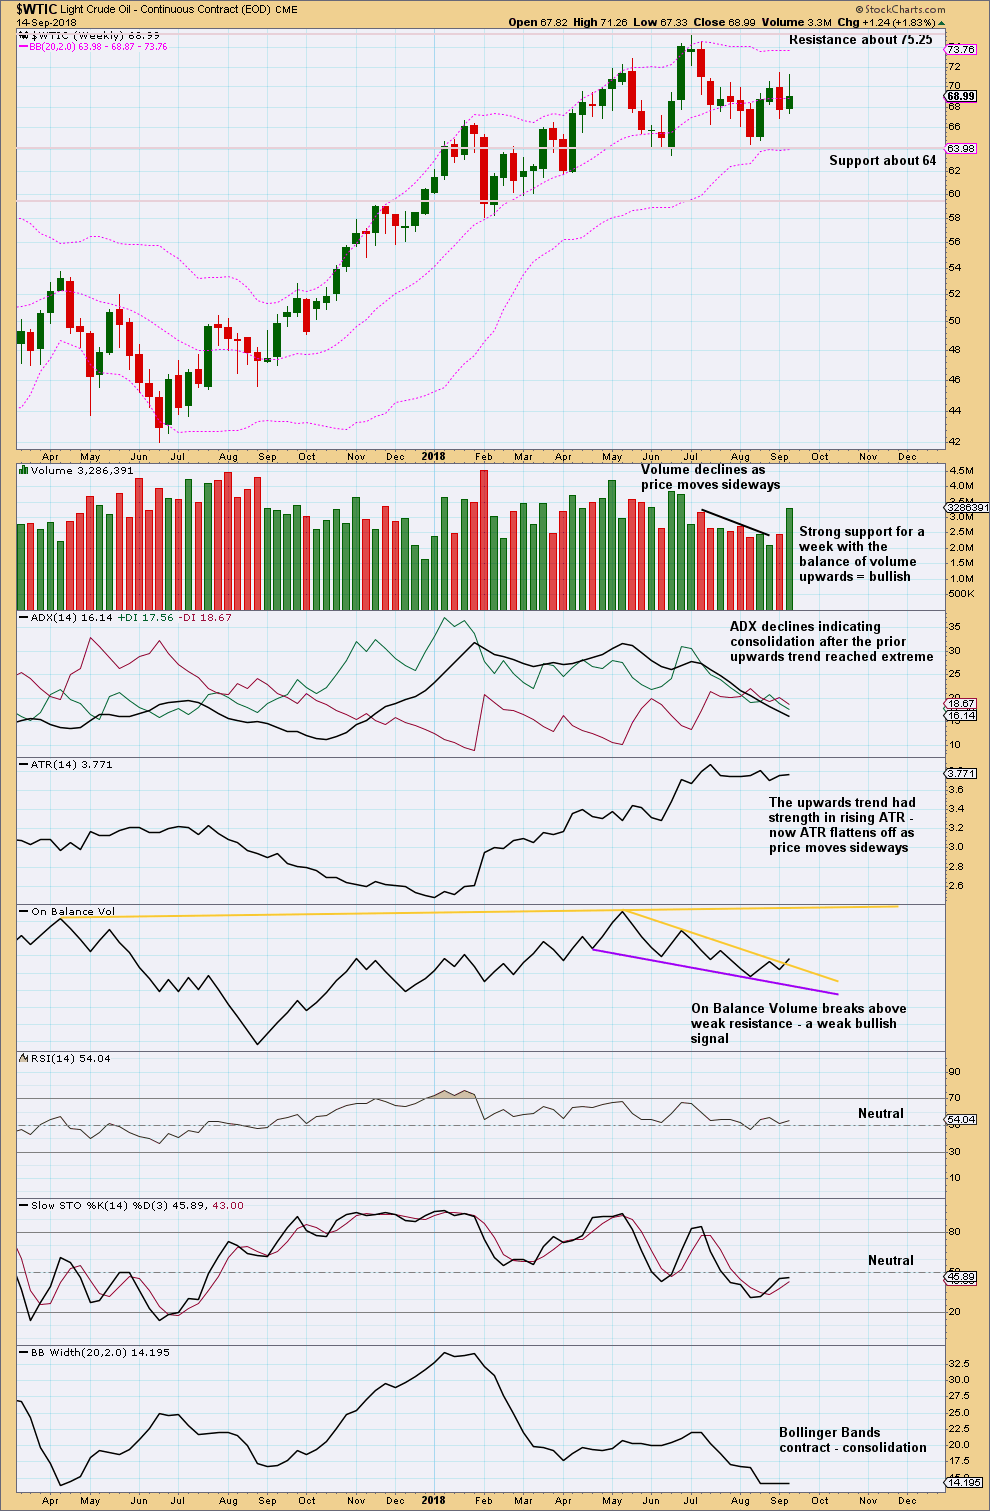
Click chart to enlarge. Chart courtesy of StockCharts.com.
An inside week closes green with the balance of volume upwards. Strong support from volume for upwards movement this week looks bullish.
It is upwards weeks during the consolidation that have strongest support from volume. This looks like a continuation pattern. The breakout would most likely be upwards.
The signal from On Balance Volume is weak because the line breached has a reasonable slope. This may favour the triangle Elliott wave count, because it supports the idea of a little more sideways movement to be followed by an upwards breakout, whereas the combination wave count requires a deep downwards swing to complete the consolidation.
Pullbacks may be used as an opportunity to join the upwards trend.
DAILY CHART
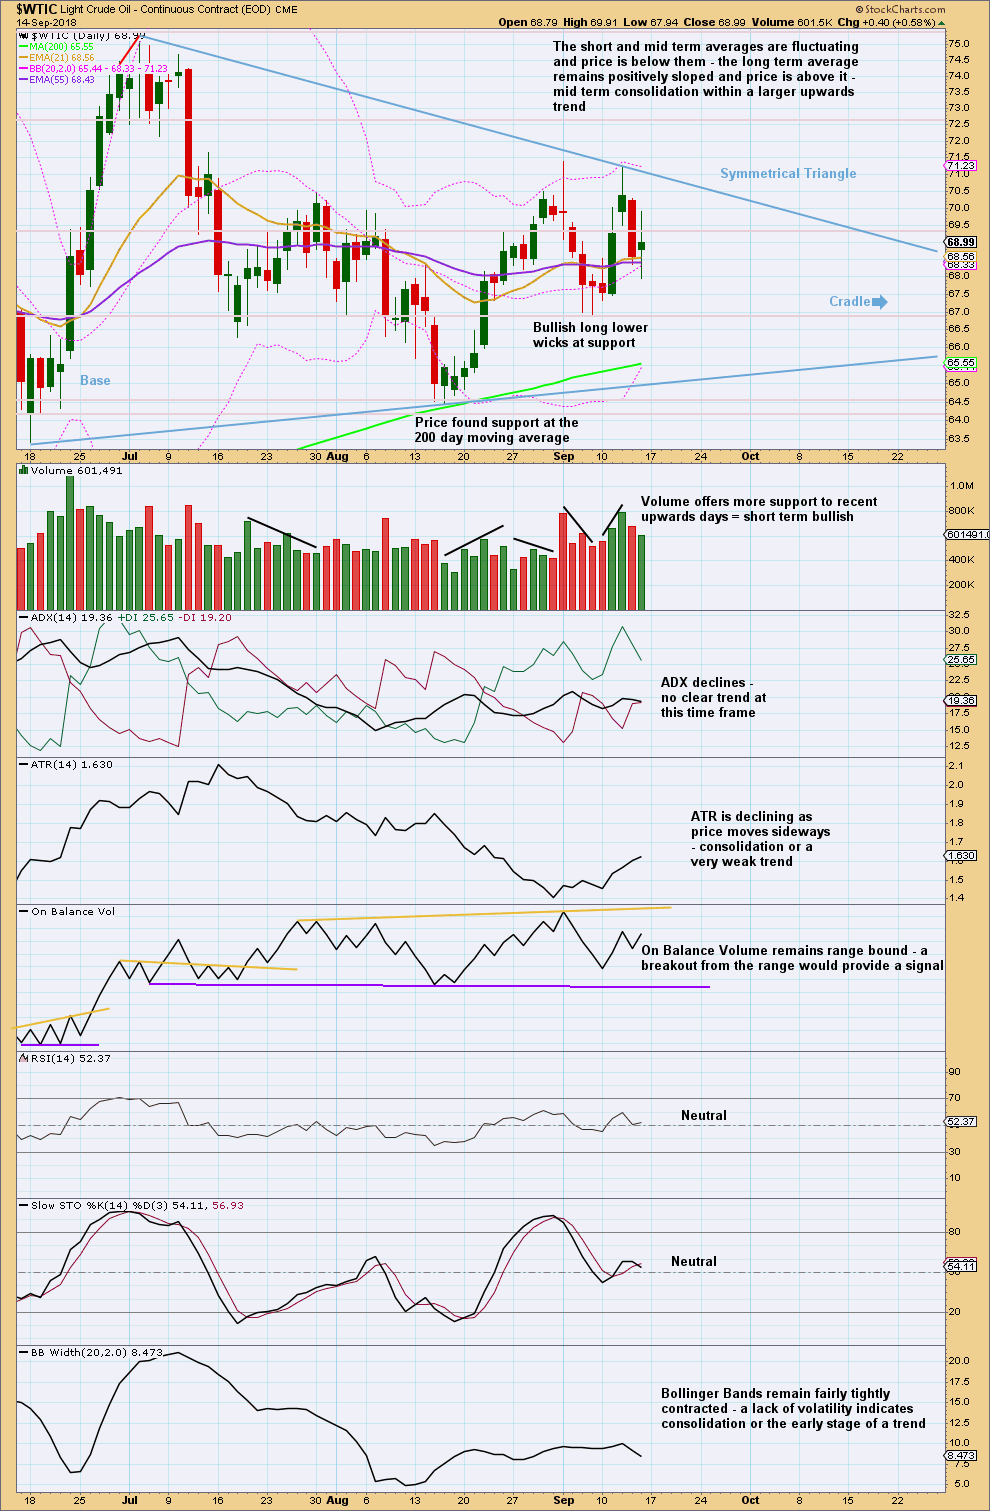
Click chart to enlarge. Chart courtesy of StockCharts.com.
A symmetrical triangle may be forming. The upper resistance line is slightly adjusted this week.
With adjusted trend lines this week, a breakout may occur between 73-75% of the length of the triangle from base to cradle. This would be another 25 to 30 sessions.
For the short term, it looks like some upwards movement may continue next week; if it does, then the symmetrical triangle may no longer be valid.
—
Always practice good risk management as the most important aspect of trading. Always trade with stops and invest only 1-5% of equity on any one trade. Failure to manage risk is the most common mistake new traders make.