
More upwards movement was expected for the last week. The short term target was at 73.82. Price did move higher to reach 73.72 so far.
Summary: A multi month consolidation may come to an end in the next one to three weeks.
If price turns and moves lower for a final downwards swing without first reaching 74.18, then an Elliott wave triangle would be indicated. Look for the final downwards swing to look like a three wave structure and end short of the lower A-C triangle trend line.
If the current upwards swing continues a little higher and reaches 74.18, then it may be a combination; an overshoot of resistance about 75.25 may occur before the upwards swing ends and a final downwards swing begins. If that happens, then look for the downwards swing to end about 63.60.
The larger trend remains upwards, so pullbacks may be used as opportunities to join the trend. If another downwards swing reaches support in the next few weeks, that may be the last opportunity for a very good entry point for a long position.
New updates to this analysis are in bold.
MAIN WAVE COUNT
MONTHLY CHART
Click chart to enlarge.
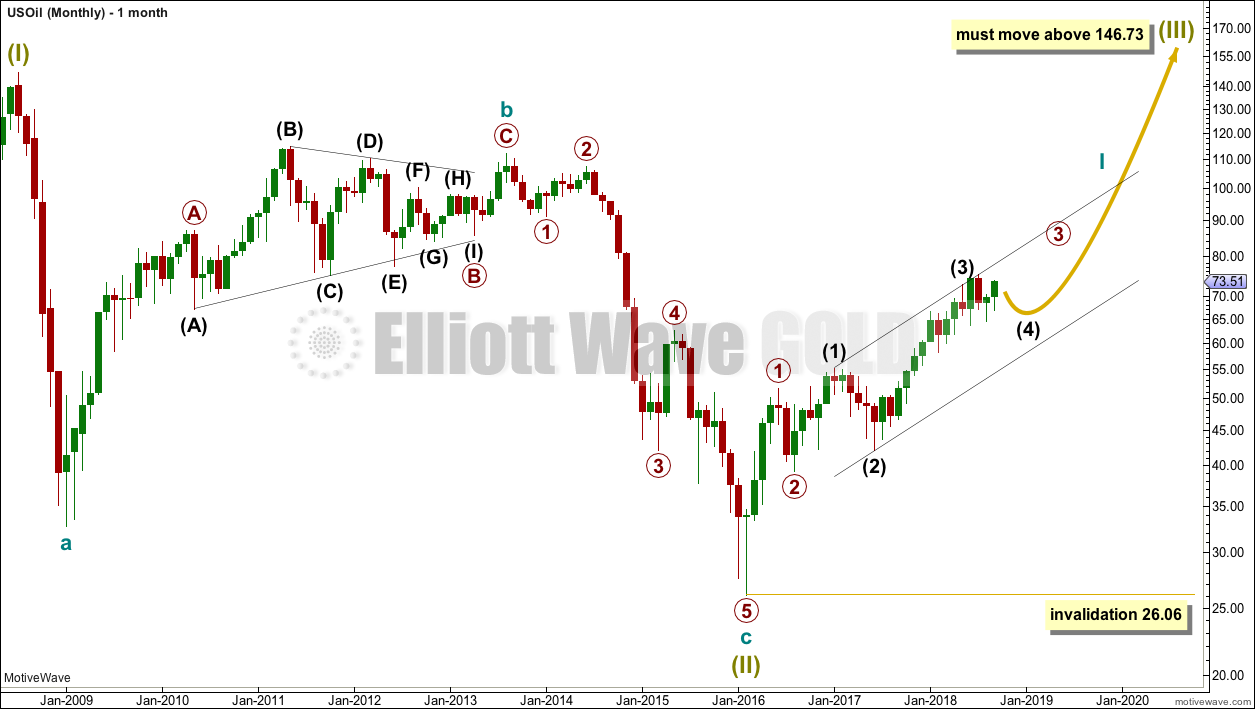
The bear market for US Oil looks to be over and a new bull market looks to be in its early stages. The prior bearish wave count has been invalidated, leaving only this very bullish wave count.
A huge zigzag down to the last low may be complete and is labelled here Super Cycle wave (II).
Cycle wave b must be seen as complete in August 2013 for this wave count to work. It cannot be seen as complete at the prior major swing high in May 2011.
Cycle wave b is seen as a zigzag, and within it primary wave B is seen as a running contracting triangle. These are fairly common structures, although nine wave triangles are uncommon. All subdivisions fit.
Primary wave C moves beyond the end of primary wave A, so it avoids a truncation. But it does not have to move above the price territory of primary wave B to avoid a truncation, which is an important distinction.
If cycle wave b begins there, then cycle wave c may be seen as a complete five wave impulse.
Super Cycle wave (III) must move beyond the end of Super Cycle wave (I). It must move far enough above that point to allow room for a subsequent Super Cycle wave (IV) to unfold and remain above Super Cycle wave (I) price territory.
Cycle wave I may be incomplete. It may be unfolding as an impulse and may have now moved through the middle portion. Commodities have a tendency to exhibit swift strong fifth waves, and this tendency is especially prevalent for third wave impulses. Intermediate wave (5) to end primary wave 3 may be very swift and strong, ending with a blow off top.
When cycle wave I is complete, then cycle wave II may be a deep correction that may not move beyond the start of cycle wave I below 26.06.
Data from FXCM for USOil does not go back to the beginning of Super Cycle wave (I). Without an accurate known length of Super Cycle wave (I) a target cannot be calculated for Super Cycle wave (III) to end using Fibonacci ratios. The target for Super Cycle wave (III) may be calculated when cycle waves I, II, III and IV within it are complete. That cannot be done for many years.
WEEKLY CHART
Click chart to enlarge.
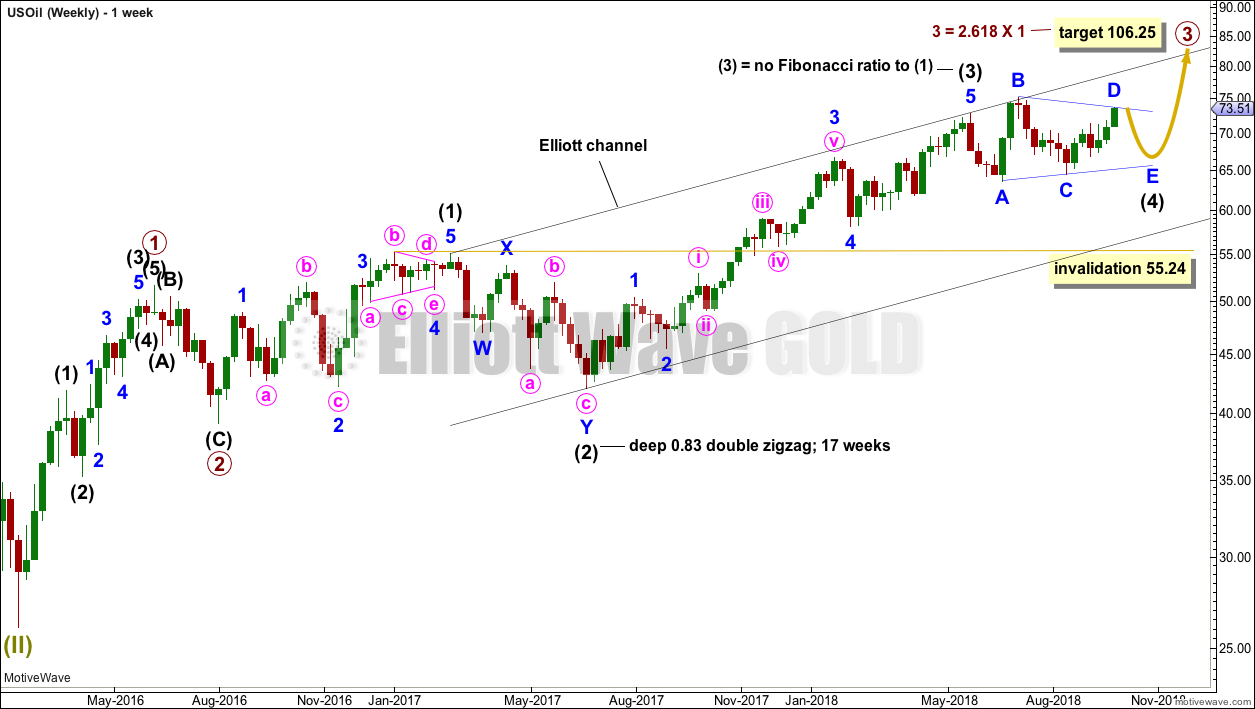
Intermediate wave (3) is now complete. There is no Fibonacci ratio between intermediate waves (1) and (3), and intermediate wave (3) is longer than 1.618 the length of intermediate wave (1).
This wave count fits with classic technical analysis at the monthly and daily chart levels.
Intermediate wave (2) was a deep double zigzag. Given the guideline of alternation, intermediate wave (4) may be expected to most likely be a shallow flat, triangle or combination. It may be about even in duration with intermediate wave (2), or it may be a little longer because triangles and combinations are more time consuming structures.
Intermediate wave (4) has now lasted 18 weeks. At the daily chart level, at this stage, I cannot see it as a complete corrective structure. The next expectation will now be for it to possibly complete in a further 3 weeks to total a Fibonacci 21. It may not exhibit a Fibonacci duration though (this is a rough guideline only).
Intermediate wave (4) may find support about the lower edge of the black Elliott channel. It may end within the price territory of the fourth wave of one lesser degree; minor wave 4 has its territory from 66.65 to 59.13.
At this stage, only two structural options fit for intermediate wave (4) at the daily chart level: a triangle and a combination. They are both equally valid and have about an even probability.
Because the last wave down to support, ending on the 16th of August, now looks like a complete structure and will only subdivide as a three, it cannot be wave C of a flat correction. For this reason, a flat correction at this time does not fit and has been discarded.
TRIANGLE
Click chart to enlarge.
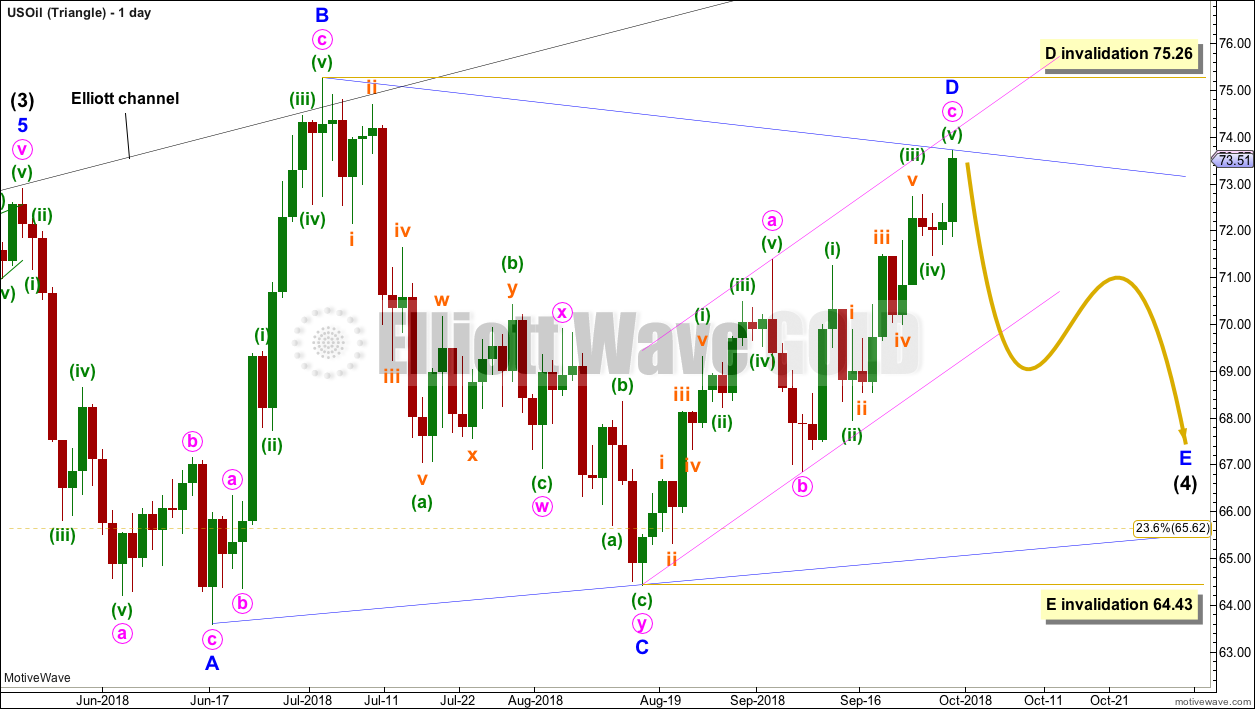
Intermediate wave (4) may be unfolding as a triangle.
Minor wave A is seen as a single zigzag, which has a reasonable look. Minor wave B is also seen as a single zigzag.
Minor wave C may have been a complete double zigzag, which has a very good fit. C waves are the most common triangle sub-waves to subdivide as a multiple, so this labelling fits with a common pattern.
Minor wave D may now be a complete zigzag. Within minor wave D, minute waves a and c are very close to equality. A breach of the pink channel about minor wave D would provide strong indication that minor wave D is over and minor wave E is underway.
It is still possible that minor wave D may continue a little higher.
Minor wave D within a contracting triangle may not move beyond the end of minor wave B above 75.26. The A-C trend line has a shallow slope, so the upper B-D trend line should have a reasonable slope for the triangle trend lines to have a reasonable rate of convergence. A contracting triangle would have a sloping B-D trend line, so this looks most likely.
Minor wave D within a barrier triangle may end about the same level as minor wave B at about 75.26, so that the B-D trend line is essentially flat. A barrier triangle here would not produce triangle trend lines that converge at a reasonable rate. This would not have the right look. A barrier triangle looks unlikely.
A final zigzag down for minor wave E would most likely end reasonably short of the A-C trend line. Minor wave E may not move beyond the end of minor wave C below 64.43.
COMBINATION
Click chart to enlarge.
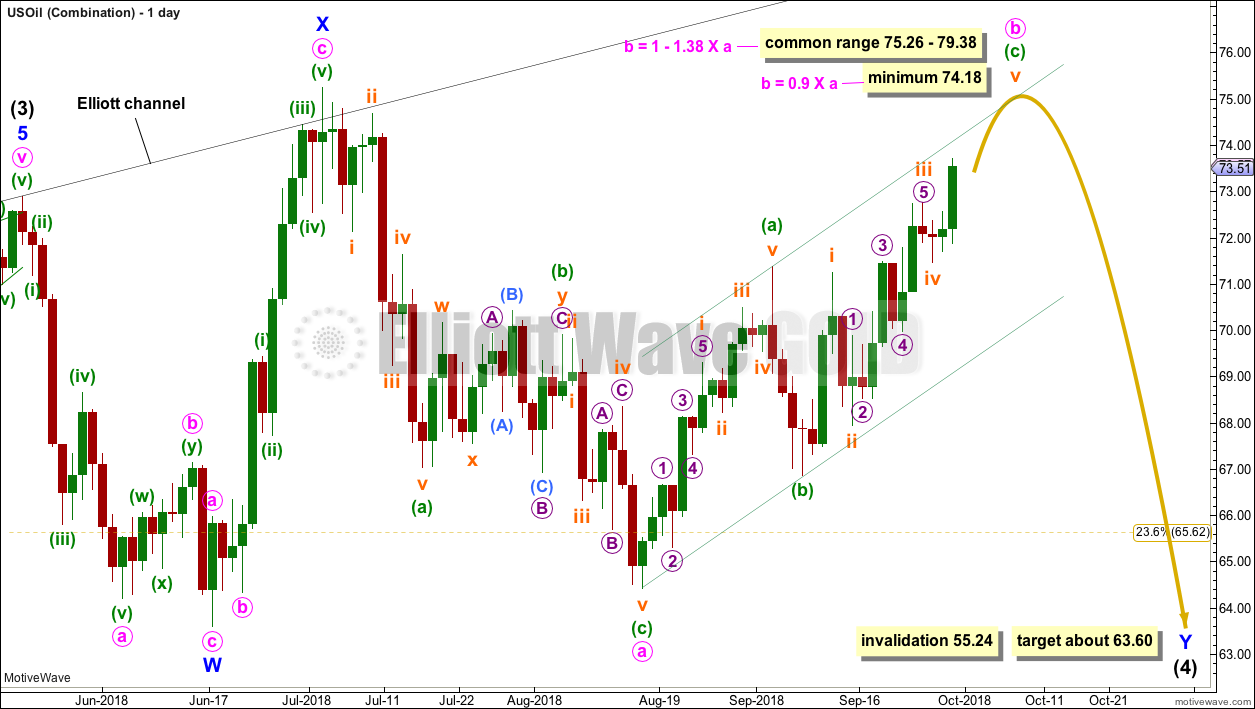
Intermediate wave (4) may be unfolding as a double combination.
The first structure in a double combination may be a complete zigzag labelled minor wave W. There is a little disproportion within minute wave a between the corrections of minuette waves (ii) and (iv), but this is slight enough to be acceptable for this market.
The double is joined by a complete three in the opposite direction, a zigzag labelled minor wave X. X waves within combinations have no minimum nor maximum allowable length, and may make new price extremes beyond the start of wave W as this one does. The only guideline in terms of depth for X waves is that they are normally very deep.
The second structure in a double combination would most likely be a flat correction as the two most common structures in a double combination are one zigzag and one flat.
Within a possible flat correction for minor wave Y, minute wave a looks like a completed three. Minute wave b must now retrace a minimum 0.9 length of minute wave a, and it may move beyond the start of minute wave a as in an expanded flat. So far minute wave b exhibits weakness: at the high for this week, there is bearish divergence between price and Stochastics on the daily chart, and volume is declining as price rises on the weekly chart.
Minute wave b may be subdividing as a single zigzag. Within the zigzag, minuette wave (c) must complete as a five wave structure. While minute wave b continues to move higher, downwards pullbacks may find support about the lower edge of the small channel drawn about it.
When minute wave b is complete, then minute wave c would need to end at least slightly below the end of minute wave a at 64.43 to avoid a truncation.
The purpose of the second structure in a double combination is to take up time and move price sideways. To achieve this purpose minor wave Y would be most likely to end about the same level as minor wave W about 63.60.
TECHNICAL ANALYSIS
MONTHLY CHART
Click chart to enlarge. Chart courtesy of StockCharts.com.
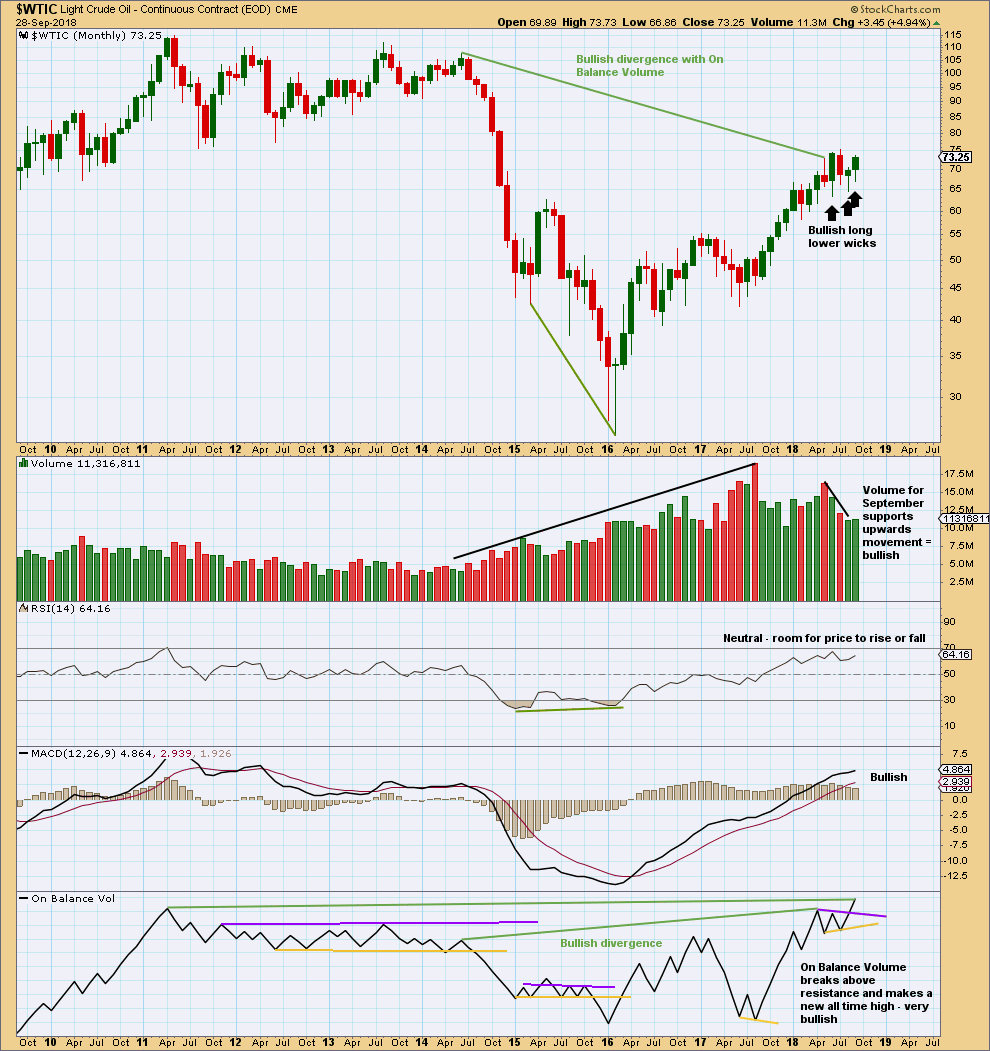
The larger trend remains upwards.
The last three months have seen price move sideways. Three long and lower monthly wicks are bullish. Now September shows support from volume for upwards movement; the short term volume profile is now bullish.
On Balance Volume gives a bullish signal this month, breaking above resistance. On Balance Volume has also made a new high above the prior high of May 2011. As On Balance Volume should be read as a leading indicator, price may follow through with a new high above May 2011’s high.
WEEKLY CHART
Click chart to enlarge. Chart courtesy of StockCharts.com.
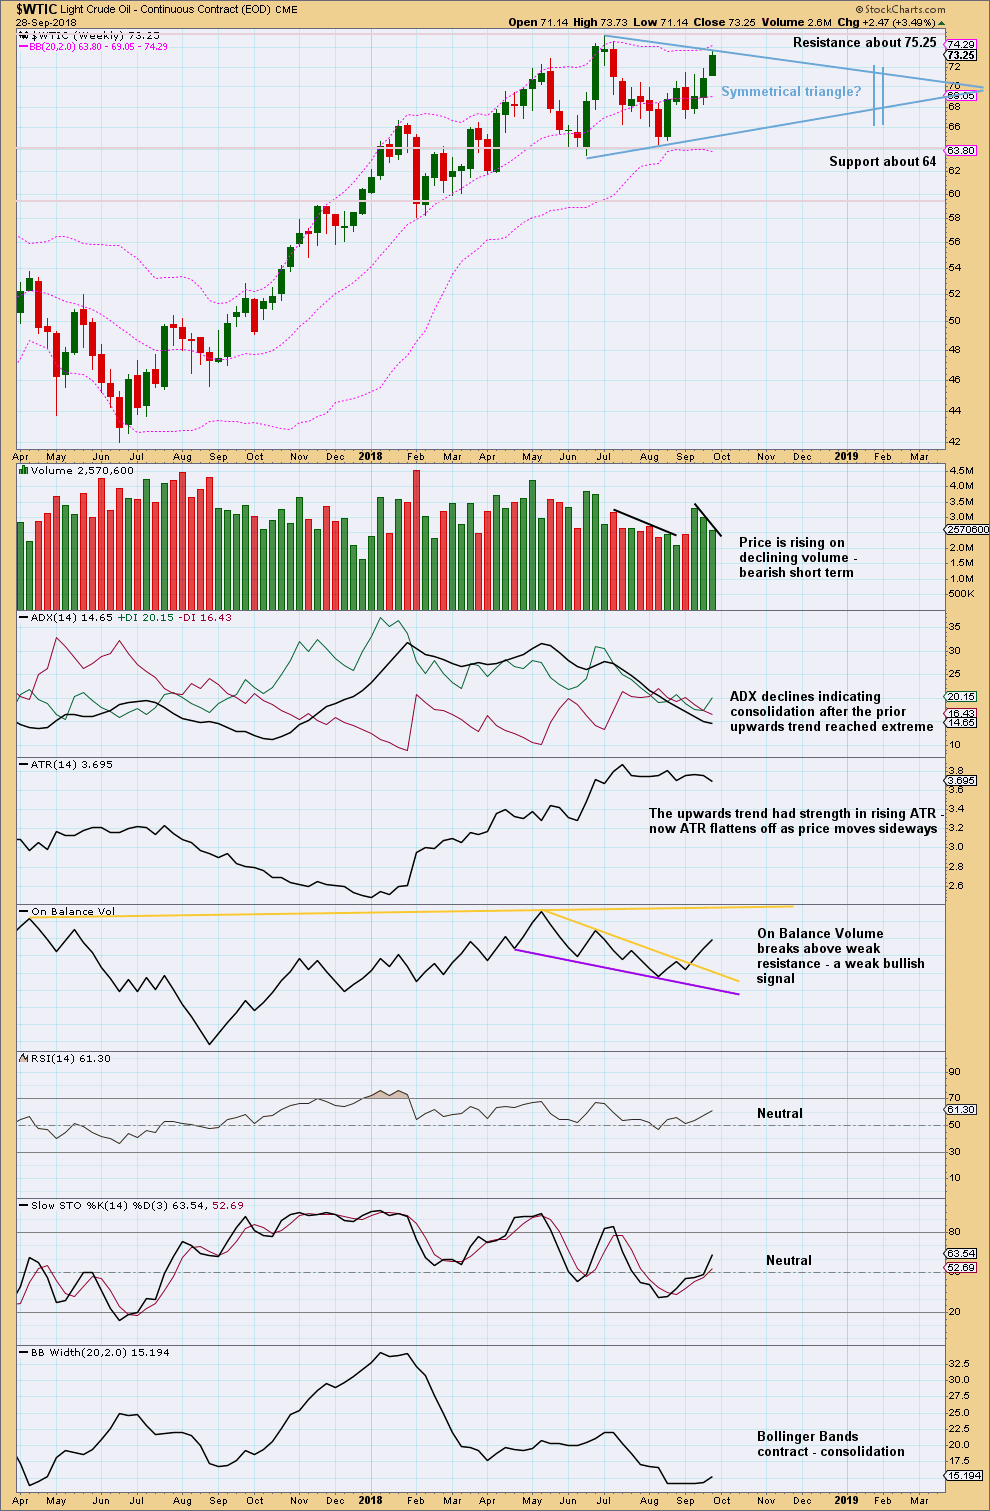
It is upwards weeks during the consolidation that have strongest support from volume. This looks like a continuation pattern. The breakout would most likely be upwards.
For the short term, with volume not supporting upwards movement, a downwards pullback or swing to support may occur. At this time frame, ADX still indicates price is most likely in a consolidation and not yet back within an upwards trend.
The symmetrical triangle is drawn on the weekly chart, and the upper trend line is again slightly adjusted this week. Symmetrical triangles most commonly break out 73% – 75% of the distance from base to cradle. This distance is noted with vertical lines on the chart. With adjusted trend lines, this would now be in about 19 – 20 weeks.
If the upper edge of the triangle trend line needs to again be adjusted, then the length of the triangle from base to cradle would increase. If the upper trend line becomes horizontal, then an ascending triangle would be indicated, which commonly break out close to 61% of the distance from base to cradle.
DAILY CHART
Click chart to enlarge. Chart courtesy of StockCharts.com.
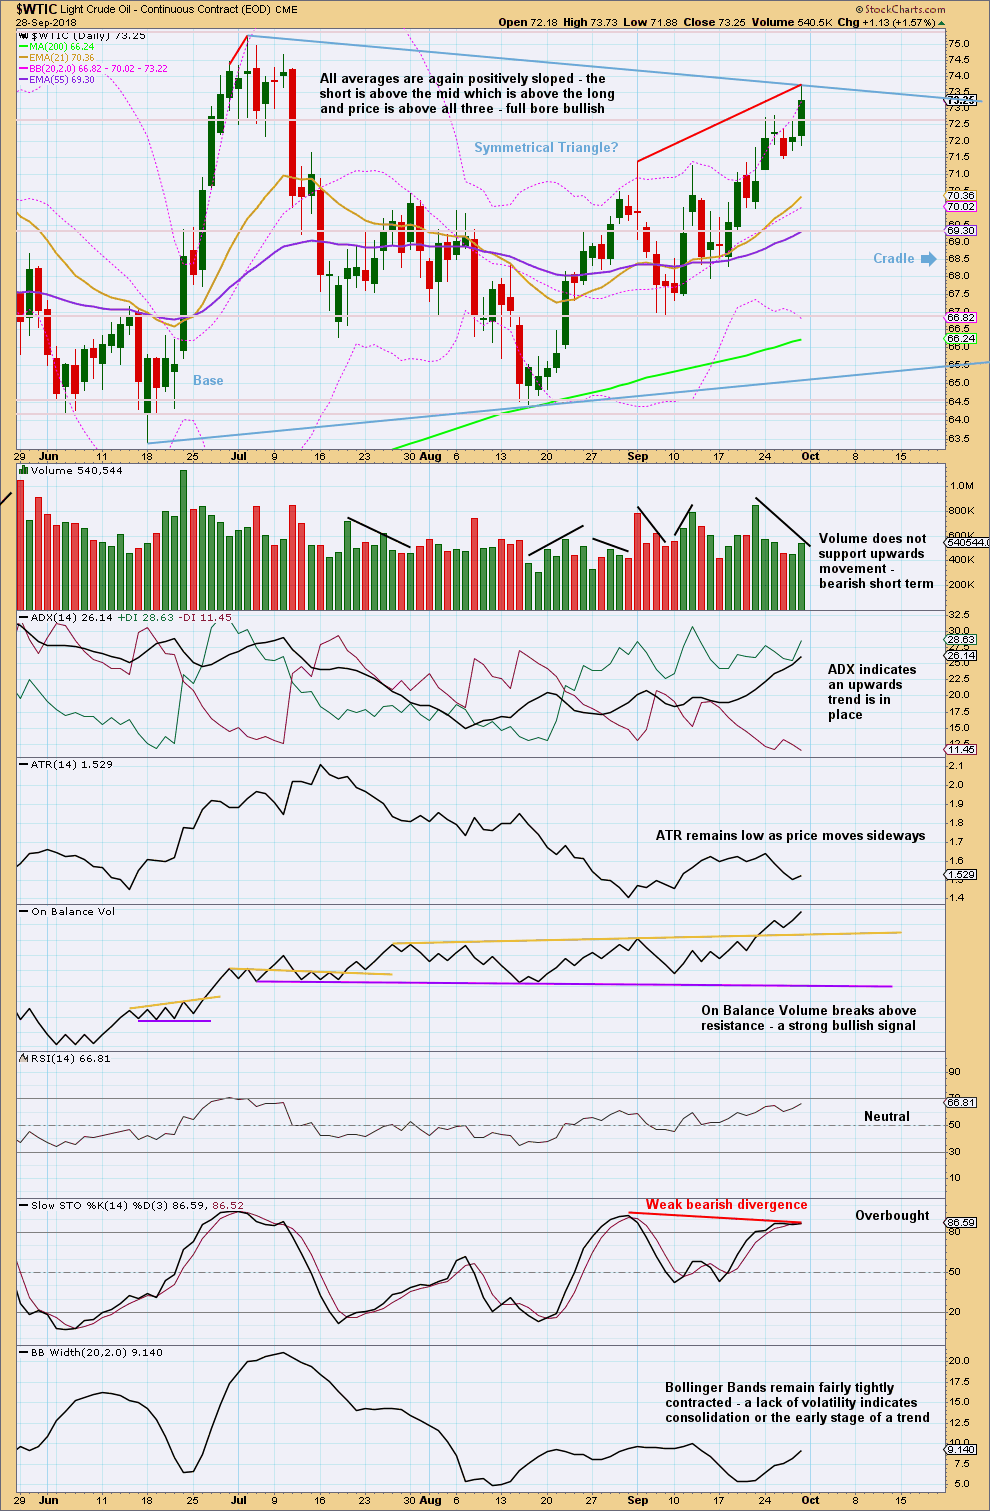
Within this short term upwards trend there is now: weak volume, low ATR, contracted Bollinger Bands, and some divergence between price and Stochastics at the last high.
Look for a pullback or downwards swing to support.
Published @ 05:50 p.m. EST on 29th September, 2018.
—
Careful risk management protects your trading account(s).
Follow my two Golden Rules:
1. Always trade with stops.
2. Risk only 1-5% of equity on any one trade.
Updated triangle wave count:
Now looking for minor wave 2 to last several days and end either about the 0.382 or 0.618 Fibonacci ratios.
For members looking for a long position this may provide a nice entry point. Risk is at 66.86.
Remember, the other idea of a combination remains valid.
Combination wave count update:
Now a final deep downwards swing. This does not have as much support from classic TA at this time. That may change if downwards movement shows strength.
The wave count below in which I see intermediate wave (4) complete today increases in probability with another strong upwards day closing above prior resistance.
A classic TA technique is to wait for a breakout and then enter in the direction of the trend after a breakout is confirmed. It today has support from volume then have a little confidence in the upwards trend continuing. I don’t have StockCharts data for today’s session yet.
And StockCharts shows another upwards day with support from volume.
This does not look like a B wave, it looks like intermediate wave (4) is over.
US Oil updated:
First, classic TA.
There is an upwards trend in place. Right now price is at resistance and RSI and Stochastics are overbought, but there is no candlestick reversal at the high. Price could continue to move higher and conditions could remain extreme for a while, but it looks reasonably likely that some pullback could happen here before that happens.
Bollinger Bands now expanding with the trend is pretty bullish.
Look out now for any surprises to be to the upside.
Combination wave count updated:
This EW count now expects another big downwards swing to end below 64.43.
This is possible, but the TA chart doesn’t really support it.
Triangle chart updated:
It is just possible that intermediate wave (4) is over as a triangle. But I really do not like the quick conclusion. Sometimes triangles do this, but it is uncommon. This looks a little forced. But then, this market does not always have really good looking EW structures.
This wave count outlines the surprise to the upside possibility. A pullback about here may be relatively brief and shallow, as the pull up of a strong fifth wave may face minor 2 to be more shallow than second waves usually are.
Price has managed to just close above prior resistance on an upwards day with some support from volume…. but prior resistance was 75.27 (StockCharts data) and the close on 1st October was only 75.30 and although volume was stronger than the prior two days it was not strong compared to much of the rest of the consolidation.
It’s a bullish sign, but I’d have more confidence that the consolidation really is over if we can see another upwards day with a higher close.
The trend is up, pullbacks are opportunities. Look out for intermediate wave (5) to build strength and maybe end with a blowoff top in coming weeks.
Hi Lara,
USoil tipped higher today invalidating the triangle count. Can you please update the oil analysis?
My main question is: what’s the likelihood of intermediate wave 4 being over? I remember we also thought minor 4 of intermediate 3 to have a 3 wave structure, but it end up not doing so. I’m thinking same might be happening for intermediate 4?
Thanks in advance!
I have an answer for your above. It could be over.