

S&P 500
Downwards movement was expected for the short term. Although price did not make a new low, the candlestick for Friday closed red and the upper wick was long. Overall, this fits expectations.
Summary: For the short term, next week may see more downwards movement to a new low. The target is at 2,698, which is just below support about 2,700; if that gives way, then about 2,677.
After this next wave down, a multi week bounce may develop.
A primary degree correction should last several weeks and should show up on the weekly and monthly charts. Primary wave 4 may total a Fibonacci 8, 13 or 21 weeks. Look for very strong support about the lower edge of the teal trend channel on the monthly chart.
Primary wave 4 should be expected to exhibit reasonable strength. This is the last multi week to multi month consolidation in this ageing bull market, and it may now begin to take on some characteristics of the bear market waiting in the wings.
The final target for this bull market to end remains at 3,616, which may be met in October 2019.
The biggest picture, Grand Super Cycle analysis, is here.
Last published monthly chart is here, video is here.
ELLIOTT WAVE COUNT
WEEKLY CHART
Click chart to enlarge.
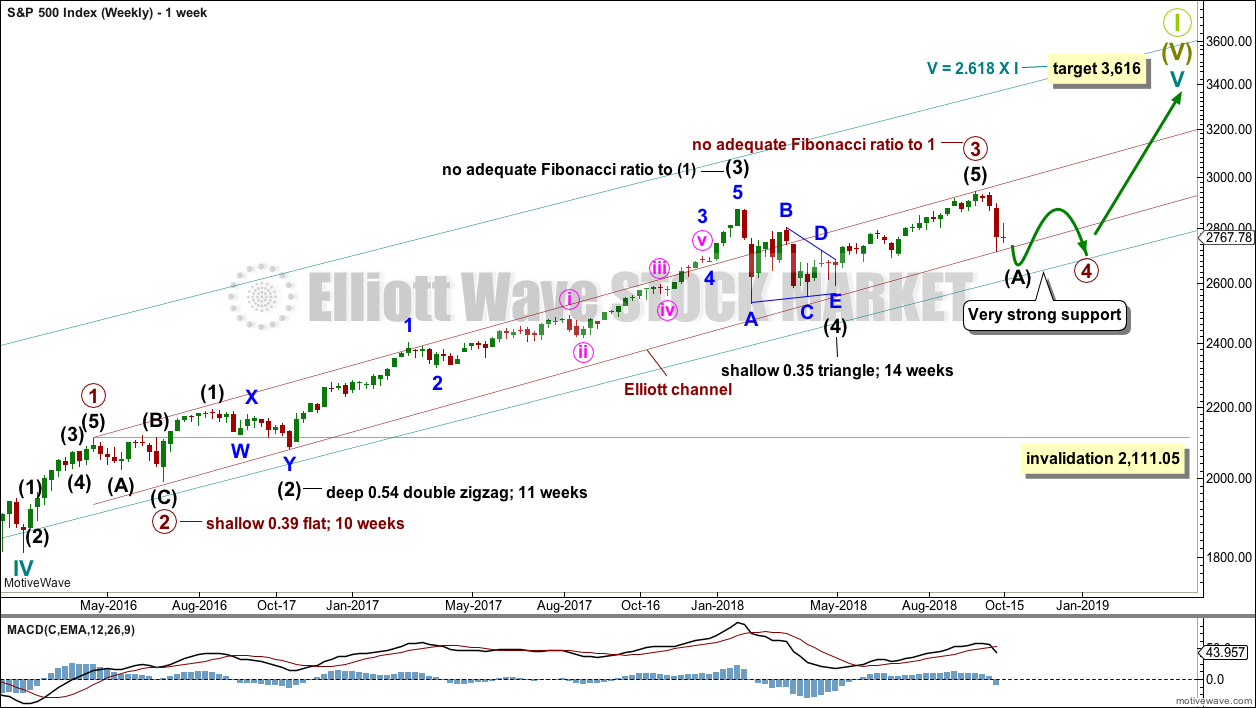
Cycle wave V must complete as a five structure, which should look clear at the weekly chart level and also now at the monthly chart level. It may only be an impulse or ending diagonal. It is clear it is an impulse.
Within cycle wave V, the third waves at all degrees may only subdivide as impulses.
Within primary wave 3, there is perfect alternation and excellent proportion between intermediate waves (2) and (4).
The channel is now drawn about primary degree waves. The first trend line is drawn from the ends of primary waves 1 to 3, then a parallel copy is placed upon the low of primary wave 2. Primary wave 4 may find support about the lower edge of this maroon channel. At the end of the first downwards wave within primary wave 4, that is exactly where price bounced up. The overshoot of the upper edge of this channel by the end of intermediate wave (3) looks typical. For the S&P, its third waves are usually the strongest portion of an impulse; they often exhibit enough strength to overshoot channels.
Fourth waves do not always end within channels drawn using this technique. If primary wave 4 breaks out of the narrow maroon channel, then it may find very strong support about the lower edge of the teal channel. This channel is copied over from the monthly chart and contains the entire bull market since its beginning in March 2009. While Super Cycle wave (V) is incomplete, this channel should not be breached.
Primary wave 4 may not move into primary wave 1 price territory below 2,111.05.
When primary wave 4 may be complete, then the final target may be also calculated at primary degree. At that stage, the final target may widen to a small zone, or it may change.
At this stage, the expectation is for the final target to be met in October 2019. If price gets up to this target and either the structure is incomplete or price keeps rising through it, then a new higher target would be calculated.
DAILY CHART
Click chart to enlarge.
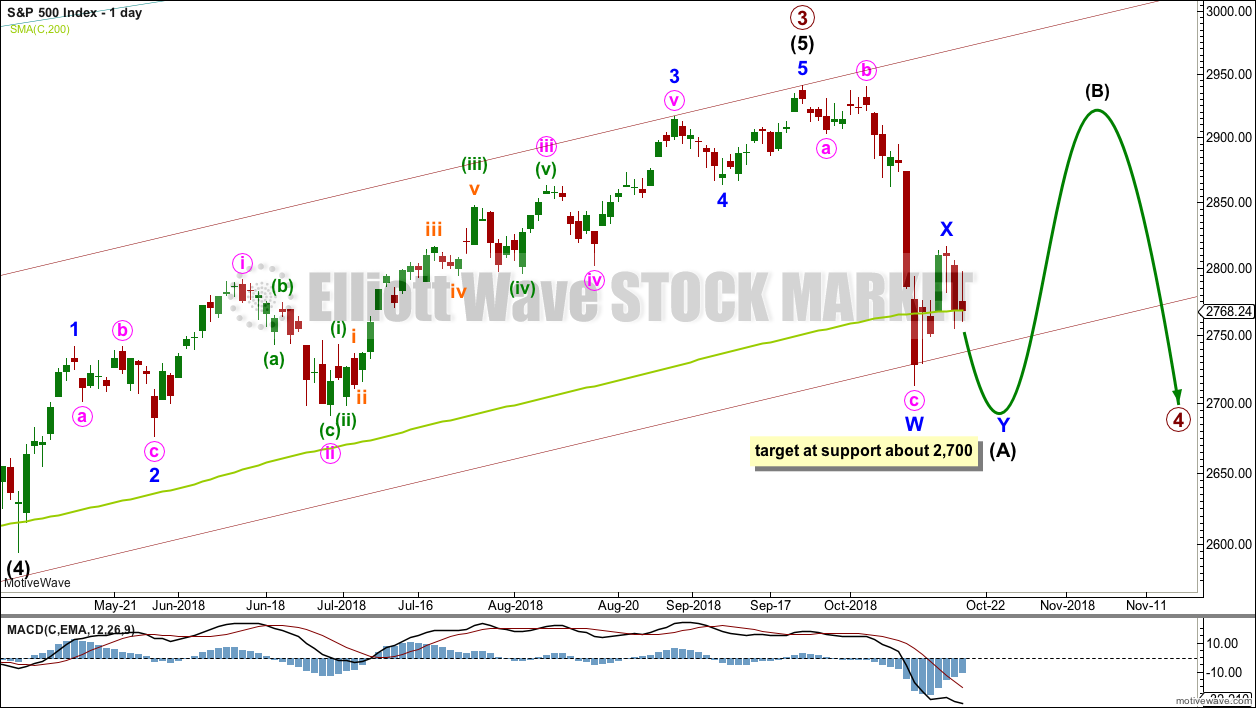
Primary wave 4 would most likely end somewhere within the price territory of the fourth wave of one lesser degree. Intermediate wave (4) has its price territory from 2,872.87 to 2,532.69. Within this range sit the 0.236 Fibonacci ratio at 2,717 and the 0.382 Fibonacci ratio at 2,578.
The 0.382 Fibonacci ratio would expect an overshoot of the teal channel. This may be too low; price may find support at the lower edge of the channel. However, as primary wave 4 should be expected to exhibit reasonable strength, it may be able to overshoot the channel and that would look reasonable.
Primary wave 2 unfolded as a shallow regular flat correction lasting 10 weeks.
Primary wave 4 may have begun with a zigzag downwards. This is labelled as the first zigzag in a possible double zigzag downwards for intermediate wave (A).
If intermediate wave (A) unfolds as a double zigzag, then primary wave 4 may be unfolding as either a flat or a triangle. A double zigzag may not be labelled as intermediate wave (W) because the maximum number of corrective structures is three, and to label multiples within multiples increases the maximum beyond three and violates an Elliott wave rule.
If primary wave 4 is unfolding as a flat correction, then intermediate wave (A) may be a double zigzag. Primary wave B may then bounce higher to retrace a minimum 0.9 length of primary wave A, and may make a new high above the start of primary wave A as in an expanded flat correction.
If primary wave 4 is unfolding as a triangle, then intermediate wave (A) may be a double zigzag. Primary wave B would have no minimum required length, and would most commonly be about 0.8 to 0.85 the length of primary wave A.
Primary wave 4 may not move into primary wave 1 price territory below 2,111.05.
ALTERNATE DAILY CHART
Click chart to enlarge.
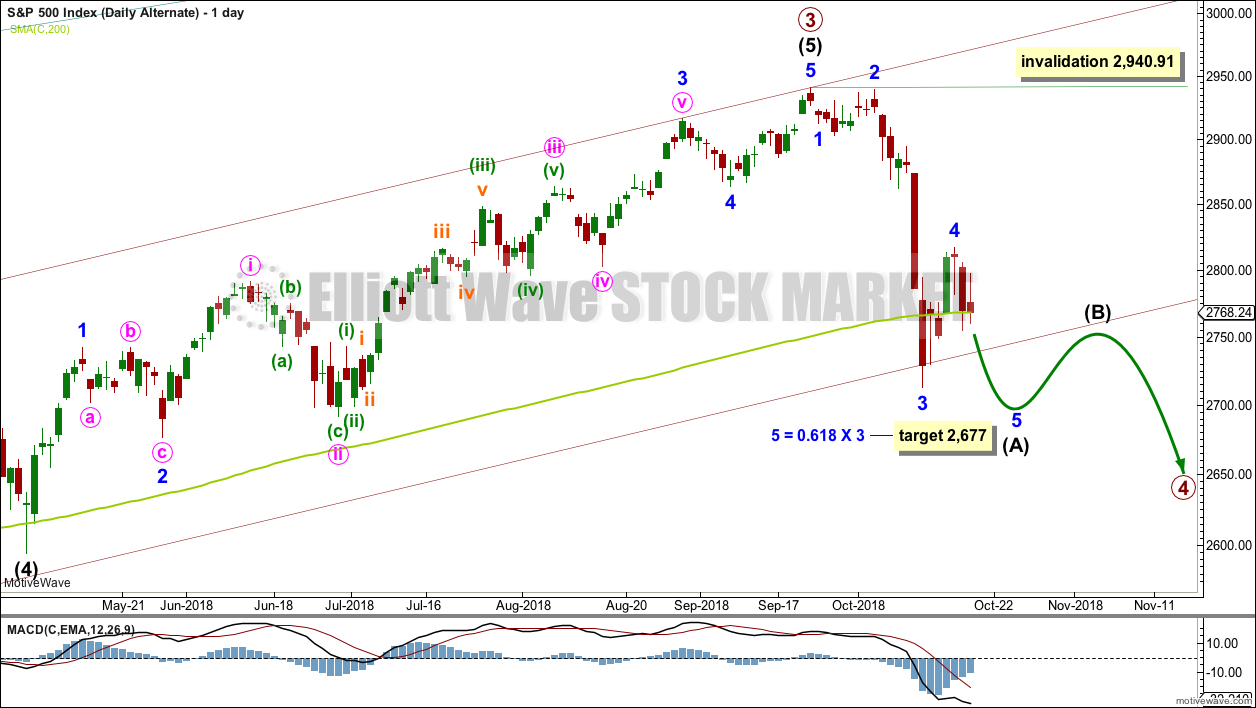
It is also possible to see intermediate wave (A) as an incomplete five wave structure.
There is now reasonably good proportion between minor waves 2 and 4 within this wave count. Additionally, there is alternation between the deep 0.96 combination of minor wave 2 and the shallow 0.46 zigzag of minor wave 4.
There is no adequate Fibonacci ratio between minor waves 3 and 1. This makes it more likely that minor wave 5 may exhibit a Fibonacci ratio to either of minor waves 3 or 1. Because minor wave 1 was very short, a Fibonacci ratio to minor wave 3 here looks slightly more likely.
If intermediate wave (A) ends with closing below the lower edge of the maroon channel, which is copied over from the weekly chart, then intermediate wave (B) may bounce up to test resistance there.
Intermediate wave (B) may not move beyond the start of intermediate wave (A) above 2,940.91.
SECOND ALTERNATE DAILY CHART
Click chart to enlarge.
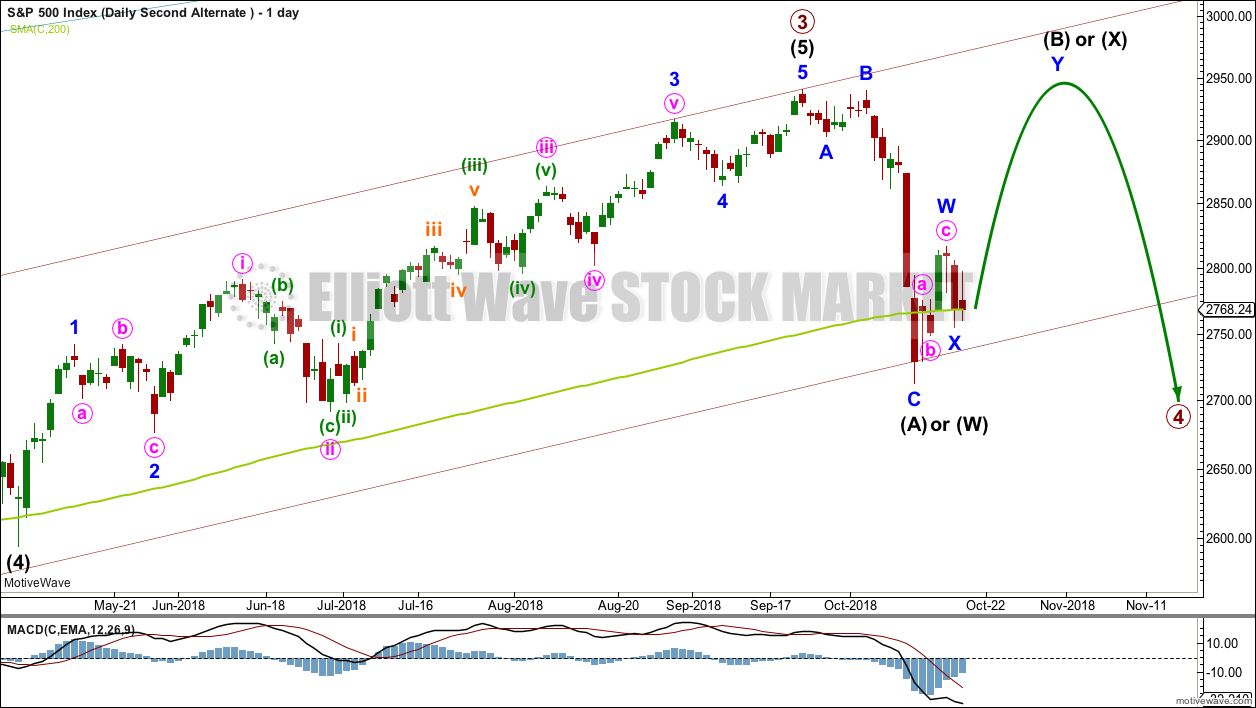
It is also possible to still see intermediate wave (A) as a complete zigzag. The bounce may continue next week for intermediate wave (B).
If intermediate wave (A) is a zigzag, then primary wave 4 may be unfolding as a flat or triangle.
The zigzag may also be labelled intermediate wave (W), because primary wave 4 may be unfolding as a double combination with the first structure a zigzag and the second structure most likely a flat.
While waves W, Y and Z within combinations must only subdivide as single corrective structures, X waves may subdivide as any corrective structure including multiples (although this is uncommon). X waves are not counted in the maximum number of allowable corrective structures which is three.
TECHNICAL ANALYSIS
WEEKLY CHART
Click chart to enlarge. Chart courtesy of StockCharts.com.
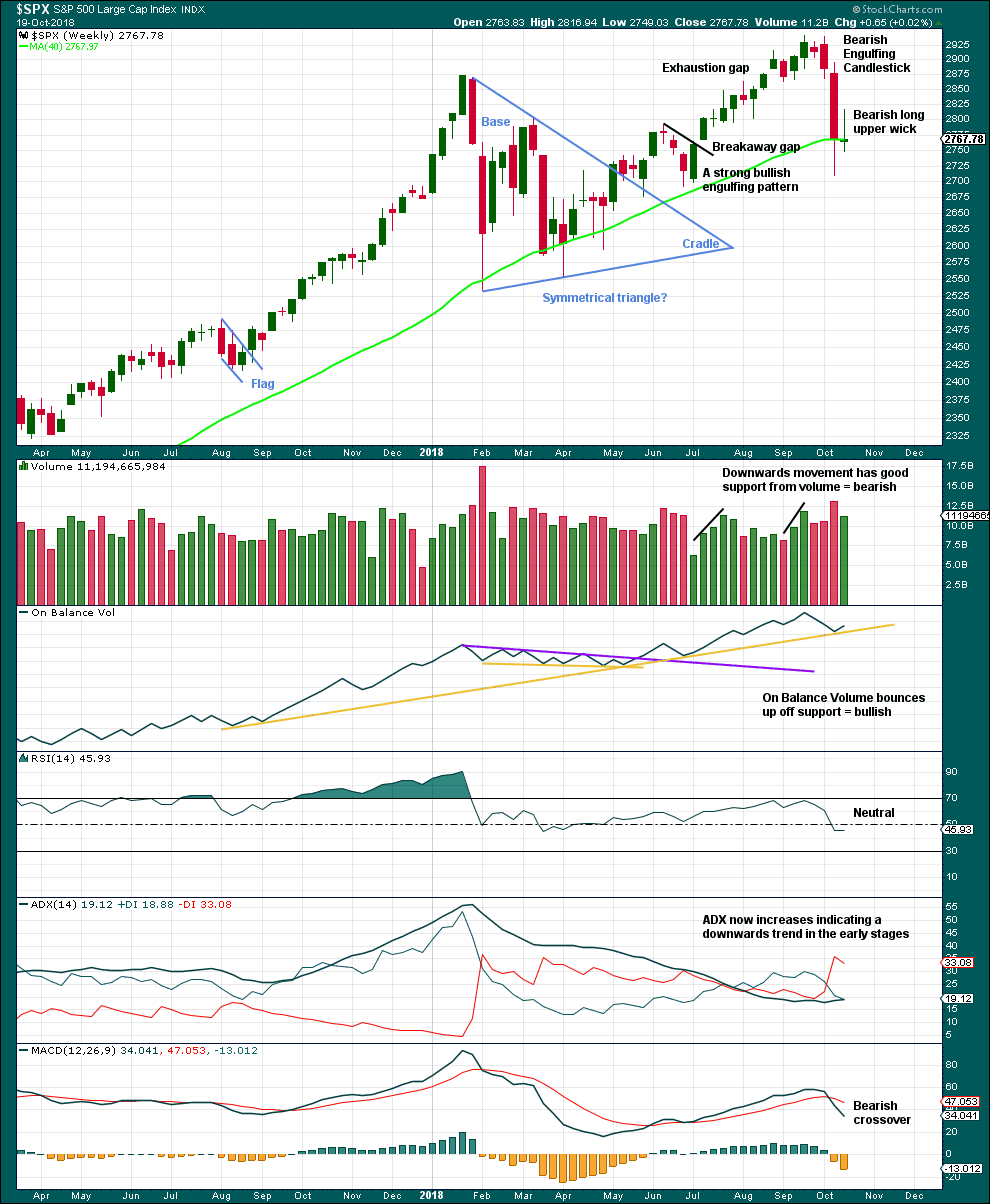
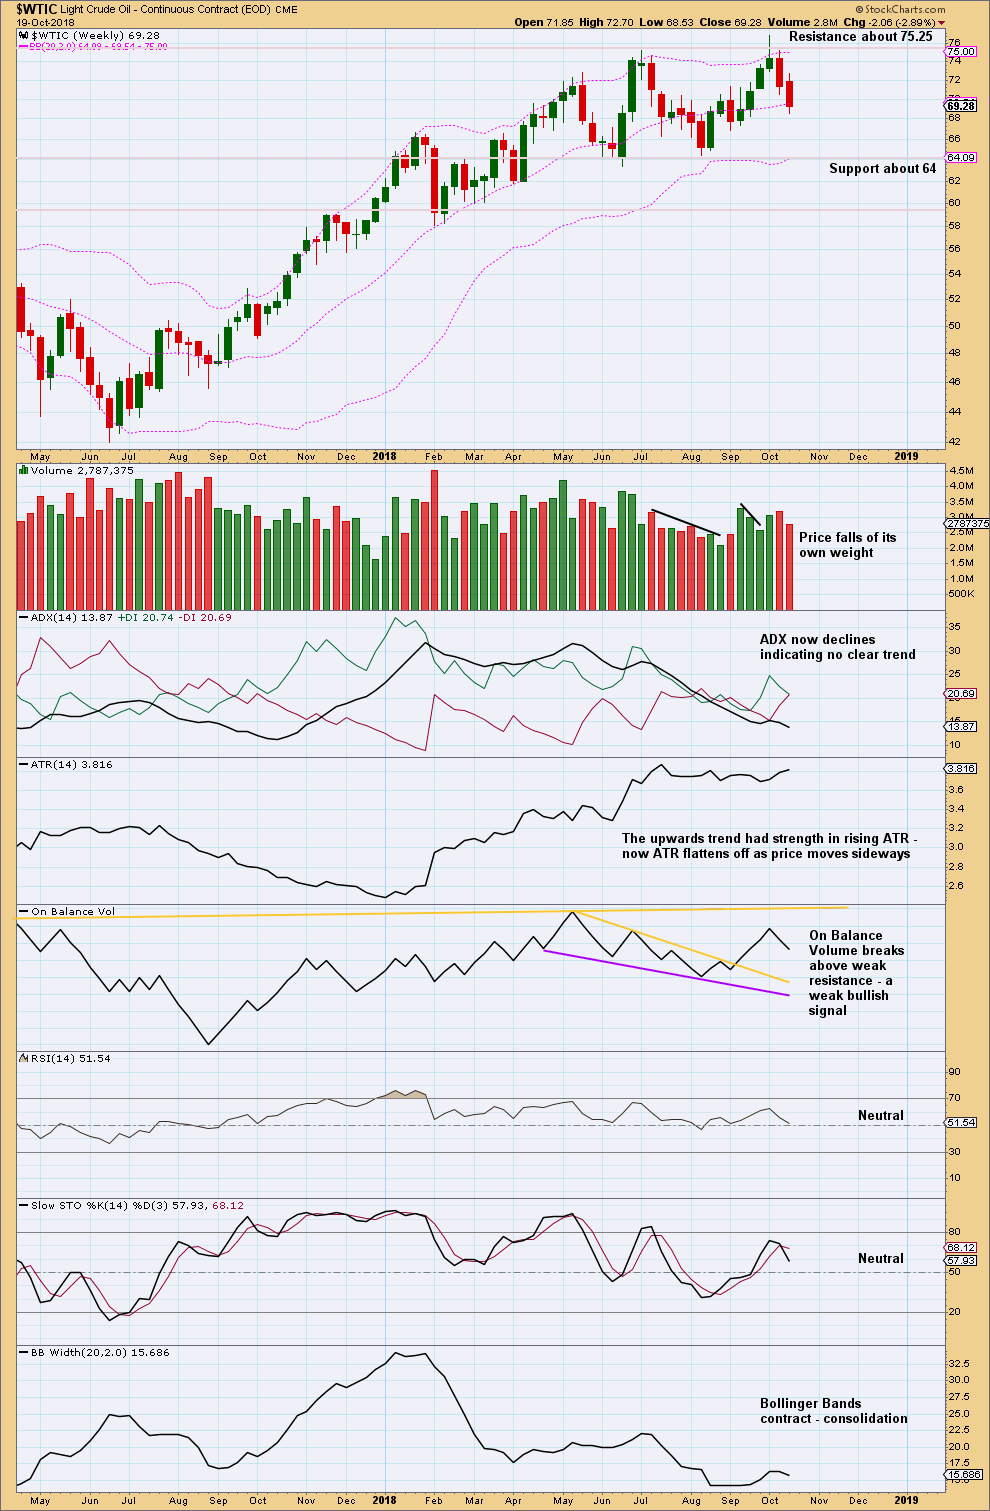
The bearish long upper wick on this weekly candlestick is contradicted by a bullish signal from On Balance Volume. Downwards movement here may be limited as On Balance Volume may find support with one more downwards week.
DAILY CHART
Click chart to enlarge. Chart courtesy of StockCharts.com.
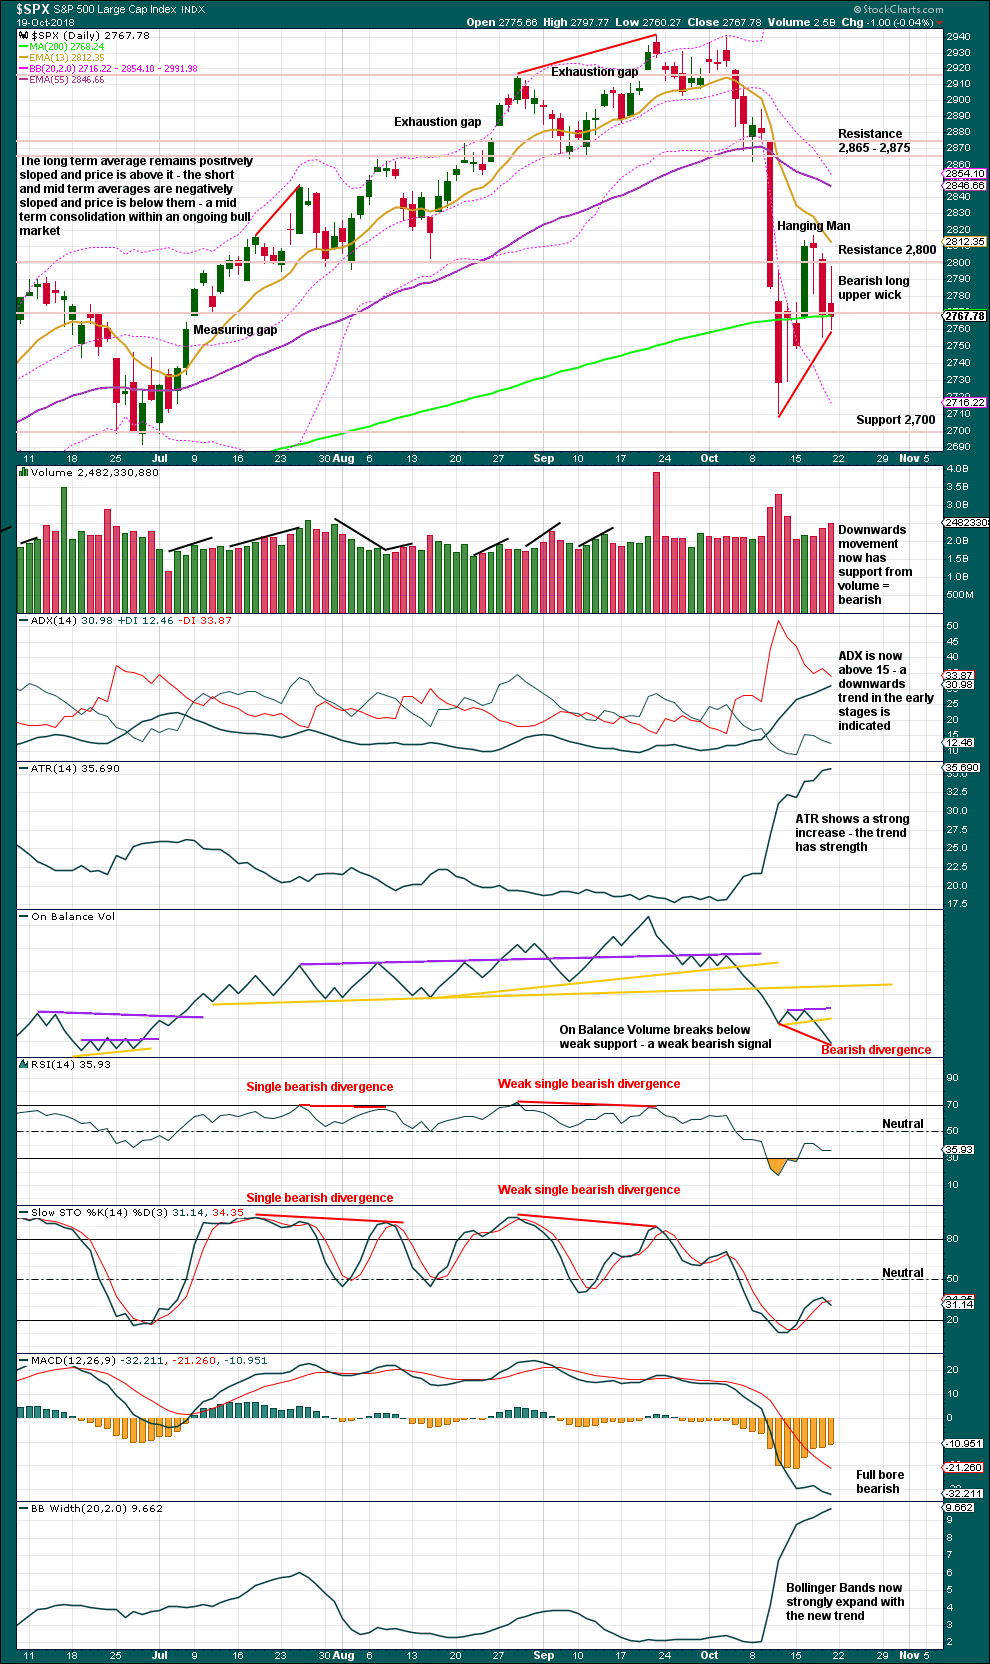
A bearish long upper wick, support from volume for downwards movement, and a new low for On Balance Volume at the daily chart level all indicate more downwards movement next week to a new low below 2,710.51 as most likely.
Look out for support below, at about 2,700.
VOLATILITY – INVERTED VIX CHART
WEEKLY CHART
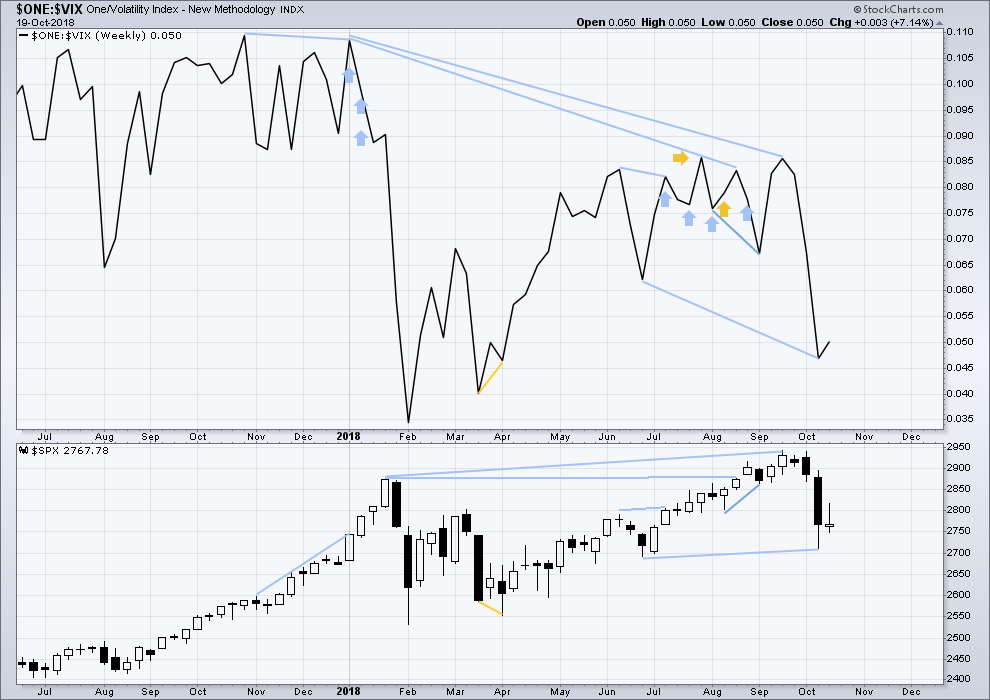
Click chart to enlarge. Chart courtesy of StockCharts.com. So that colour blind members are included, bearish signals
will be noted with blue and bullish signals with yellow.
Primary wave 4 has now arrived and is showing reasonable strength. There is continuing mid term bearish divergence with inverted VIX making a new low below the prior swing low of the week beginning 25th June, but price has not yet made a corresponding new low.
As primary wave 4 continues this weekly chart may offer a bullish signal at its end.
This week completed an inside week with the balance of volume upwards and a green weekly candlestick. A small upwards movement from inverted VIX offers no new short term divergence.
DAILY CHART
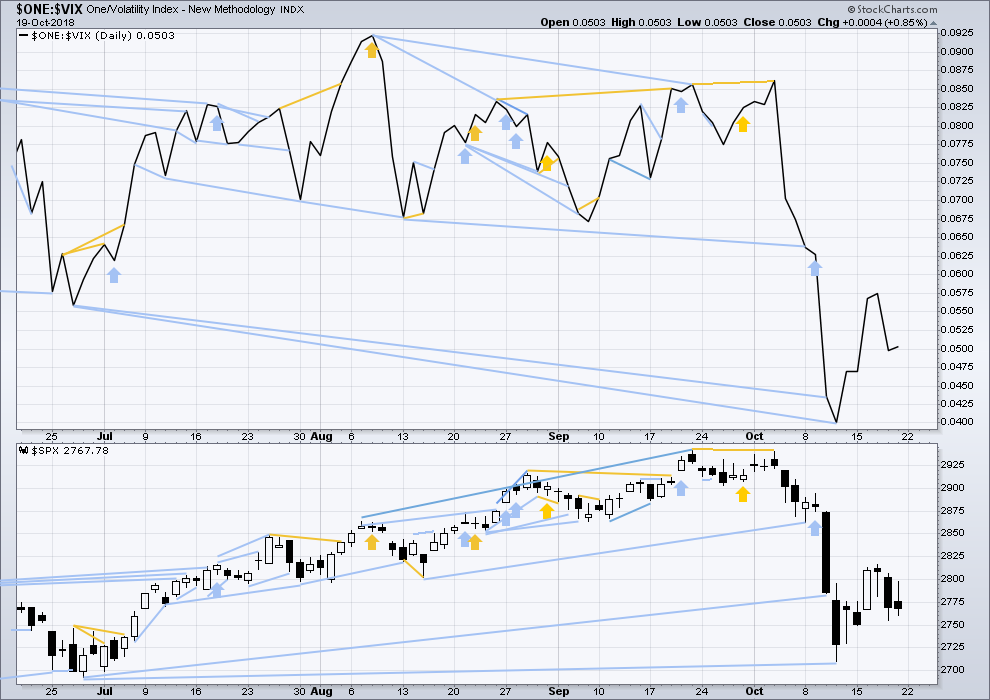
Click chart to enlarge. Chart courtesy of StockCharts.com. So that colour blind members are included, bearish signals
will be noted with blue and bullish signals with yellow.
Normally, volatility should decline as price moves higher and increase as price moves lower. This means that normally inverted VIX should move in the same direction as price.
For Friday the candlestick closed red and the balance of volume was down, but the day was an inside day.
Downwards movement during Friday’s session does not have a normal increase in VIX. This divergence for the short term is bullish.
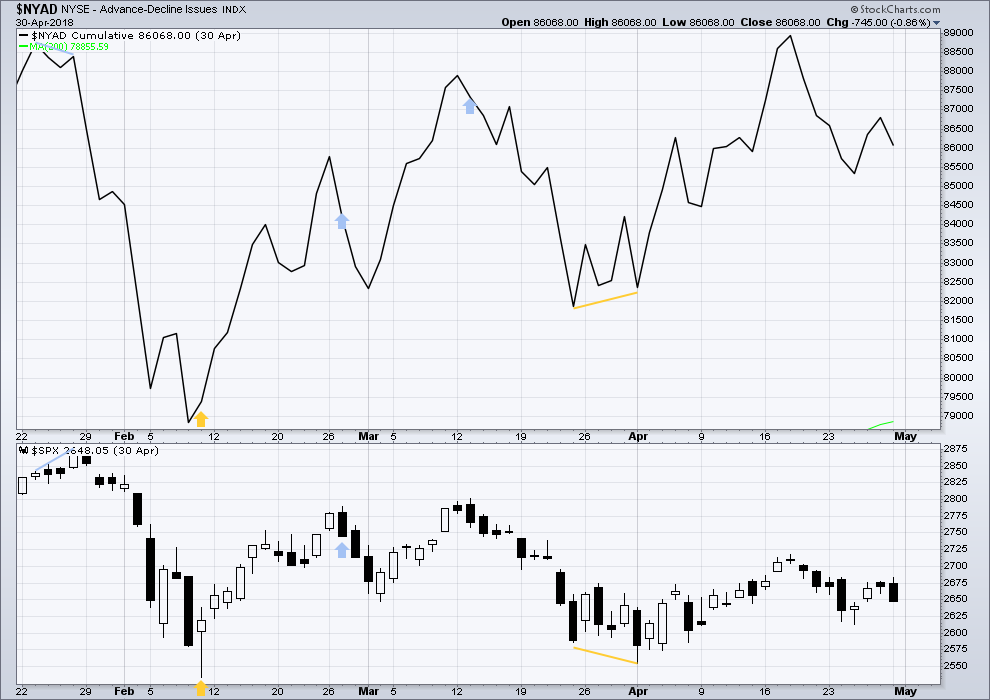
BREADTH – AD LINE
WEEKLY CHART
Click chart to enlarge. Chart courtesy of StockCharts.com.
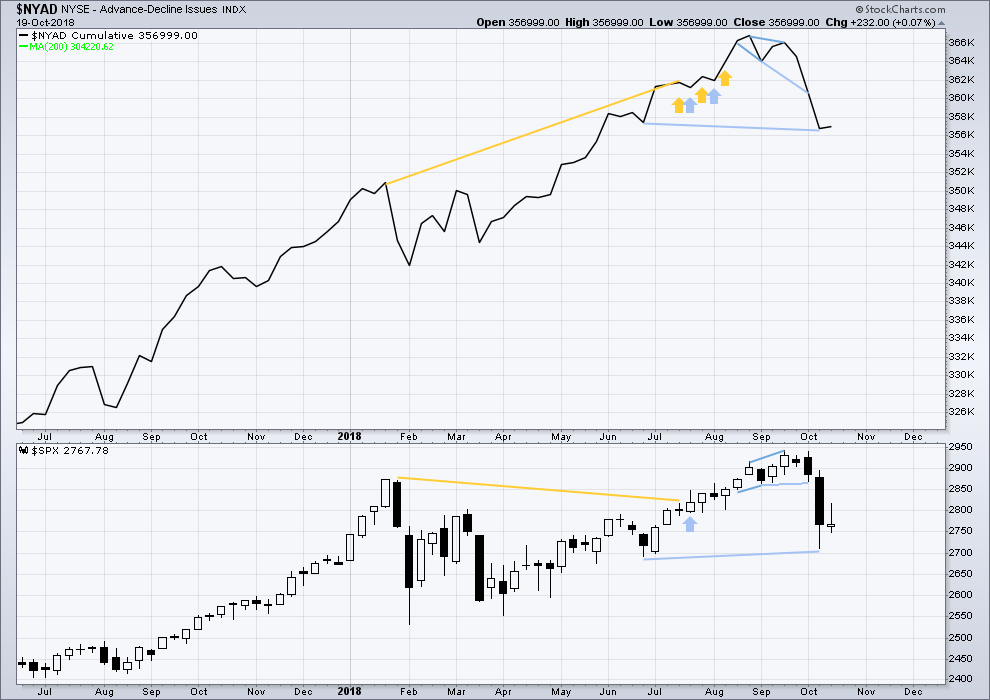
When primary wave 3 comes to an end, it may be valuable to watch the AD line at the weekly time frame as well as the daily.
The AD line has made a slight new low below the prior swing low of the week beginning 25th June, but price has not. This mid term divergence is bearish, but it is weak.
Upwards movement within this last week has support from a slight increase in the AD line. There is no new short term divergence.
DAILY CHART
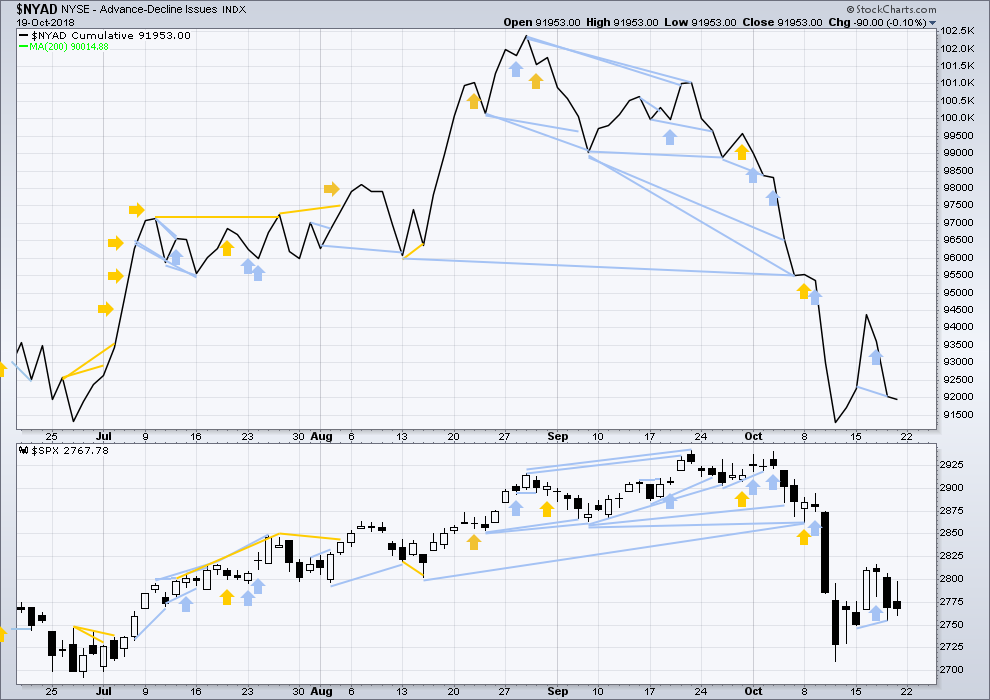
Click chart to enlarge. Chart courtesy of StockCharts.com.
There is normally 4-6 months divergence between price and market breadth prior to a full fledged bear market. This has been so for all major bear markets within the last 90 odd years. With no longer term divergence yet at this point, any decline in price should be expected to be a pullback within an ongoing bull market and not necessarily the start of a bear market. New all time highs from the AD line on the 29th of August means that the beginning of any bear market may be at the end of December 2018, but it may of course be a lot longer than that. My next expectation for the end of this bull market may now be October 2019.
Breadth should be read as a leading indicator.
The AD line has made a new low below the prior low of the 15th of October, but price has not. This divergence is short term and bearish; it is reasonable, but it is not very strong. This supports the first two Elliott wave counts.
Downwards movement during Friday’s session has support from a decline in market breadth. This is bearish.
Both of mid and small caps moved lower on Friday. Downwards movement has some support from market breadth. This looks bearish for the short term, and a new low below the last small swing low looks most likely here.
DOW THEORY
The following lows need to be exceeded for Dow Theory to confirm the end of the bull market and a change to a bear market:
DJIA: 23,344.52.
DJT: 9,806.79.
S&P500: 2,532.69.
Nasdaq: 6,630.67.
ANALYSIS OF INTERMEDIATE WAVE (4)
TECHNICAL ANALYSIS
Click chart to enlarge. Chart courtesy of StockCharts.com.
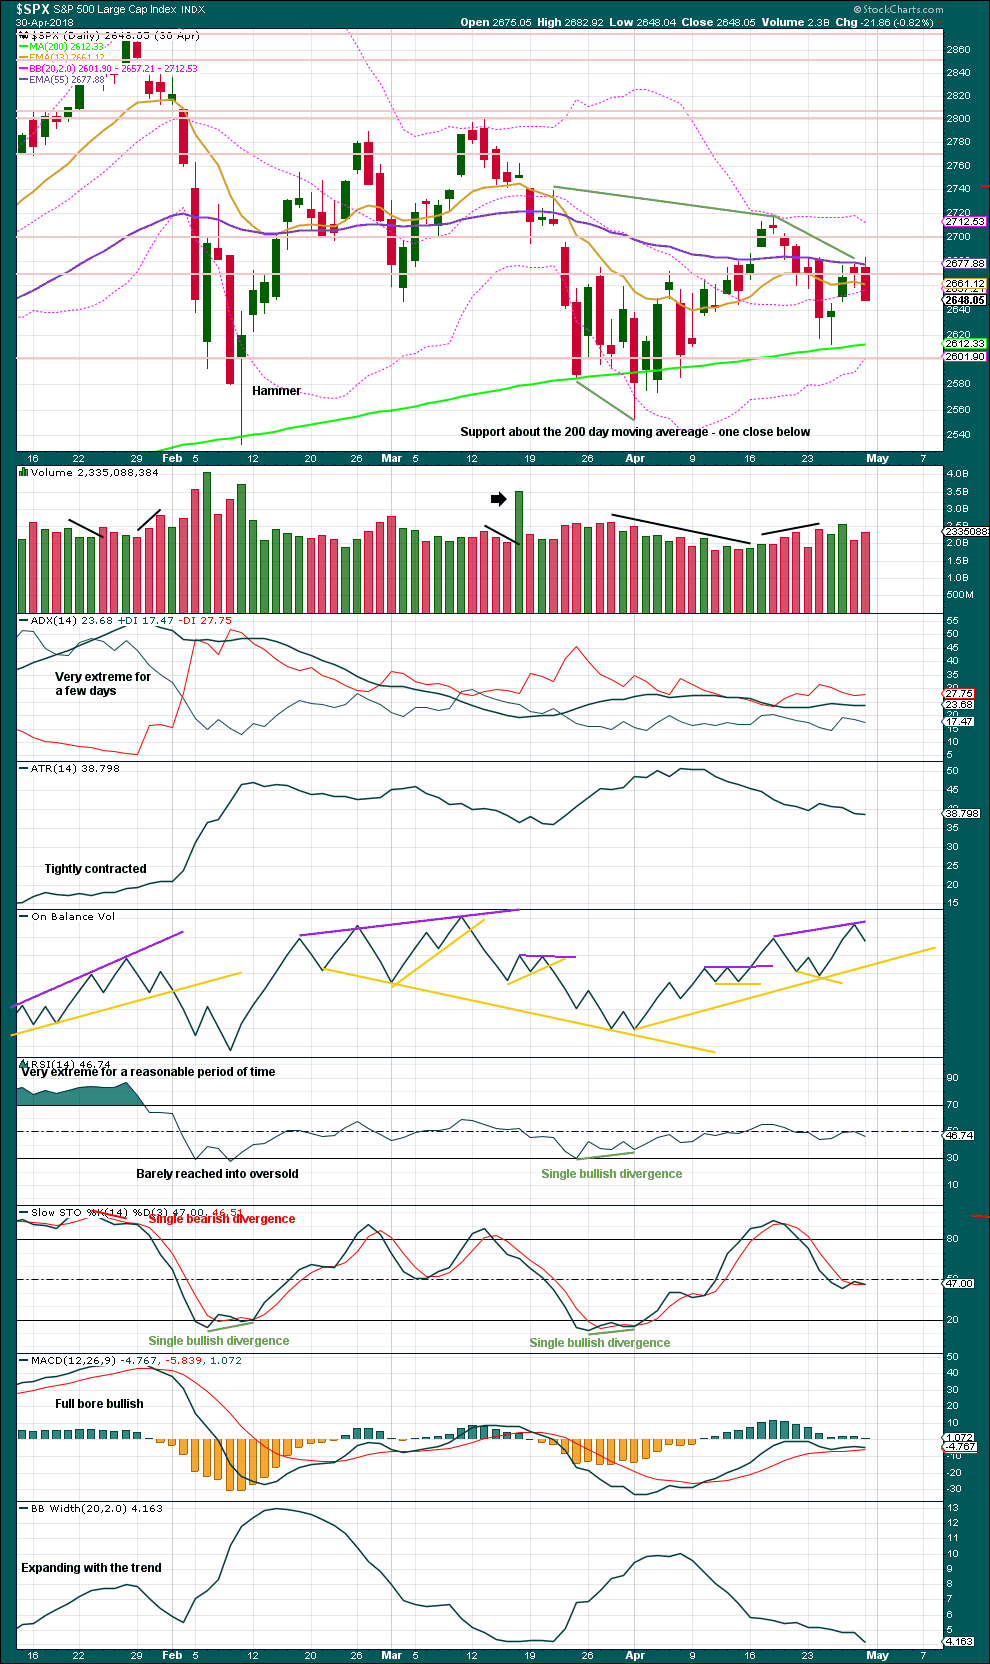
Intermediate wave (4) was a large symmetrical triangle. The deepest wave was the first wave. At its low there was a clear candlestick reversal pattern and bullish divergence between price and Stochastics.
RSI barely managed to reach into oversold.
The current correction for primary wave 4 may behave differently, but there should be some similarities.
It is expected that primary wave 4 may be stronger than intermediate wave (4).
VIX
Click chart to enlarge. Chart courtesy of StockCharts.com.
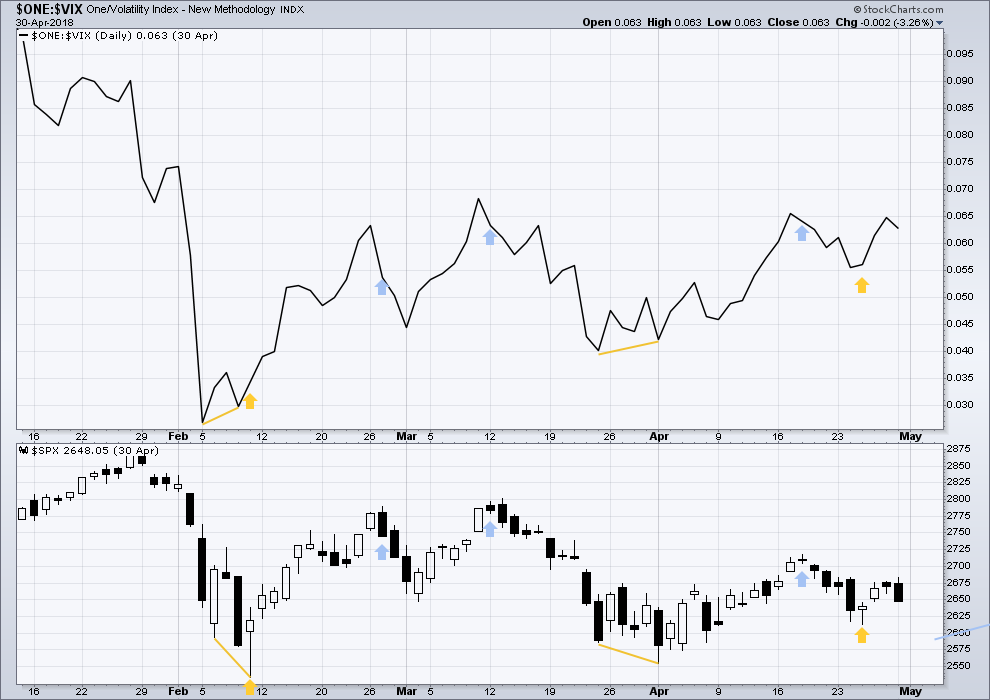
This is a daily chart.
At the two major lows within intermediate wave (4), inverted VIX exhibited single short term bullish divergence.
At highs within intermediate wave (4), inverted VIX exhibited one single day bullish divergence with price.
AD LINE
Click chart to enlarge. Chart courtesy of StockCharts.com.
This is a daily chart.
At the two major lows within intermediate wave (4), there was bullish divergence between price and the AD line. At the two major highs within intermediate wave (4), there was each one instance of single day bearish divergence.
GOLD
Sideways movement continued at the end of the week, which is what the short term expectation was for the Elliott wave count.
Summary: A fourth wave consolidation may end next week; it may reach as low as 1,210, but should not move below 1,207.78. Thereafter, upwards movement may resume towards a short term target about 1,246 (Elliott wave) or 1,281 (classic analysis).
The final target for this bounce to end is at strong resistance about 1,305 – 1,310.
Grand SuperCycle analysis is here.
Last historic analysis with monthly charts is here.
There are four remaining weekly wave counts at this time for cycle wave b: a triangle, a flat, a combination, and a double zigzag.
At this stage, they will now be presented roughly in order of probability. The triangle and the double zigzag wave counts have about an even probability; the combination and flat wave counts now look less likely.
MAIN ELLIOTT WAVE COUNT
WEEKLY CHART – TRIANGLE
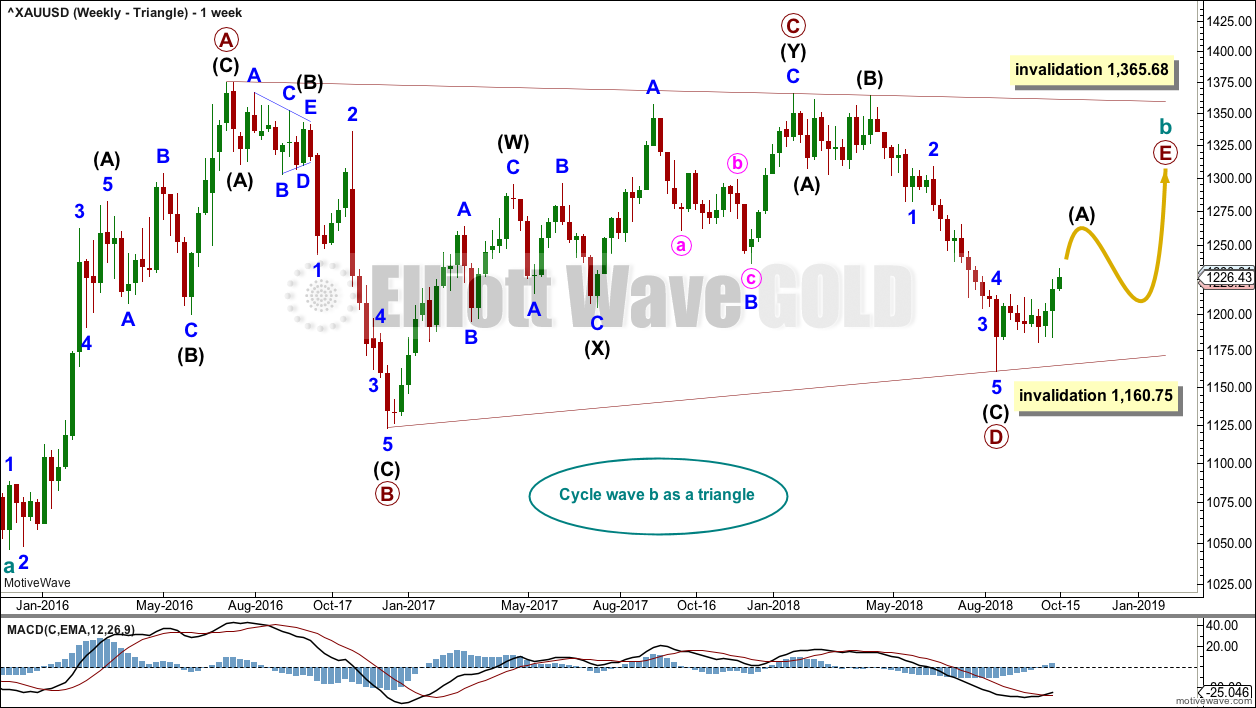
Click chart to enlarge.
Cycle wave b may be an incomplete regular contracting triangle. Primary wave E may not move beyond the end of primary wave C above 1,365.68. Within primary wave E, intermediate wave B may not move beyond the start of intermediate wave A below 1,160.75.
Four of the five sub-waves of a triangle must be zigzags, with only one sub-wave allowed to be a multiple zigzag. Wave C is the most common sub-wave to subdivide as a multiple, and this is how primary wave C for this example fits best. Primary wave E would most likely be a single zigzag. It is also possible that it may subdivide as a triangle to create a rare nine wave triangle.
There are no problems in terms of subdivisions or rare structures for this wave count. It has an excellent fit and so far a typical look.
Primary wave E may now continue higher as a large three wave structure.
DAILY CHART – TRIANGLE
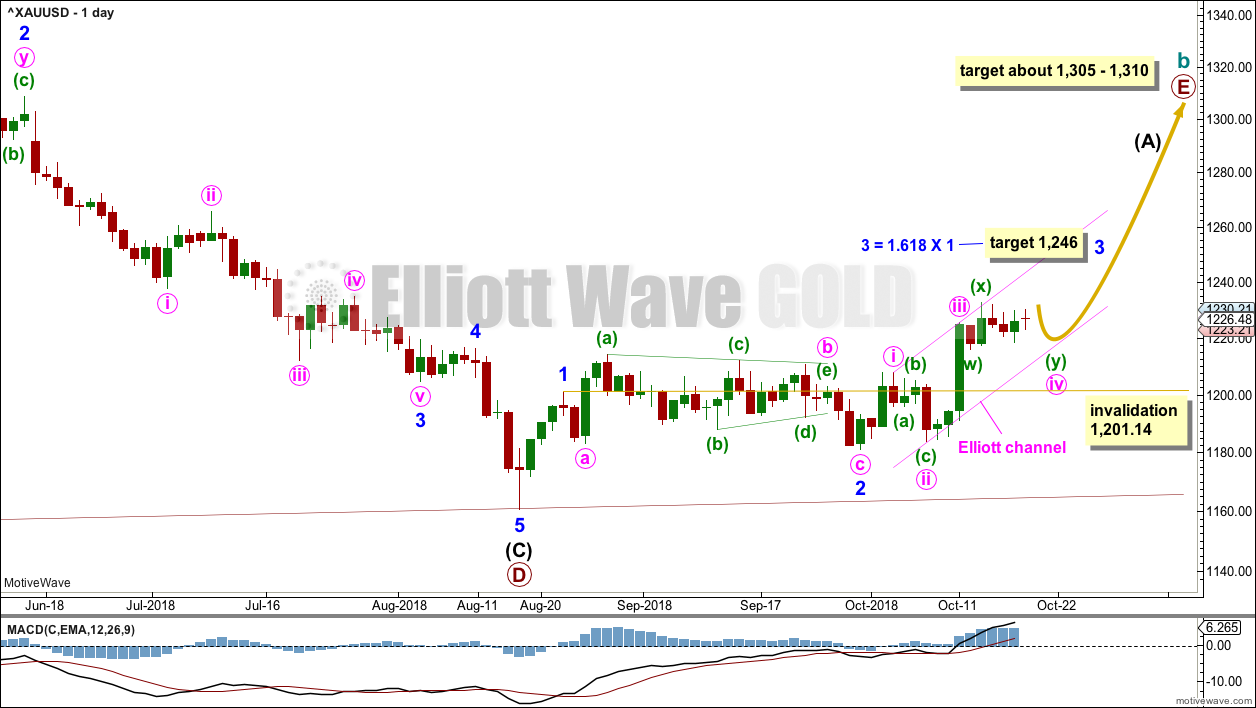
Click chart to enlarge.
Primary wave D may be complete.
Minor wave 1 may have been over on the 22nd of August.
Minor wave 2 may be a complete expanded flat correction.
Minor wave 3 may only subdivide as an impulse. So far that would be incomplete. A target is calculated for minor wave 3 to end using the most common Fibonacci ratio to minor wave 1. The next target would be about 1,287 where minor wave 3 would reach 2.618 the length of minor wave 1. This second target is reasonably close to a classic technical analysis target at 1,281.
Draw an Elliott channel about minor wave 3. Draw the first trend line from the ends of minute waves i to iii, then place a parallel copy on the low of minute wave ii. Minute wave v may end about the upper edge of this channel. If minute wave v exhibits typical commodity like behaviour, then it may be very strong and may end with a strong overshoot of the i-iii trend line.
When the impulse of minor wave 3 may be complete, then a following consolidation for minor wave 4 may not move back down into minor wave 1 price territory below 1,201.14.
A target for primary wave E is the strong zone of resistance about 1,305 to 1,310. Primary wave E is most likely to subdivide as a zigzag (although it may also subdivide as a triangle to create a rare nine wave triangle), and it should last at least a Fibonacci 13 weeks. It may also last a total Fibonacci 21 or 34 weeks. So far it has lasted only 8 weeks. Primary wave E may not move beyond the end of primary wave C above 1,365.68.
WEEKLY CHART – DOUBLE ZIGZAG
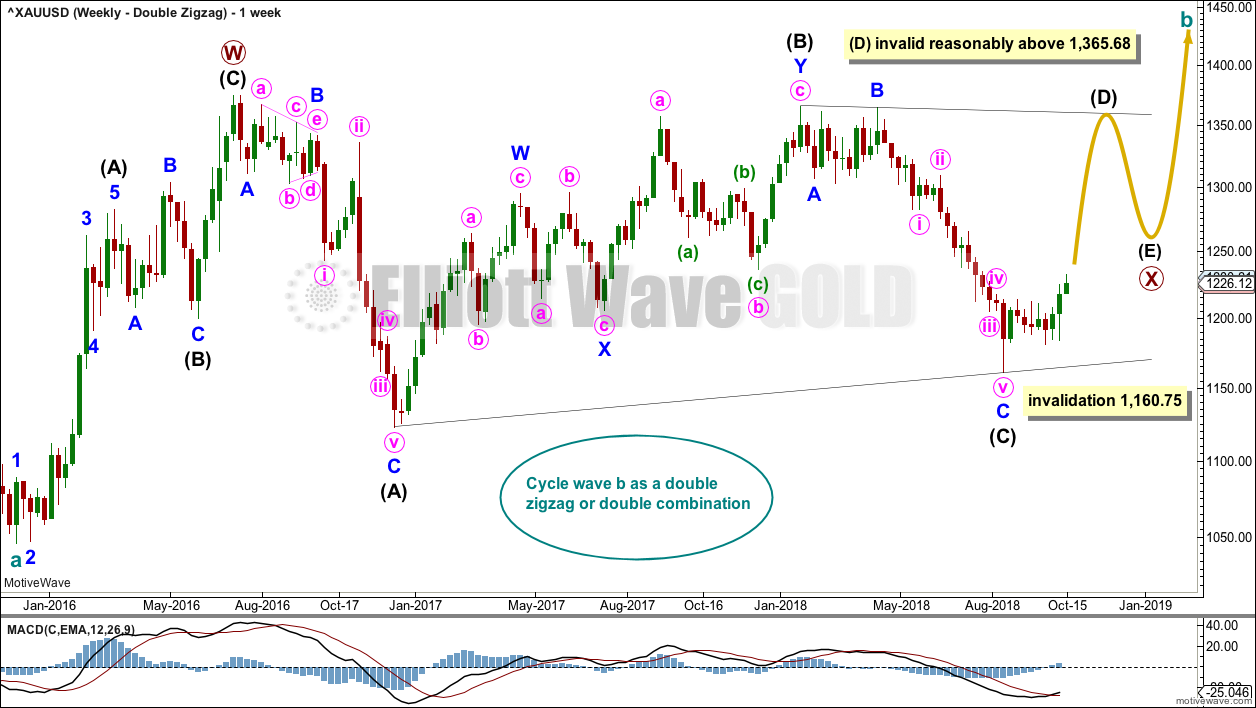
Click chart to enlarge.
It is also possible that cycle wave b may be a double zigzag or a double combination.
The first zigzag in the double is labelled primary wave W. This has a good fit.
The double may be joined by a corrective structure in the opposite direction, a triangle labelled primary wave X. The triangle would be about three quarters complete.
Within the triangle of primary wave X, intermediate wave (C) should be complete. Within intermediate wave (D), minor wave B may not move beyond the start of minor wave A below 1,160.75.
Intermediate wave (D) would most likely subdivide as a single zigzag. The subdivisions at the daily chart level for this wave count would be the same as for the first triangle wave count above; a zigzag unfolding higher would be labelled A-B-C.
This wave count may now expect choppy overlapping movement in an ever decreasing range for several more months.
Primary wave Y would most likely be a zigzag because primary wave X would be shallow; double zigzags normally have relatively shallow X waves.
Primary wave Y may also be a flat correction if cycle wave b is a double combination, but combinations normally have deep X waves. This would be less likely.
This wave count has good proportions and no problems in terms of subdivisions.
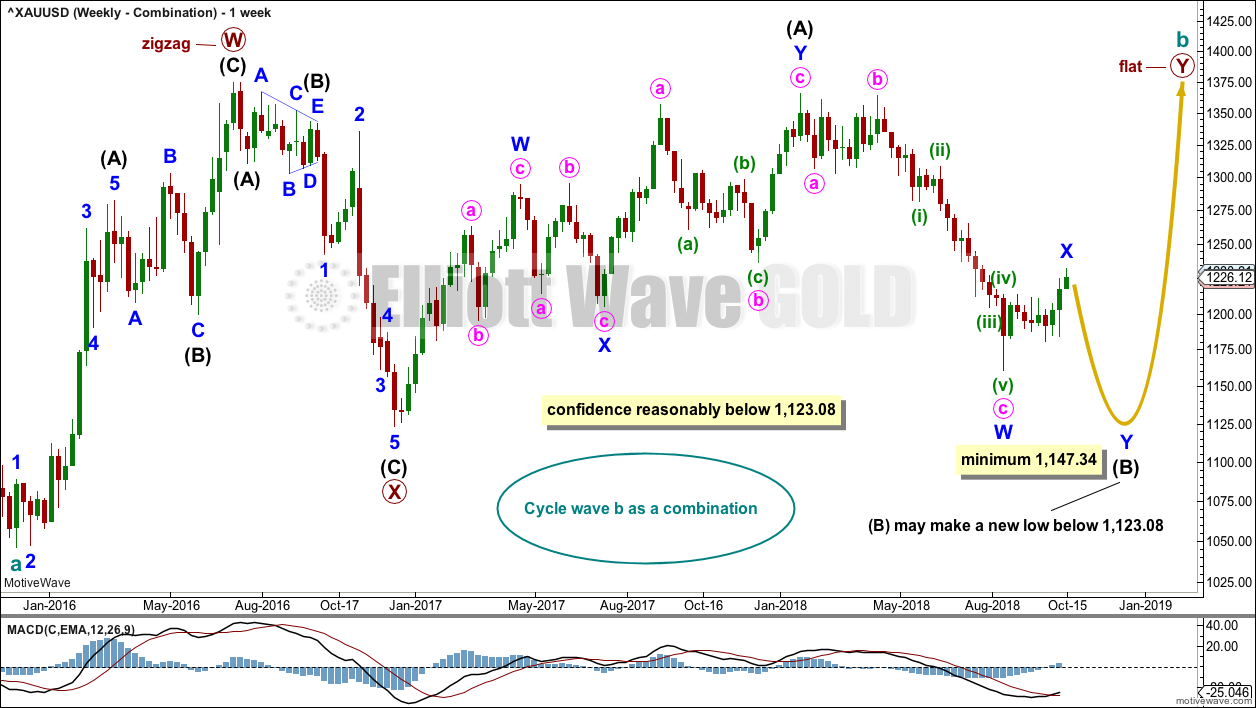
WEEKLY CHART – COMBINATION
Click chart to enlarge.
If cycle wave b is a combination, then the first structure in a double may be a complete zigzag labelled primary wave W.
The double may be joined by a three in the opposite direction, a zigzag labelled primary wave X.
The second structure in the double may be a flat correction labelled primary wave Y. My research on Gold so far has found that the most common two structures in a double combination are one zigzag and one flat correction. I have found only one instance where a triangle unfolded for wave Y. The most likely structure for wave Y would be a flat correction by a very wide margin, so that is what this wave count shall expect.
Within a flat correction for primary wave Y, the current downwards wave of intermediate wave (B) may be a double zigzag. Intermediate wave (B) must retrace a minimum 0.9 length of intermediate wave (A) at 1,147.34. Intermediate wave (B) may move beyond the start of intermediate wave (A) as in an expanded flat.
Because the minimum requirement for intermediate wave (B) is not yet met, this wave count requires that intermediate wave (B) continues lower. This is the most immediately bearish of all four weekly wave counts.
When intermediate wave (B) is complete, then intermediate wave (C) would be expected to make at least a slight new high above the end of intermediate wave (A) at 1,365.68 to avoid a truncation. Primary wave Y would be most likely to end about the same level as primary wave W at 1,374.91, so that the whole structure takes up time and moves price sideways, as that is the purpose of double combinations.
While double combinations are very common, triples are extremely rare. I have found no examples of triple combinations for Gold at daily chart time frames or higher back to 1976. When the second structure in a double is complete, then it is extremely likely (almost certain) that the whole correction is over.
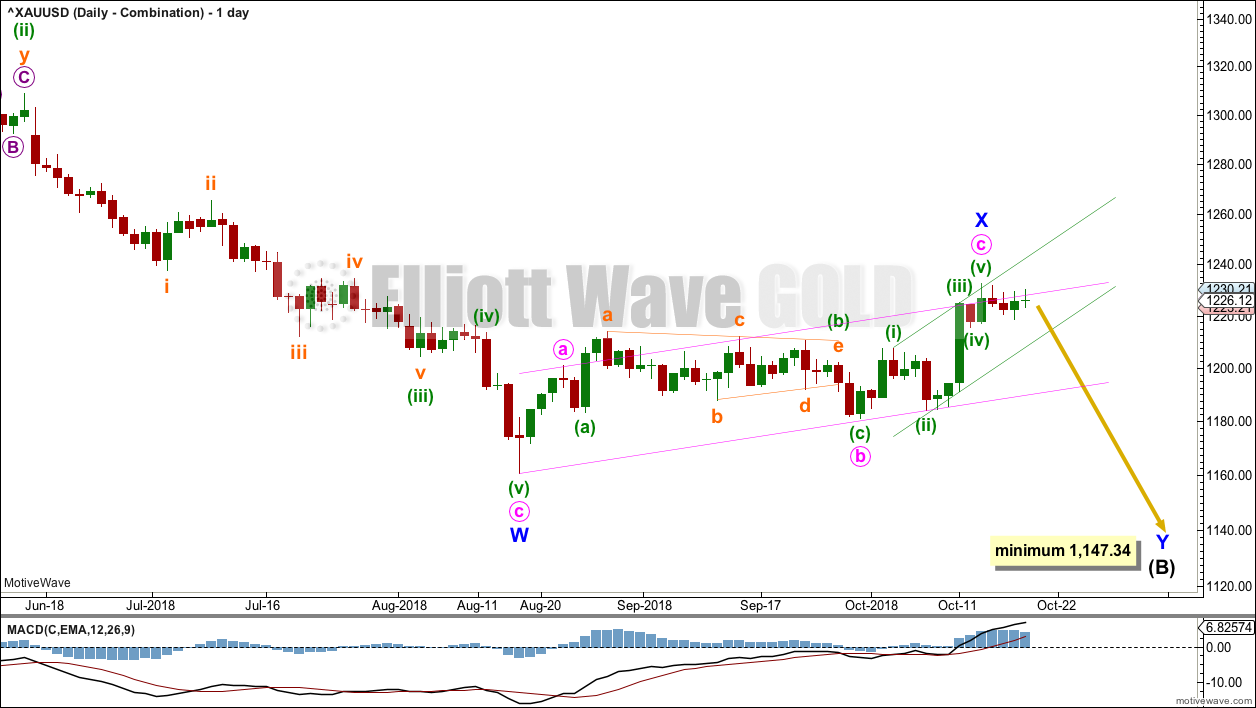
DAILY CHART – COMBINATION
Click chart to enlarge.
Intermediate wave (B) may be unfolding lower as a double zigzag.
The first zigzag may be complete, labeled minor wave W. The double may now be joined by a complete three in the opposite direction, a zigzag labelled minor wave X. X waves within double zigzags are usually fairly shallow and often also reasonably brief.
Minor wave Y must subdivide as a zigzag and must end at or below the minimum requirement of 1,147.34.
This wave count now expects that the upwards breakout on the 11th of October from a consolidation may turn out to be false.
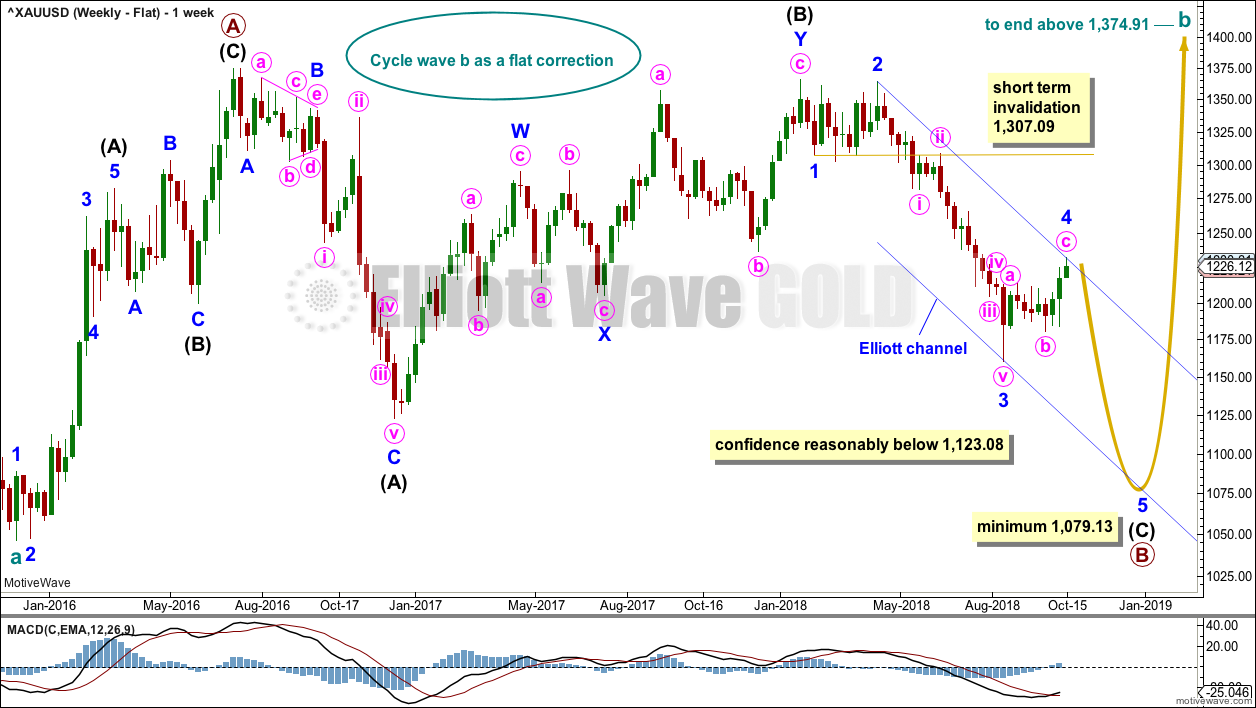
WEEKLY CHART – FLAT
Click chart to enlarge.
It is possible that cycle wave b may be a flat correction. Within a flat correction, primary wave B must retrace a minimum 0.9 length of primary wave A at 1,079.13 or below. Primary wave B may make a new low below the start of primary wave A at 1,046.27 as in an expanded flat correction.
Only a new low reasonably below 1,123.08 would provide reasonable confidence in this wave count.
Intermediate wave (C) must subdivide as a five wave structure; it may be unfolding as an impulse. Within intermediate wave (C), minor waves 1 through to 4 may be complete. If it continues further, then minor wave 4 may not move into minor wave 1 price territory above 1,307.09.
The blue channel is drawn using Elliott’s second technique. Minor wave 5 may end at support about the lower edge of this channel.
Minor wave 2 was a double zigzag lasting nine weeks. Minor wave 4 exhibits little alternation as a single zigzag and reasonable proportion lasting nine weeks.
TECHNICAL ANALYSIS
WEEKLY CHART
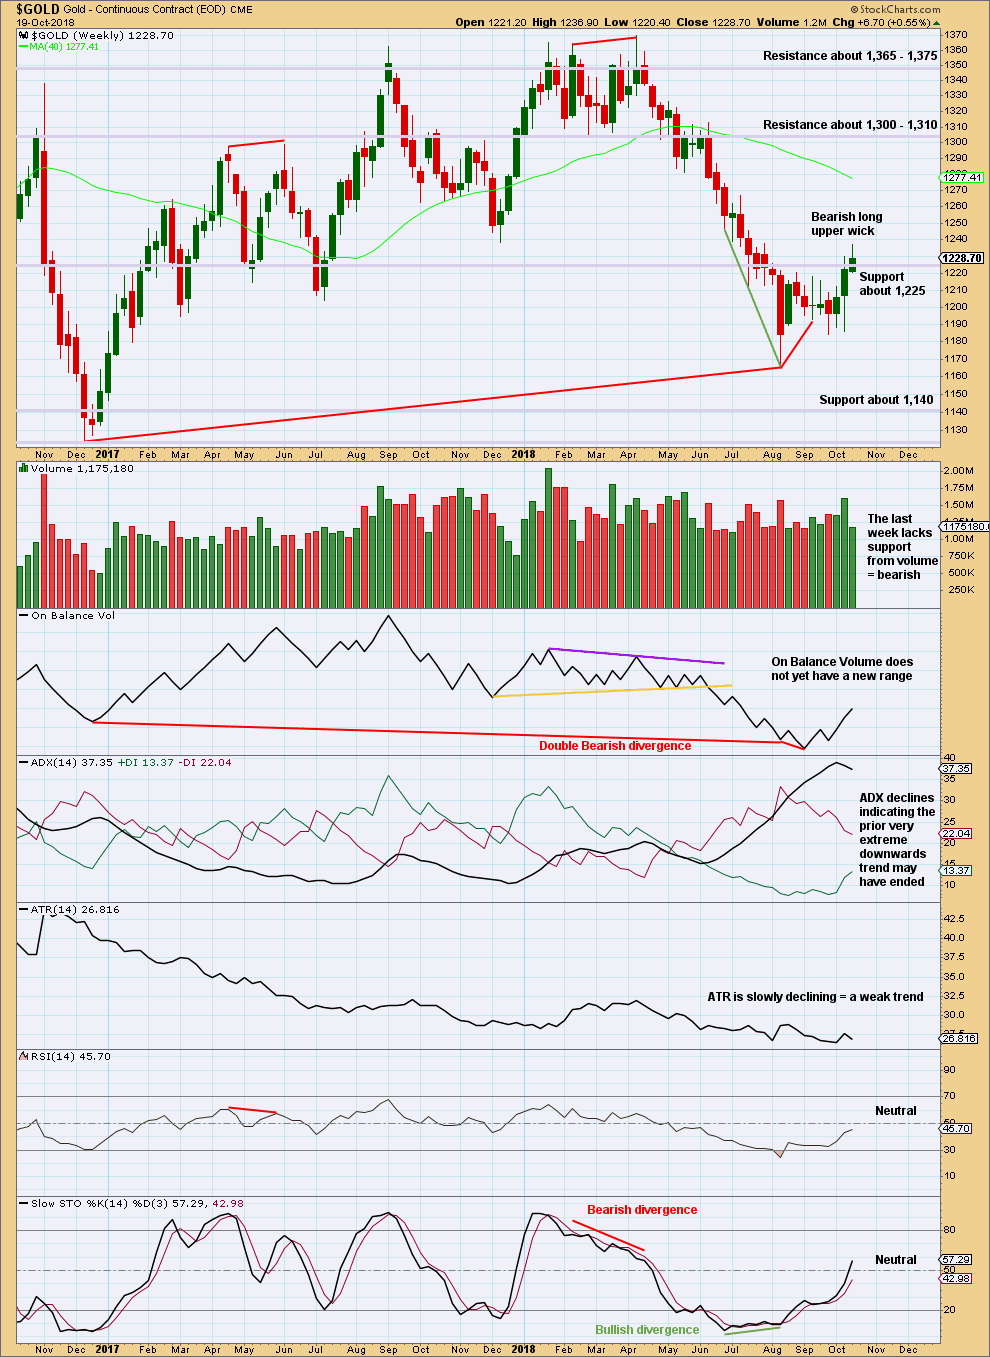
Click chart to enlarge. Chart courtesy of StockCharts.com.
On Balance Volume is lower than its prior point at the end of November 2015. This divergence is extremely bearish but does not rule out a consolidation unfolding here; the divergence does strongly support the Triangle wave count, which expects a consolidation or bounce up to test resistance now and then a continuation of a major bear market. It could also support the flat wave count that allows for a new low below 1,046.27 in coming months.
The short term volume profile and the long upper candlestick are bearish this week. Some downwards or sideways movement next week looks most likely.
DAILY CHART
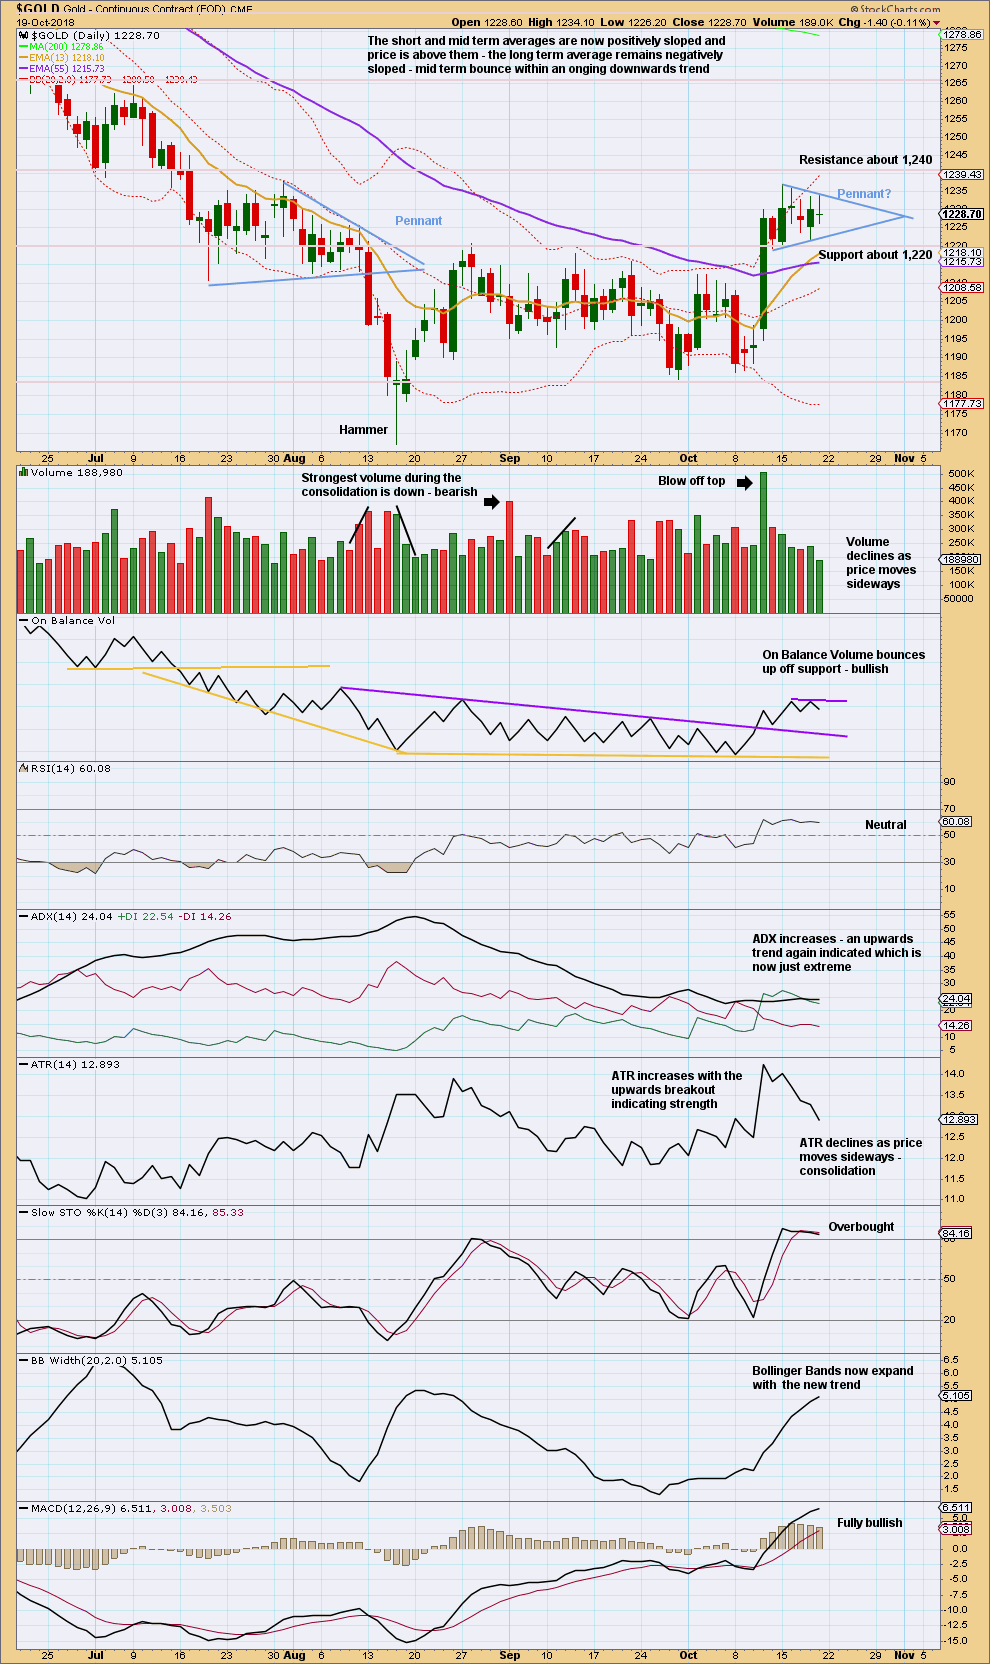
Click chart to enlarge. Chart courtesy of StockCharts.com.
With strong support from volume, last week saw an upwards breakout above resistance at 1,220.
A small pennant pattern may be forming. Using the flag pole, a target is calculated about 1,281. Pennants are reliable continuation patterns. An upwards breakout is expected.
GDX WEEKLY CHART
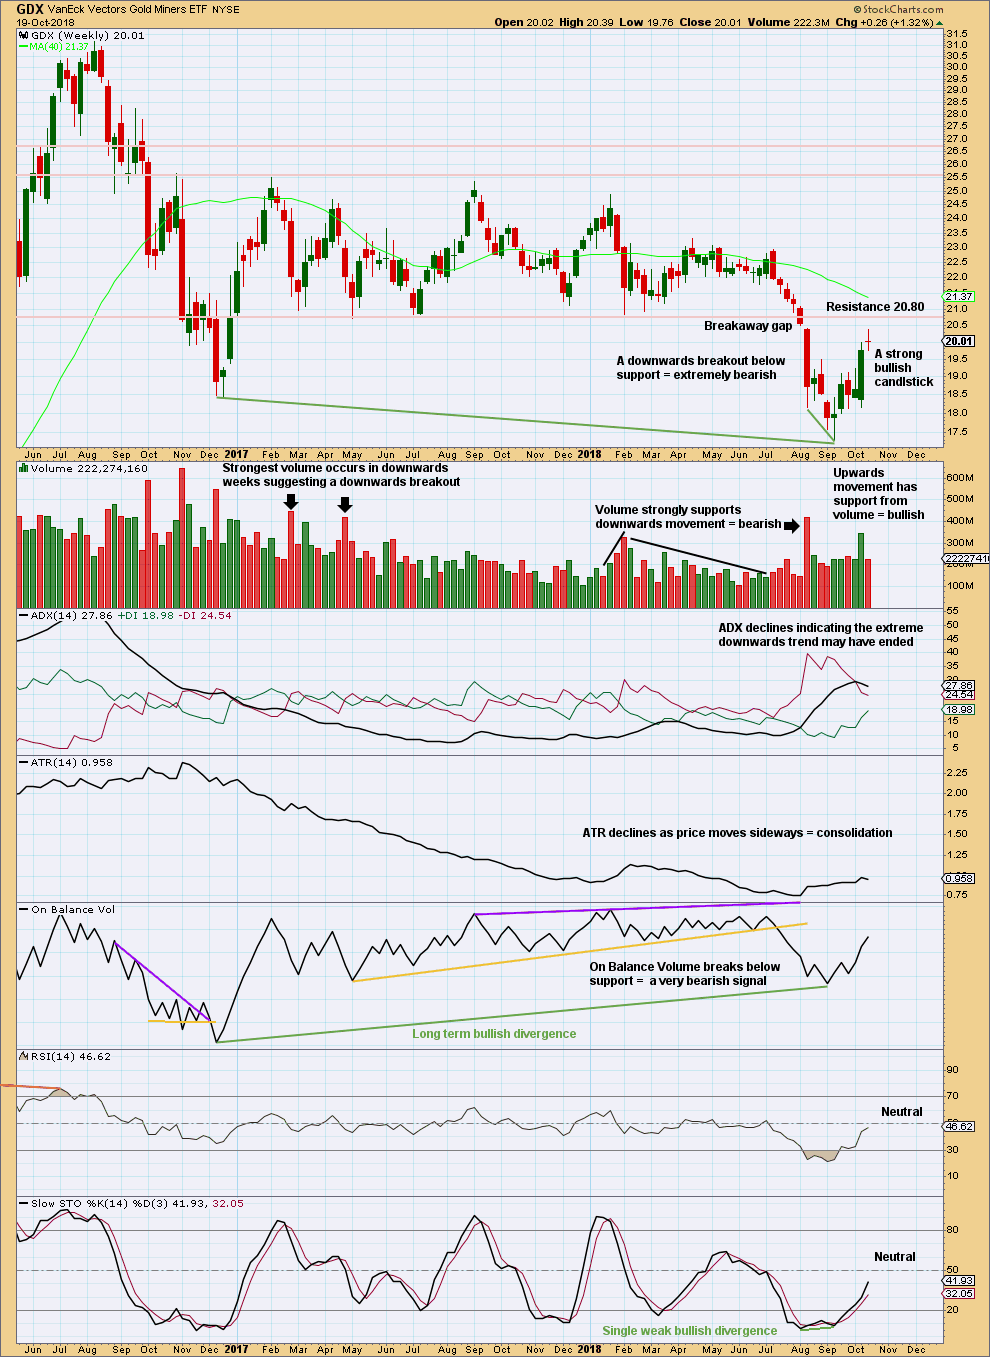
Click chart to enlarge. Chart courtesy of StockCharts.com.
GDX had a large consolidation that lasted from January 2017 to August 2018. A downwards breakout below support at 20.80 in early August 2018 is highly significant. The breakout had support from volume, which adds confidence.
Upwards movement of the last five weeks would most likely be a bounce to backtest resistance at 20.80. If price does reach up to this point, then the probability of a quick turn there and a strong downwards trend is highly likely.
A technical principle is the longer price consolidates, the longer and stronger the resulting trend may be. The downwards trend developing here may last over a year.
A target for the eventual low is about 16.02.
The doji this week puts the short term upwards bounce from bullish to neutral.
GDX DAILY CHART
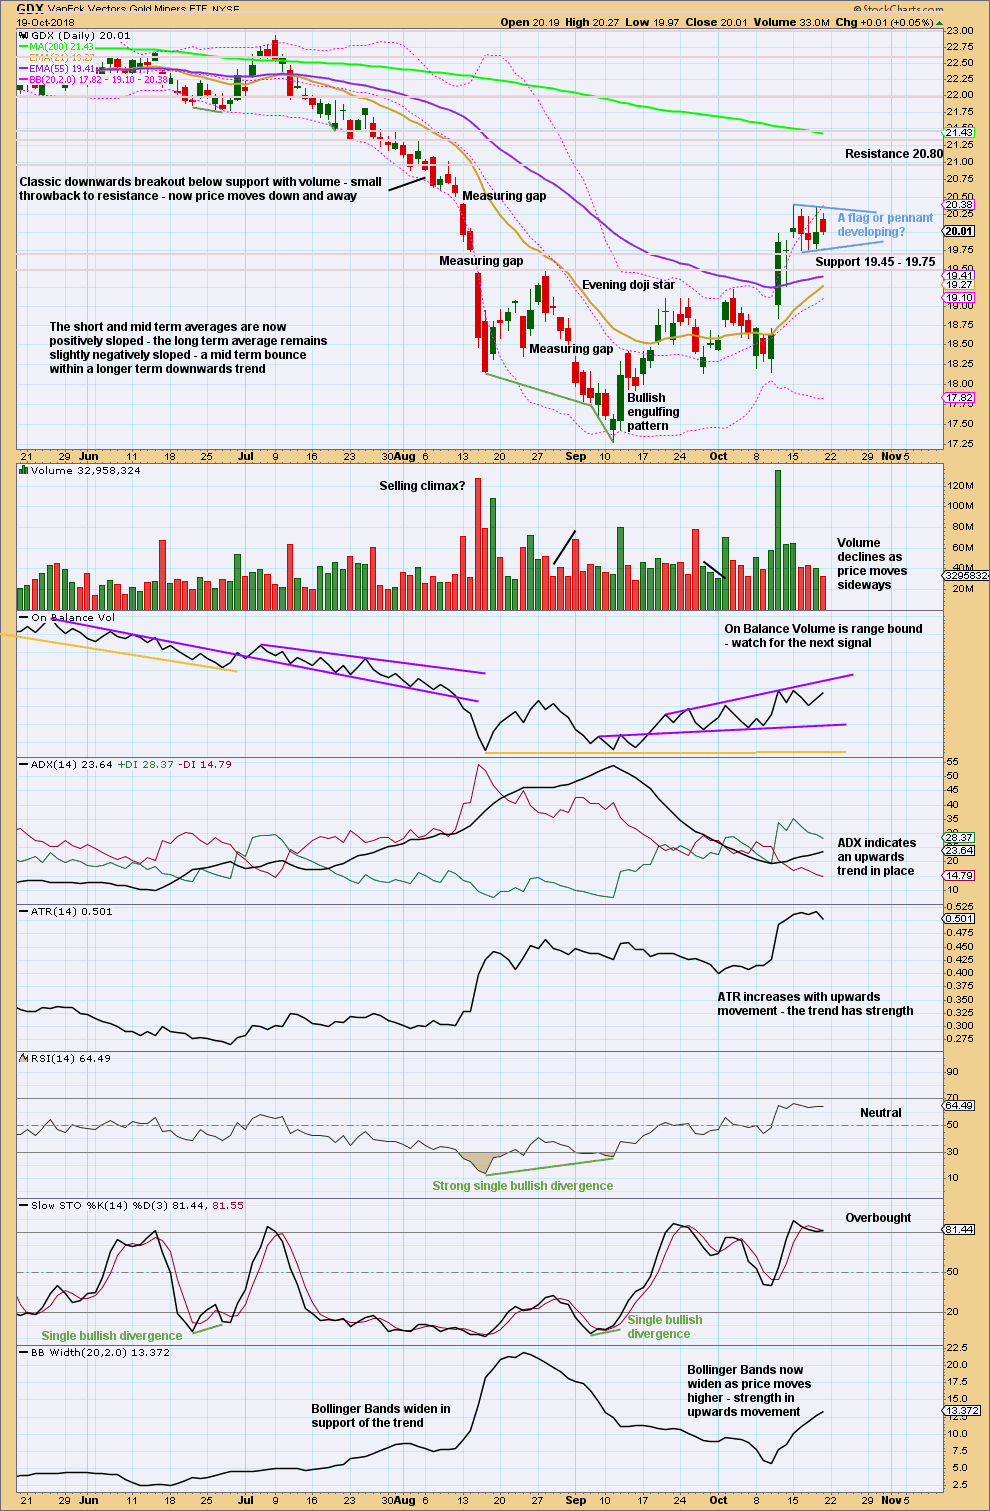
Click chart to enlarge. Chart courtesy of StockCharts.com.
It now looks like GDX may be curving back up to test very strong resistance about 20.80. If it does get up to this point, then that may offer a very good entry point for a short position which may be held for a reasonably long term.
A small flag or pennant may be forming. These are reliable continuation patterns. A target using the flag pole may be about 22.55. This target may be too high though, because there is extremely strong resistance above at 20.80.
US OIL
Sideways and slightly lower movement was expected for the week as a pullback unfolds. Price has moved lower, more than anticipated, but it remains well within the allowable limits for this pullback. Both Elliott wave counts remain valid.
This week volume analysis is used to determine where this pullback may end, and specific trading advice is offered to members.
Summary: Pullbacks may be used as opportunities to join the upwards trend. This pullback may end very soon. Risk is at 66.86; as long as price remains above 66.86, it may be a very good opportunity to enter long positions which may be held for several weeks. A possible profit target is at 106.25, but be prepared to adjust this profit target upwards. Look out for the possibility of blow off top coming in a few weeks.
Members who are prepared to hold an underwater position for a few days may enter here as price is close to 66.86. Members who are not prepared to hold an underwater position may wait a few days; the risk there is that the pullback could be over more quickly than the Elliott wave count expects.
If price makes a new low below 66.86, then the preferred triangle daily chart would be invalidated and the combination daily chart would then have confidence. If this happens, then expect more downwards movement to about 63.60 before the pullback finally ends. If that happens, long positions may be closed for a small loss and another entry opportunity may occur in another week to two.
MAIN WAVE COUNT
MONTHLY CHART
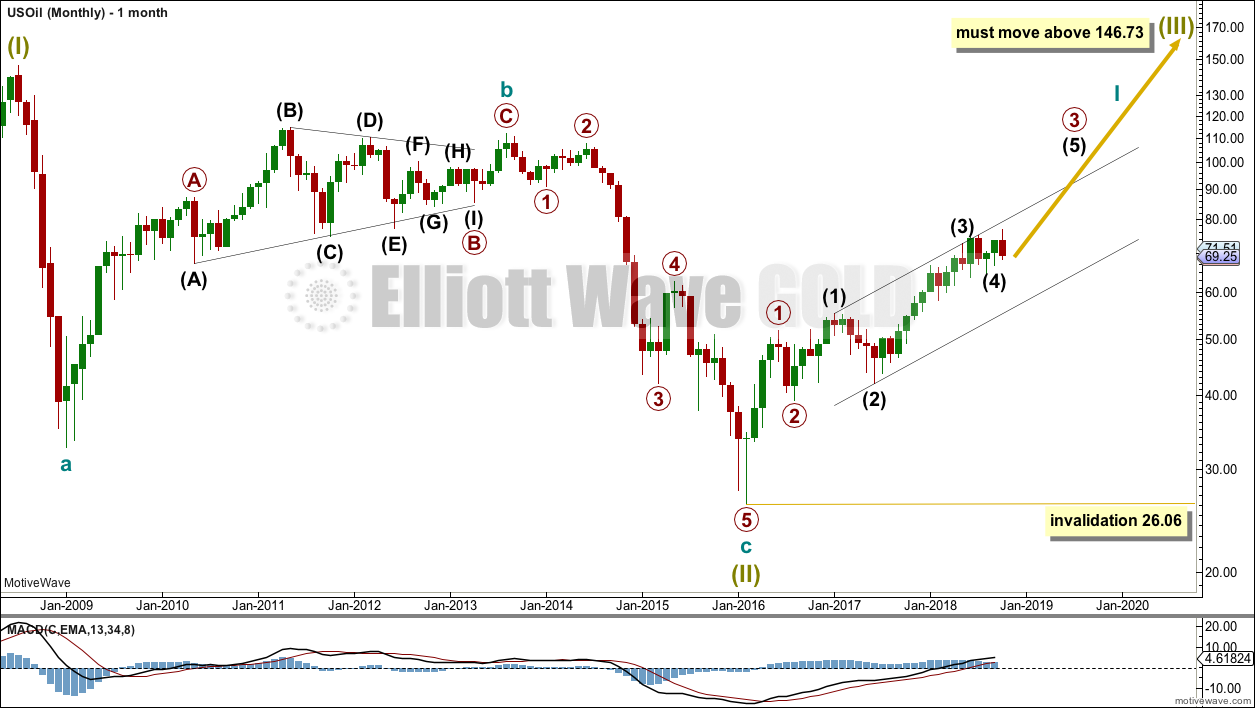
Click chart to enlarge.
The bear market for US Oil looks to be over and a new bull market looks to be in its early stages. The prior bearish wave count has been invalidated, leaving only this very bullish wave count.
A huge zigzag down to the last low may be complete and is labelled here Super Cycle wave (II).
Cycle wave b must be seen as complete in August 2013 for this wave count to work. It cannot be seen as complete at the prior major swing high in May 2011.
Cycle wave b is seen as a zigzag, and within it primary wave B is seen as a running contracting triangle. These are fairly common structures, although nine wave triangles are uncommon. All subdivisions fit.
Primary wave C moves beyond the end of primary wave A, so it avoids a truncation. But it does not have to move above the price territory of primary wave B to avoid a truncation, which is an important distinction.
If cycle wave b begins there, then cycle wave c may be seen as a complete five wave impulse.
Super Cycle wave (III) must move beyond the end of Super Cycle wave (I). It must move far enough above that point to allow room for a subsequent Super Cycle wave (IV) to unfold and remain above Super Cycle wave (I) price territory.
Cycle wave I may be incomplete. It may be unfolding as an impulse and may have now moved through the middle portion. Commodities have a tendency to exhibit swift strong fifth waves, and this tendency is especially prevalent for third wave impulses. Intermediate wave (5) to end primary wave 3 may be very swift and strong, ending with a blow off top.
When cycle wave I is complete, then cycle wave II may be a deep correction that may not move beyond the start of cycle wave I below 26.06.
Data from FXCM for USOil does not go back to the beginning of Super Cycle wave (I). Without an accurate known length of Super Cycle wave (I) a target cannot be calculated for Super Cycle wave (III) to end using Fibonacci ratios. The target for Super Cycle wave (III) may be calculated when cycle waves I, II, III and IV within it are complete. That cannot be done for many years.
WEEKLY CHART
Click chart to enlarge.
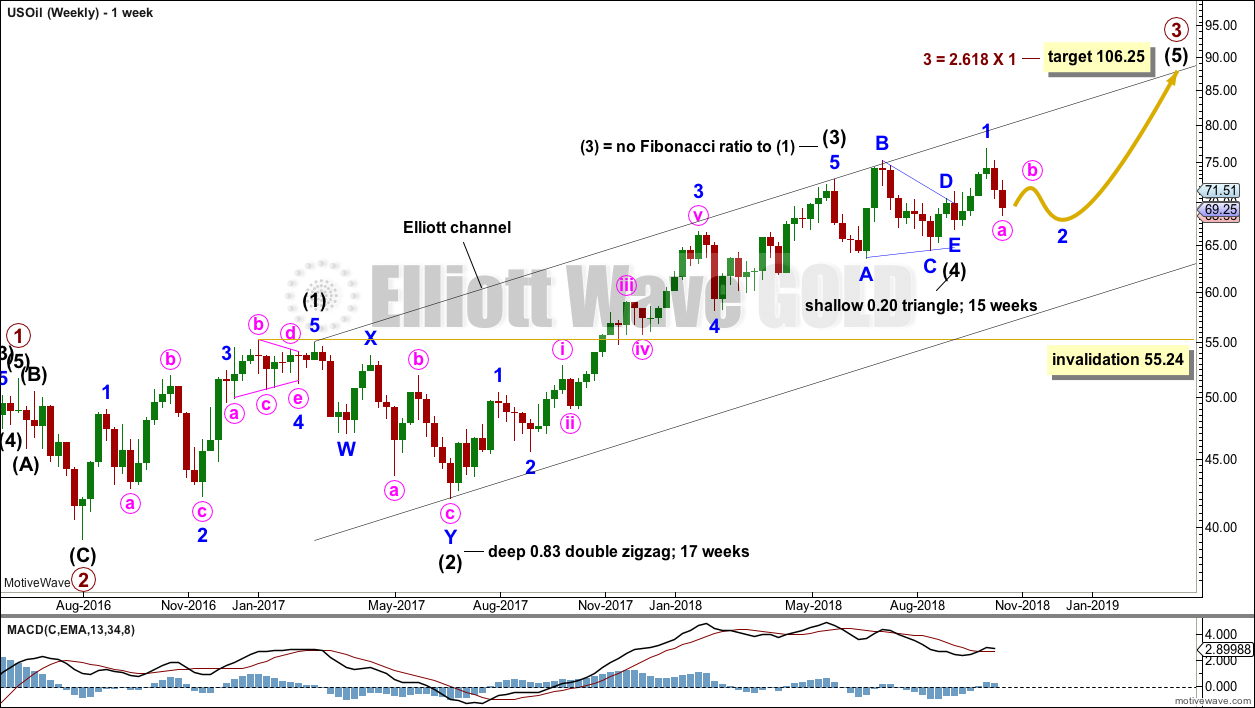
Intermediate wave (3) is now complete. There is no Fibonacci ratio between intermediate waves (1) and (3), and intermediate wave (3) is longer than 1.618 the length of intermediate wave (1).
This wave count fits with classic technical analysis at the monthly and daily chart levels.
Intermediate wave (2) was a deep double zigzag. Given the guideline of alternation, intermediate wave (4) may be expected to most likely be a shallow flat, triangle or combination. It may be about even in duration with intermediate wave (2), or it may be a little longer because triangles and combinations are more time consuming structures.
Intermediate wave (4) may be a complete triangle; this looks most likely. If it continues further, then it may end within another very few weeks as a combination; this now looks less likely.
TRIANGLE
Click chart to enlarge.
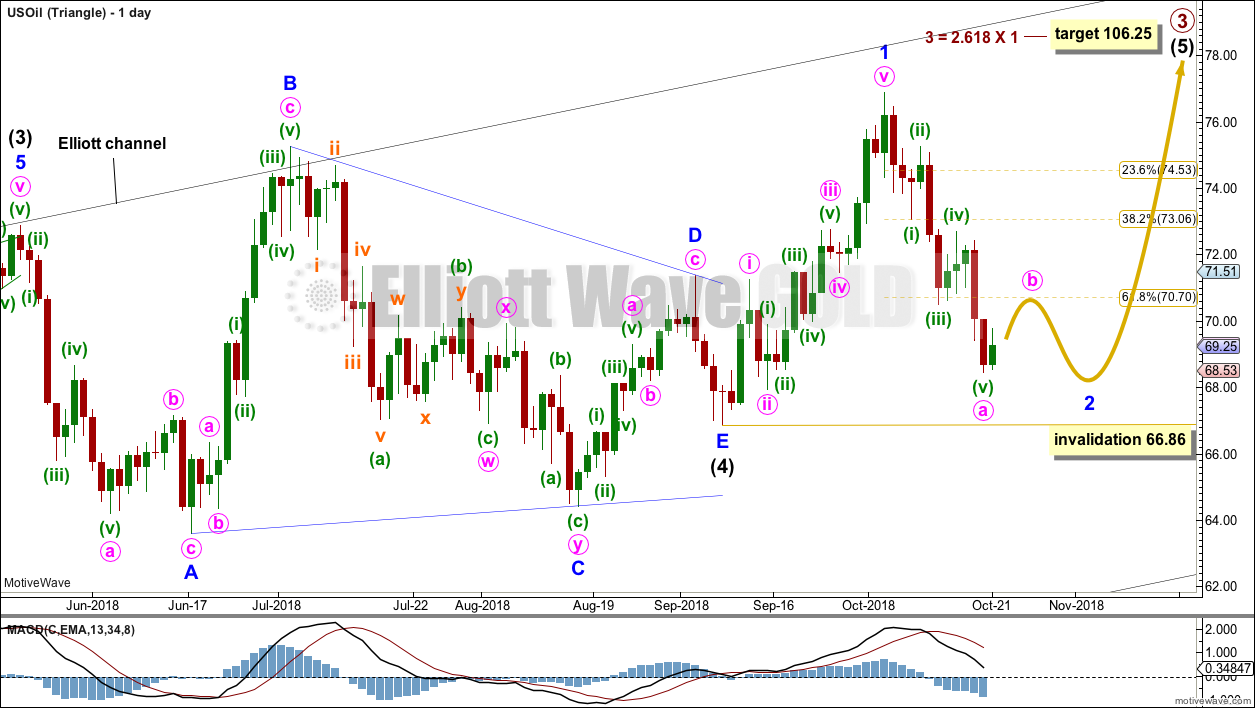
Intermediate wave (4) may be a complete triangle.
All triangle sub-waves subdivide into single or multiple zigzags, with only one sub-wave a more complicated multiple. The final wave of minor wave E ends reasonably short of the A-C trend line.
This triangle meets all Elliott wave rules, but it does come to a rather quick conclusion. This is possible, but it does not have a typical look. The probability is now slightly reduced.
If intermediate wave (4) is complete, then intermediate wave (5) has begun. Within intermediate wave (5), a pullback for minor wave 2 may now continue that may not move beyond the start of minor wave 1 below 66.86.
Minor wave 2 is now deeper than the 0.618 Fibonacci ratio and the structure looks incomplete. It is common for Oil for the first second wave in a new impulse to be very deep indeed, so the depth of minor wave 2 here follows a common pattern for this market.
Within minor wave 2, a small bounce for minute wave b may begin next week. Minute wave b should exhibit reasonable weakness; it should not have support from volume, and it may exhibit bearish divergence at its end. Thereafter, minute wave c should move below the end of minute wave a to avoid a truncation. Minor wave 2 may then have a clear three wave look on the daily chart.
Look for a candlestick reversal pattern to signal the end of minor wave 2. This does not always occur, but it offers confidence in a trend change when it does occur.
It is possible that minor wave 2 could be over at this week’s low. It would now have lasted a reasonable duration and have a normal depth. Minor wave 2 could be relabelled as a double zigzag and the structure would look complete.
COMBINATION
Click chart to enlarge.
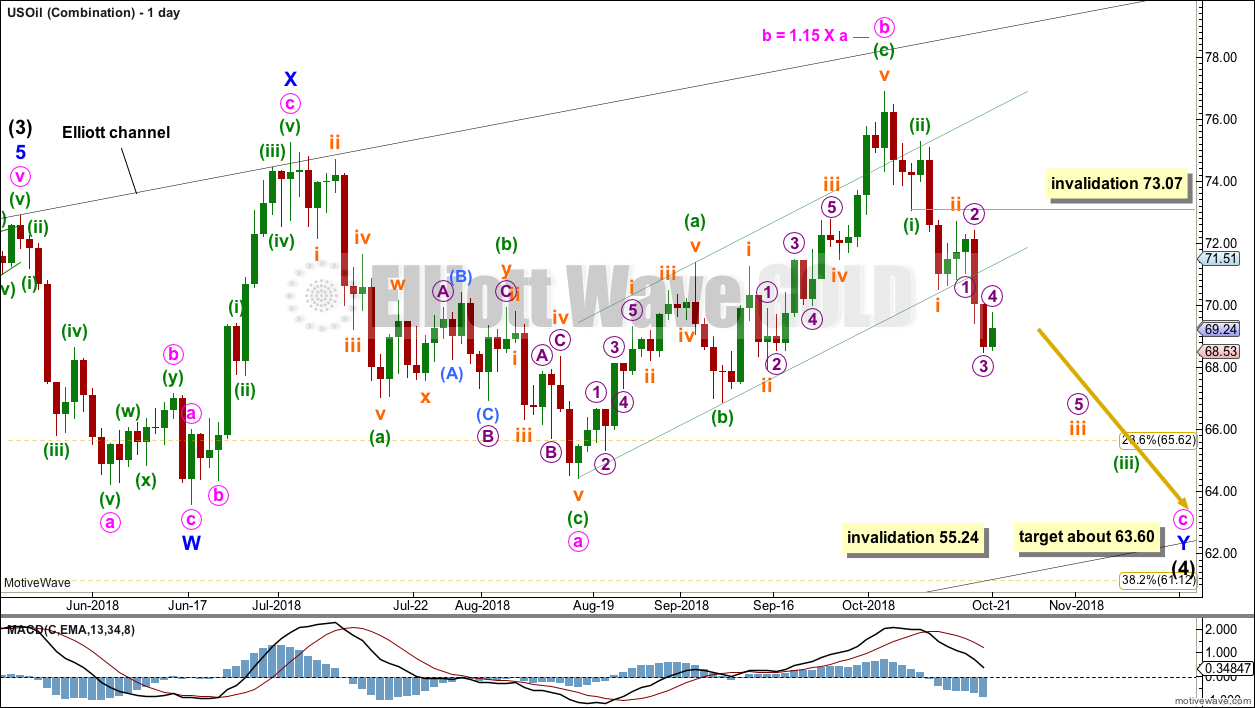
Intermediate wave (4) may be unfolding as a double combination.
The first structure in a double combination may be a complete zigzag labelled minor wave W. There is a little disproportion within minute wave a between the corrections of minuette waves (ii) and (iv), but this is slight enough to be acceptable for this market.
The double is joined by a complete three in the opposite direction, a zigzag labelled minor wave X. X waves within combinations have no minimum nor maximum allowable length, and may make new price extremes beyond the start of wave W as this one does. The only guideline in terms of depth for X waves is that they are normally very deep.
The second structure in a double combination would most likely be a flat correction as the two most common structures in a double combination are one zigzag and one flat.
Within a possible flat correction for minor wave Y, minute wave a looks like a completed three. Minute wave b has now met the minimum 0.9 length of minute wave a, and it has moved beyond the start of minute wave a, indicating an expanded flat. Minute wave b is within the common range of 1 to 1.38 times the length of minute wave a. Expanded flats are very common structures.
Minute wave c would be extremely likely to end at least slightly below the end of minute wave a at 64.43 to avoid a truncation and a very rare running flat.
The purpose of the second structure in a double combination is to take up time and move price sideways. To achieve this purpose minor wave Y would be most likely to end about the same level as minor wave W about 63.60.
Minute wave c must subdivide as a five wave structure, most likely an impulse. Within the impulse, so far minuette waves (i) and (ii) may be complete. Minuette wave (iii) may now be underway and may have just passed its middle strongest portion this week. Minuette wave (iv) may not move into minuette wave (i) price territory above 73.07.
If price moves below 66.86 by any amount at any time frame, then this would be the only remaining daily wave count.
TECHNICAL ANALYSIS
MONTHLY CHART
Click chart to enlarge. Chart courtesy of StockCharts.com.
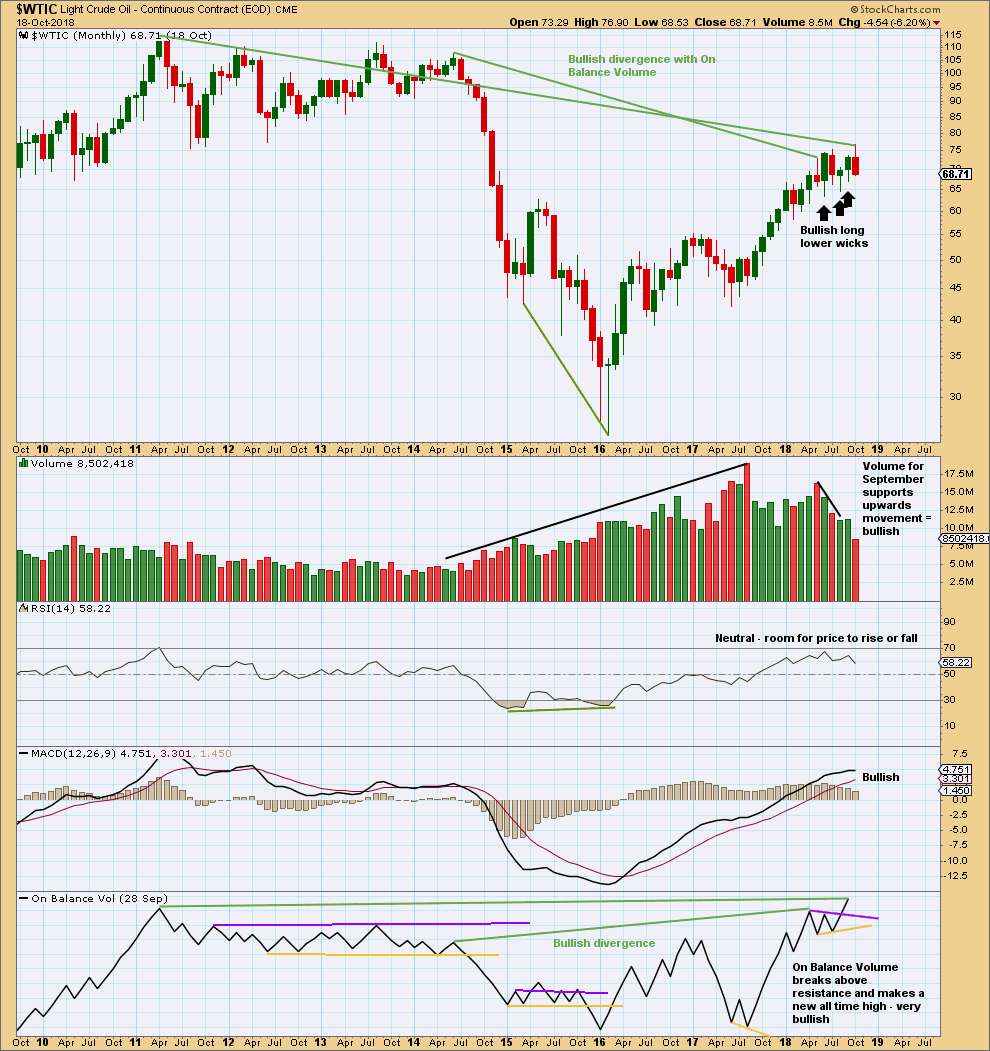
The larger trend remains upwards.
The last three months have seen price move sideways. Three long and lower monthly wicks are bullish. Now September shows support from volume for upwards movement; the short term volume profile is now bullish.
On Balance Volume gives a bullish signal, breaking above resistance. On Balance Volume has also made a new high above the prior high of May 2011. As On Balance Volume should be read as a leading indicator, price may follow through with a new high above May 2011’s high.
WEEKLY CHART
Click chart to enlarge. Chart courtesy of StockCharts.com.
It is upwards weeks during the consolidation that have strongest support from volume. This looks like a continuation pattern. The breakout would most likely be upwards.
The short term volume profile remains slightly bullish. There is room for price to fall further. Support below remains at about 64.
DAILY CHART
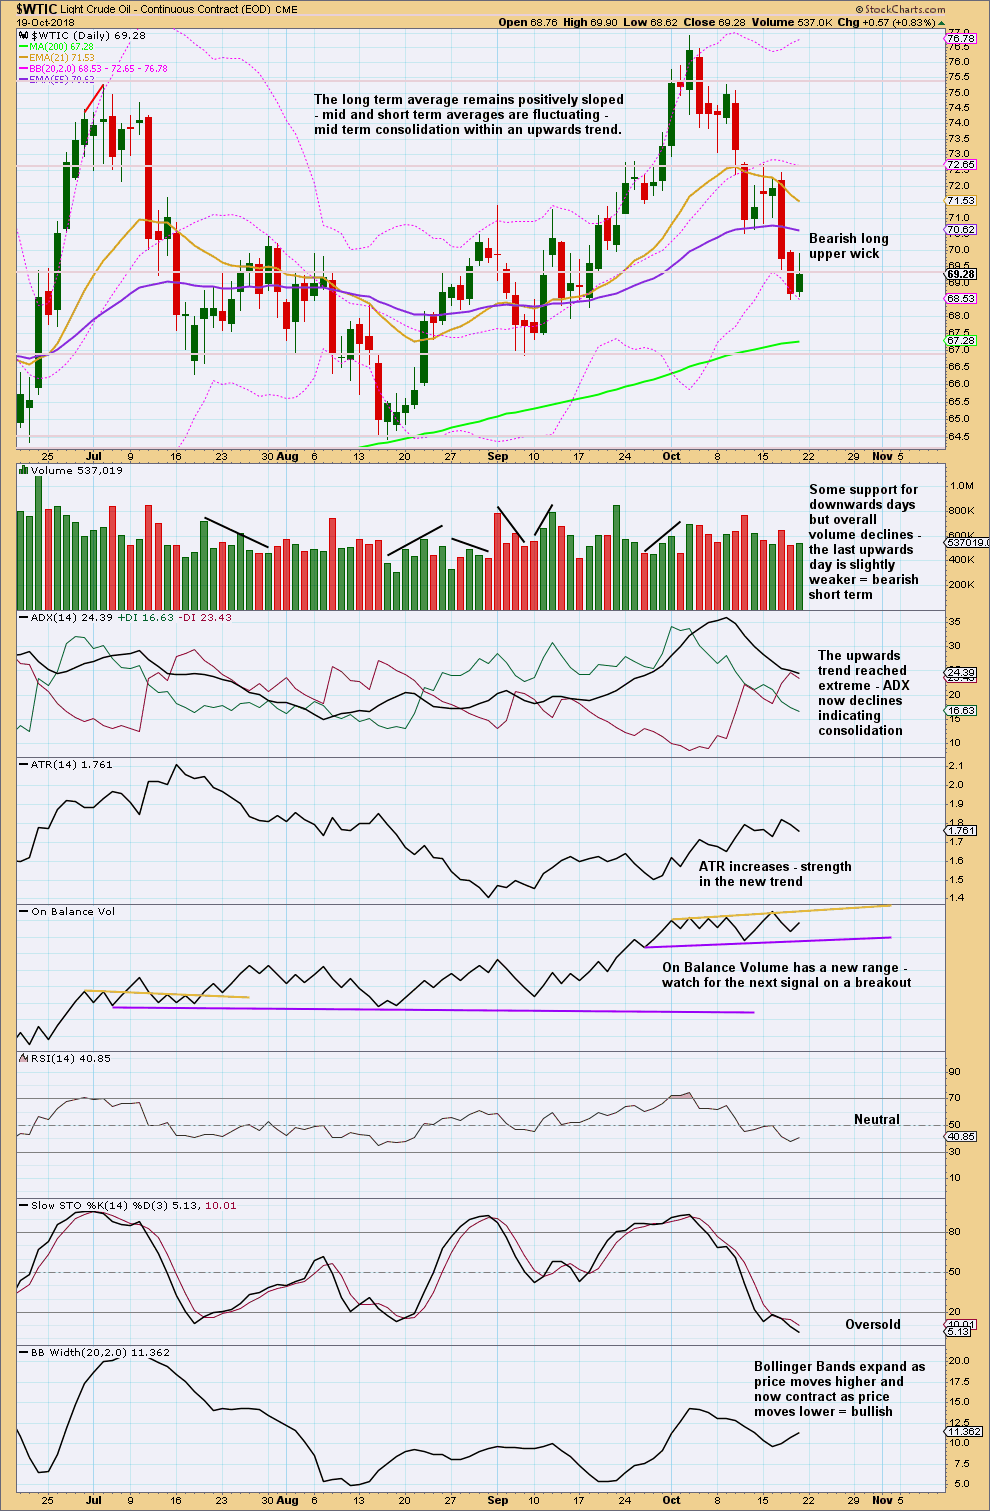
Click chart to enlarge. Chart courtesy of StockCharts.com.
Support below may be found at the 200 day moving average. The short term volume profile remains slightly bearish. Upwards movement for Friday exhibits some weakness; it looks most likely that Monday may see price move lower.
Downwards movement may now be limited: Stochastics is oversold and price is close to support. Look for this pullback to end very soon.
—
Always practice good risk management as the most important aspect of trading. Always trade with stops and invest only 1-5% of equity on any one trade. Failure to manage risk is the most common mistake new traders make.
Updated daily charts for the S&P with a new target, look now for support about 2,600 if price keeps falling.
Short term the failure to close today’s opening gap down makes it look like another breakaway gap. Short term this is bearish.
Alternate idea.
I’m going to slightly favour the first idea published above, but when this session is closed volume data may assist to determine probability.
Thanks Lara! But can wave C be shorter than A??? If not – A is 2940-2600 approx 340 points ☝️so we do not know where B will be ending but if around 2750 then C should go deeper closer to 2400 or even 2300 way in bear market territory☝️🤷🏼♂️ I mean that C wave sell off will probably be more severe than wave current wave A☝️☝️☝️🤷🏼♂️🤷🏼♂️🤷🏼♂️??? Could you also update your wave count for USD as it seems it hit new high last week☝️
Lara hi! Still no reversal candle in SP…. it seems we are having either bear market coming or ABC correction in wave four which will go very deep low way below 2500….?? Because now the length of A is already staggering and C should be longer than A…🤷🏼♂️
I will have two counts for the S&P today. One bullish, one bearish.
I’m now looking for support at the lower edge of the teal channel, and I’m expecting that if price does get that low that really should be the end of it.
Yes, this is now oversold. At yesterday’s close there was still bullish divergence between price and RSI, which is usually a fairly reliable indication of a low in place.
But price keeps falling. This first wave down within primary wave 4 is proving extremely difficult to find an end.
Hi Laura, Any further comments on the SPX here? Price seems to have dropped below your lower target but also seems over sold now.
Hi Lara,
At 2656, the S&P 500 sliced through your targets pretty quickly. Is it possible that a different wave count is applicable like having Primary Wave 4 finishing either today or tomorrow? I know that you want this correction to show in the weekly and monthly charts but the magnitude of it is already big.
The weekly OBV is strongly going lower…
It might setup for a weak primary wave 5 to just eclipse the high in September… is this possible?
Thanks very much for your incredible analysis.
Mathieu
Sorry I noticed it was the Daily OBV (not the weekly).
The correction that we are seeing now looks very similar to the correction of August of 2007 (see chart).
You will see that the S&P 500 reached the top 2 months later in 2007…. There might be a chance that we might see a similar pattern for this period and reach the top at Christmas time if we get that minimum of 4 months for Negative breath.
Lara, what do you think? Is it possible that Intermediate C wave was the October slide and the end of Primary wave 4?
Thanks
Mathieu
In my opinion, there’s nothing to invalidate the higher degree wave counts presented. Although we have had a severe wave A down, we can’t assume a zig zag so we may have reached a price extreme for wave 4s entire structure (in a flat for example). But I am looking fwd to this weekend’s analysis.
I always surprise myself on how caught up I get emotionally when the markets slump. Prechter has a very interesting book on aggregate social mood and herding instinct that drives market movements. His theories come to mind when we swing hard one way or the other.
Agreed…. I am just challenging the wave count… I cannot see it as an invalid wave count since it fits. I was saying that it is possible that we have already reached wave 4. I found that if this is only wave A, I couldn’t imagine having wave C to be much smaller in length to keep the whole structure inside the Elliott wave channel. The selloff of 2 weeks ago and the one this week were pretty sharp and sliced through Lara’s targets very easily…
Either we get wave B next OR a short Primary wave 5 with a target of 2950…. Maybe I am wrong. CNBC said that 43% of the S&P 500 is down more than 20% from their highs… So I can imagine that the market breath is deteriorating quickly and we should have bearish divergence in the AD line by December…. It would fit Lara’s analysis of at least 4 months of bearish divergence in the AD line.
Technically possible, yes. But that would see primary wave 4 remarkably brief.
It has to start at the last all time high on 21st September.
If it’s ending just now, it would have lasted only just over 4 weeks. That’s way too short.
Thanks Lara… I appreciate it.
Hi Laura,
Could you please help to explain why you are using 2.618 x primary wave 1 to calculate the target (106.25) for primary wave 3? What about using the ratio of 1.618 x primary wave 1 which gives us the target of 80.58?
Thanks.
That’s a really good question.
It could be only 1.618. But from my experience with this market, because that price point is now very close, it’s likely to be longer than that. At 80.69 (I round the .005 up) intermediate (5) would be quite short and end only slightly above the price territory of intermediate wave (4).
Now, that’s entirely possible. But what is much more likely for Oil is that intermediate wave (5) is going to be longer and likely very strong indeed.
Commodities have a tendency to swift strong fifth waves. This tendency is especially prevalent for fifth waves to end third wave impulses one degree higher. Which is the situation setting up here.
Updated weekly chart for Oil:
The triangle is invalidated. The combination is now the only valid structural option I can see for US Oil.
I am now expecting more downwards movement to at least slightly below 64.43, most likely to end about 63.60.
This should happen this week.
Updated daily chart:
This is the only daily wave count remaining valid.
Use the best fit channel. If price reaches 64.43 or below then look for a subsequent breach of the channel to indicate a trend change and the end of intermediate (4).
Thank you for the update Lara 🙂
You’re welcome 🙂
Yes, thanks for the mid week input,
Lara,
Not sure if the long term Google uptrend line is of value any longer. I believe it has been breached.
Thanks.
Oh yeah, you’re right!
Well, it’s still of value. A breach of Google’s “Forever” trend line is pretty bearish.