

S&P 500
A new low indicated further downwards movement. The target at 2,612 was not met.
Summary: A new high above 2,722.20 and a breakout of the best fit channel would indicate a low is in place. At that stage, a multi week bounce may be expected to continue towards about 2,878 and likely higher.
A new low below 2,629.16 would indicate more downwards movement. The target is now at 2,544.
A primary degree correction should last several weeks and should show up on the weekly and monthly charts. Primary wave 4 may total a Fibonacci 8, 13 or 21 weeks. Look for very strong support about the lower edge of the teal trend channel on the monthly chart.
Primary wave 4 should be expected to exhibit reasonable strength. This is the last multi week to multi month consolidation in this ageing bull market, and it may now begin to take on some characteristics of the bear market waiting in the wings.
The final target for this bull market to end remains at 3,616, which may be met in October 2019.
The biggest picture, Grand Super Cycle analysis, is here.
Last published monthly chart is here, video is here.
ELLIOTT WAVE COUNT
WEEKLY CHART
Click chart to enlarge.
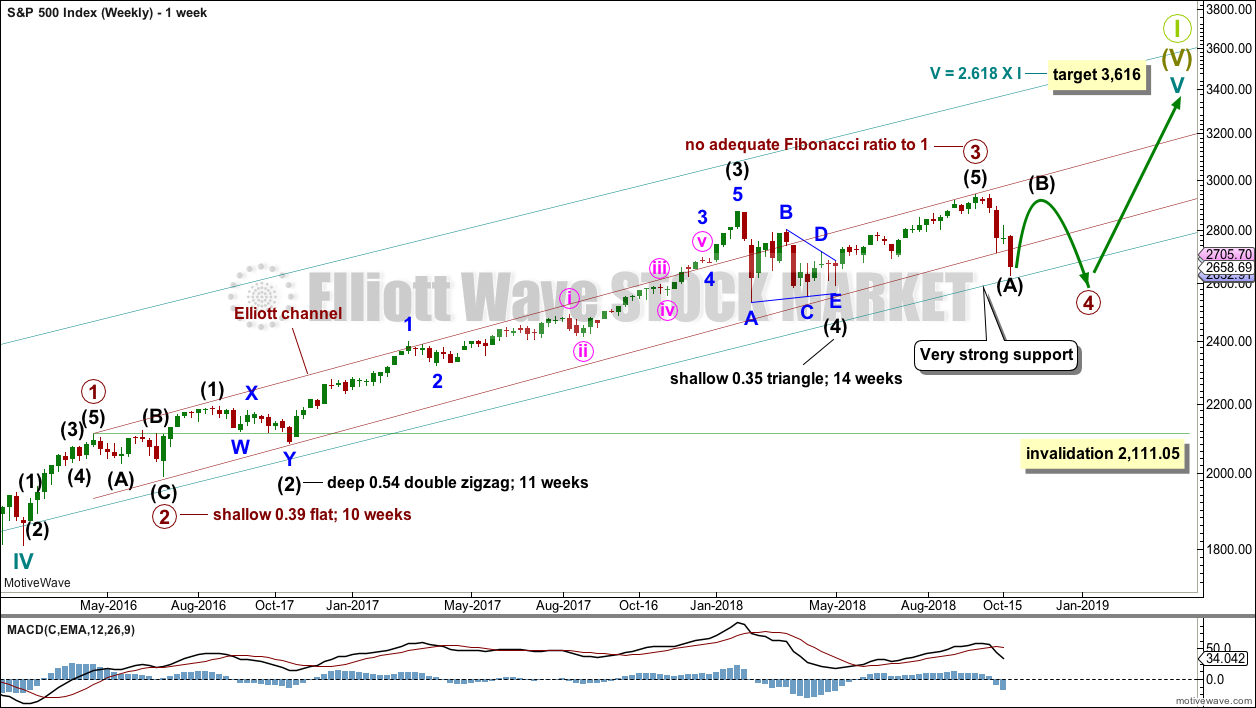
Cycle wave V must complete as a five structure, which should look clear at the weekly chart level and also now at the monthly chart level. It may only be an impulse or ending diagonal. It is clear it is an impulse.
Within cycle wave V, the third waves at all degrees may only subdivide as impulses.
Within primary wave 3, there is perfect alternation and excellent proportion between intermediate waves (2) and (4).
The channel is now drawn about primary degree waves. The first trend line is drawn from the ends of primary waves 1 to 3, then a parallel copy is placed upon the low of primary wave 2. The overshoot of the upper edge of this channel by the end of intermediate wave (3) looks typical. For the S&P, its third waves are usually the strongest portion of an impulse; they often exhibit enough strength to overshoot channels.
Primary wave 4 now has an overshoot on the lower edge of the channel. This is acceptable; fourth waves are not always neatly contained within channels drawn using this technique.
Now that primary wave 4 has broken out of the narrow maroon channel, it may find very strong support about the lower edge of the teal channel. This channel is copied over from the monthly chart and contains the entire bull market since its beginning in March 2009. While Super Cycle wave (V) is incomplete, this channel should not be breached.
Primary wave 4 may not move into primary wave 1 price territory below 2,111.05.
When primary wave 4 may be complete, then the final target may be also calculated at primary degree. At that stage, the final target may widen to a small zone, or it may change.
At this stage, the expectation is for the final target to be met in October 2019. If price gets up to this target and either the structure is incomplete or price keeps rising through it, then a new higher target would be calculated.
DAILY CHART
Click chart to enlarge.
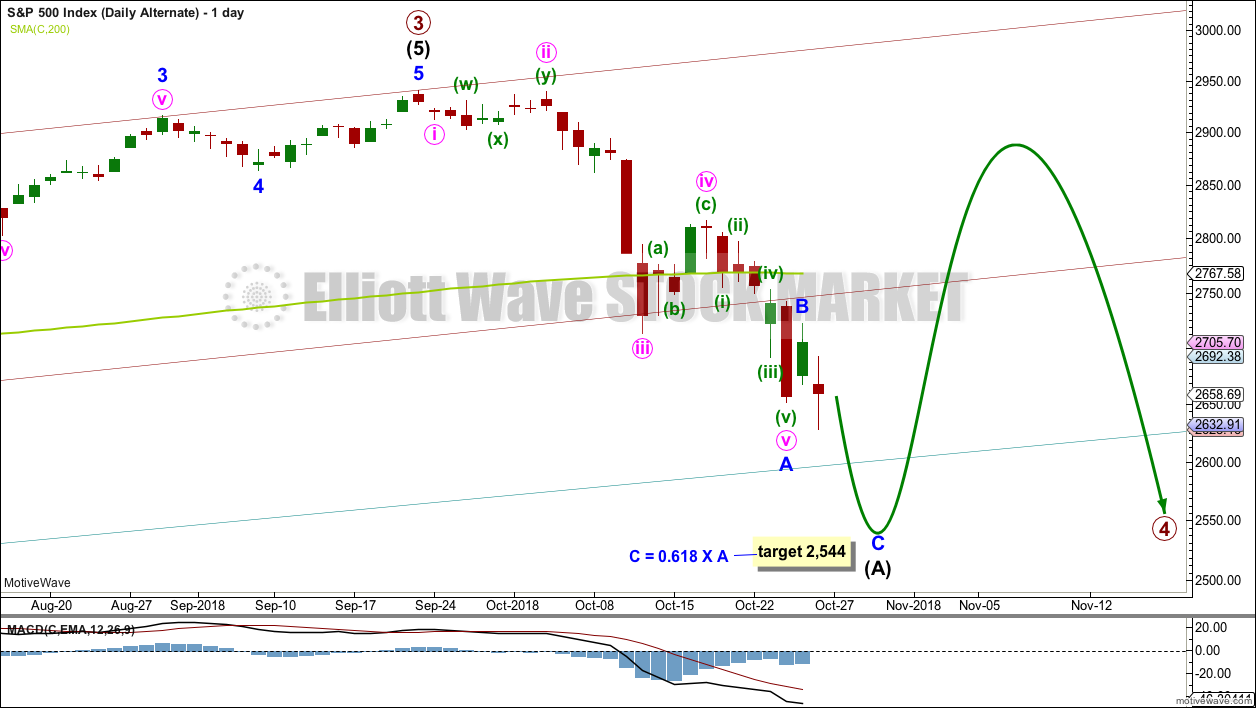
Primary wave 4 would most likely end somewhere within the price territory of the fourth wave of one lesser degree. Intermediate wave (4) has its price territory from 2,872.87 to 2,532.69. Within this range sit the 0.236 Fibonacci ratio at 2,717 and the 0.382 Fibonacci ratio at 2,578.
The 0.382 Fibonacci ratio would expect an overshoot of the teal channel. This may be too low; price may find support at the lower edge of the channel. However, as primary wave 4 should be expected to exhibit reasonable strength, it may be able to overshoot the channel and that would look reasonable. This possibility is now more seriously considered.
Primary wave 2 unfolded as a shallow regular flat correction lasting 10 weeks.
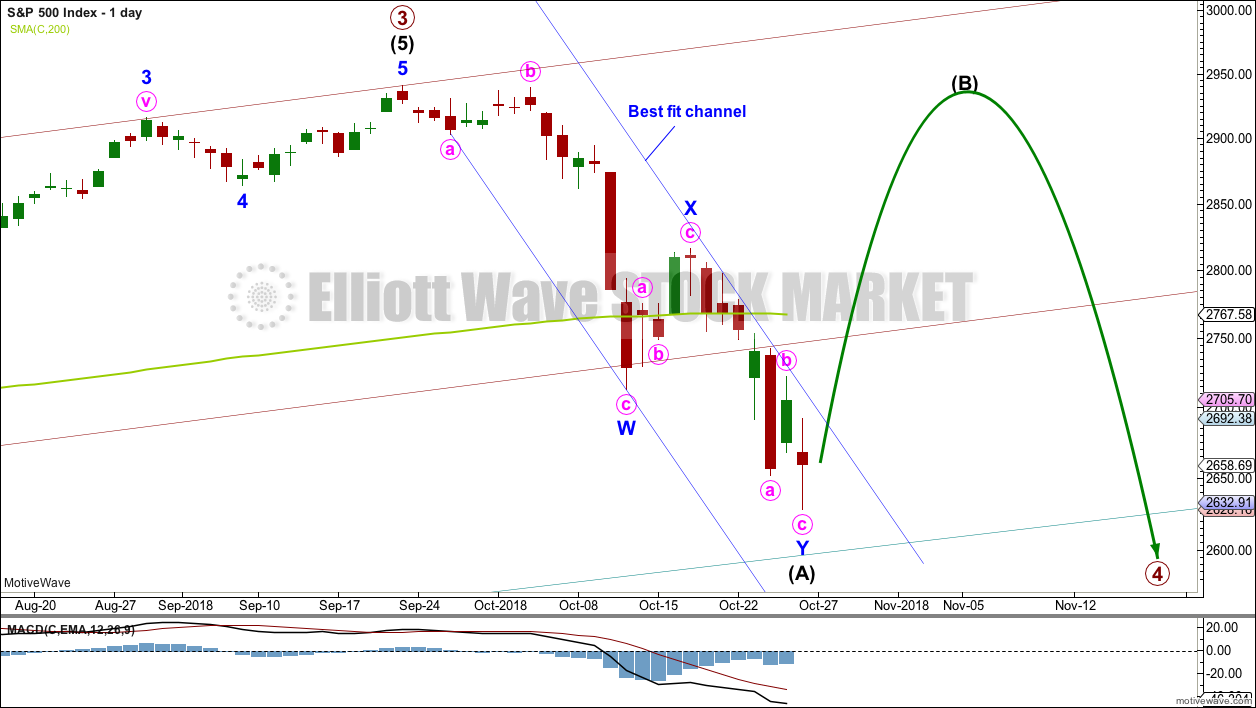
Intermediate wave (A) may now be a complete double zigzag. There is reasonable proportion within this wave count between minor waves W and Y.
Primary wave 4 may be subdividing as a flat or triangle. Because a flat would not offer alternation with the structure of primary wave 2, a triangle may be more likely.
When the first wave within a correction subdivides as a three, then the next wave is usually very deep. Intermediate wave (B) should be expected to be very deep in relation to intermediate wave (A); if primary wave 4 unfolds as an expanded flat or a running triangle, then it may make a new high above the start of intermediate wave (A). There is no upper invalidation point for this reason.
Primary wave 4 may not move into primary wave 1 price territory below 2,111.05.
ALTERNATE DAILY CHART
Click chart to enlarge.
It is also possible that intermediate wave (A) may be incomplete. If it is incomplete, then it may be unfolding as a single zigzag. Minor wave C would be likely to move lower in order to have better proportion to minor wave A.
A target is given for minor wave C to end. This target would expect to see an overshoot of the teal channel. If the lower teal trend line is overshot, then it would be most likely to see price move back to within the channel quickly. It would be unlikely to see a full daily candlestick below the channel.
When intermediate wave (A) could be a complete zigzag, then thereafter intermediate wave (B) would be expected to be a very deep multi week correction, which may make a new high above the start of intermediate wave (A).
TECHNICAL ANALYSIS
WEEKLY CHART
Click chart to enlarge. Chart courtesy of StockCharts.com.
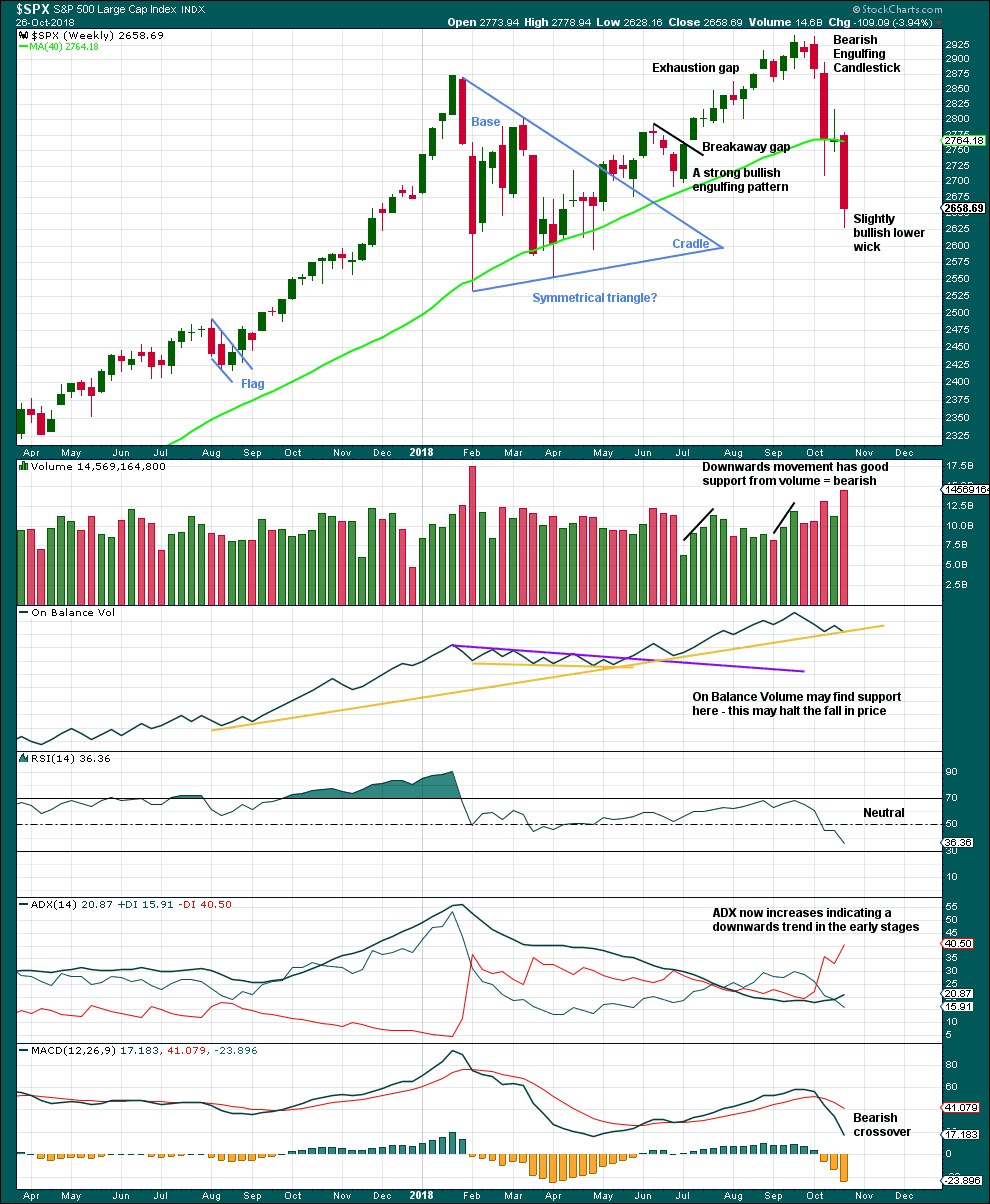
Support for On Balance Volume along with a slightly longer candlestick wick looks slightly bullish. A low for the first downwards swing within a consolidation may be found here or very soon next week.
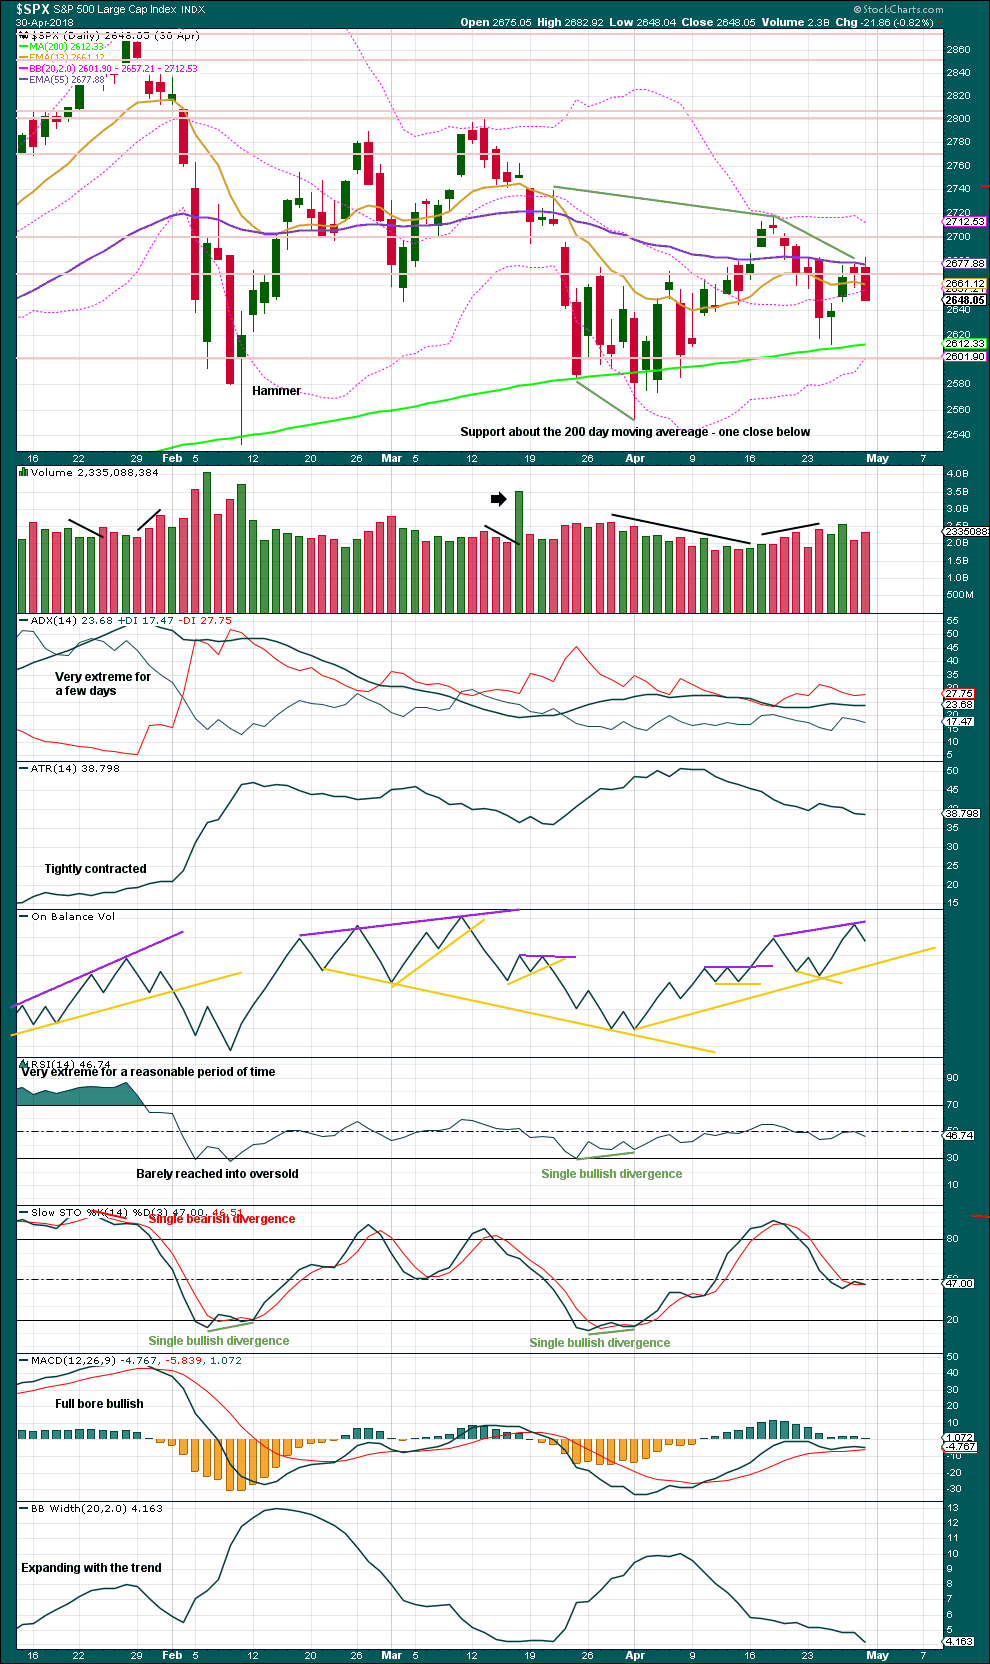
DAILY CHART
Click chart to enlarge. Chart courtesy of StockCharts.com.
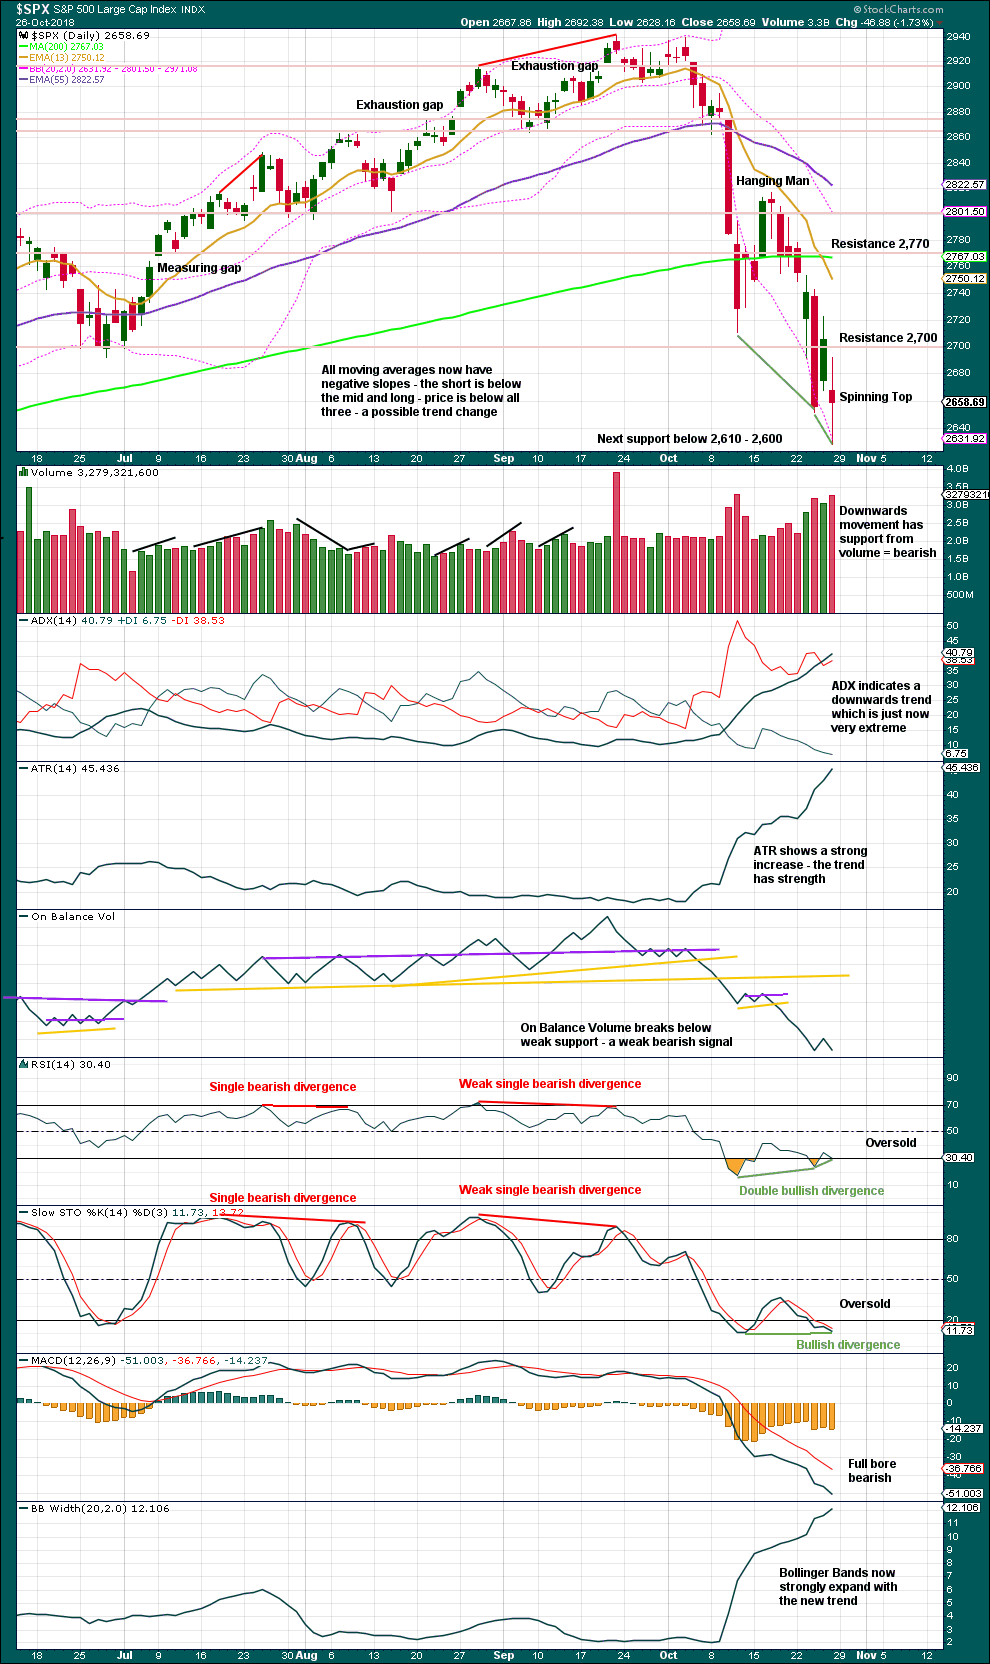
The Spinning Top candlestick pattern puts the trend from bearish to neutral. On its own, it is not a reversal pattern.
With RSI now exhibiting double bullish divergence while oversold, it looks more likely that a low may now be in place. This offers reasonable support now to the main Elliott wave count.
BREADTH – AD LINE
WEEKLY CHART
Click chart to enlarge. Chart courtesy of StockCharts.com.
Falling price again has support from a decline in market breadth. Breadth is falling in line with price. There is no divergence either way.
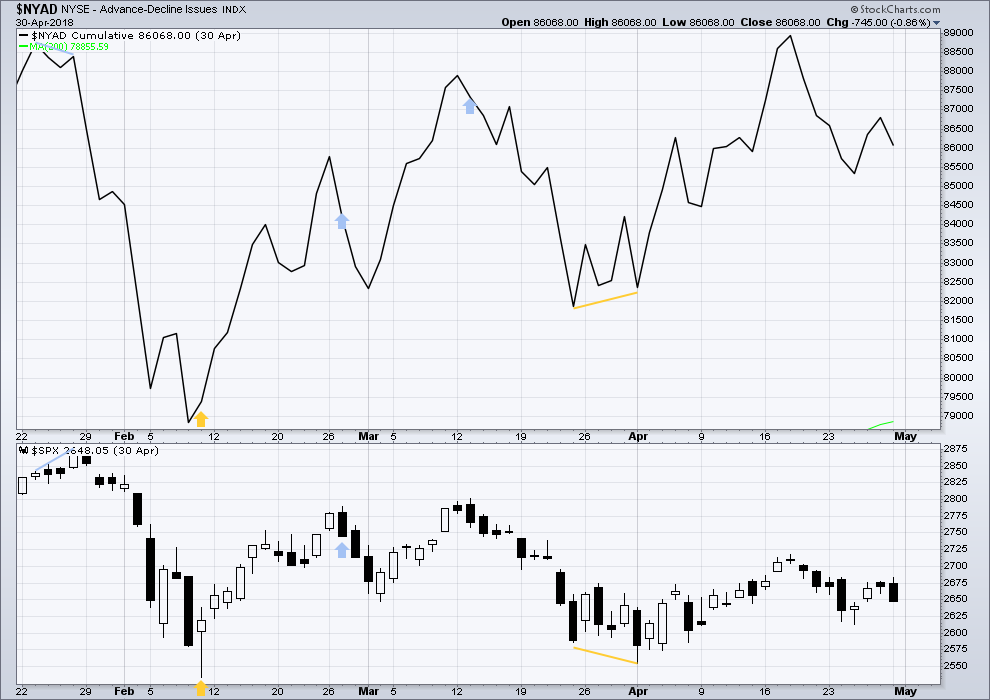
DAILY CHART
Click chart to enlarge. Chart courtesy of StockCharts.com.
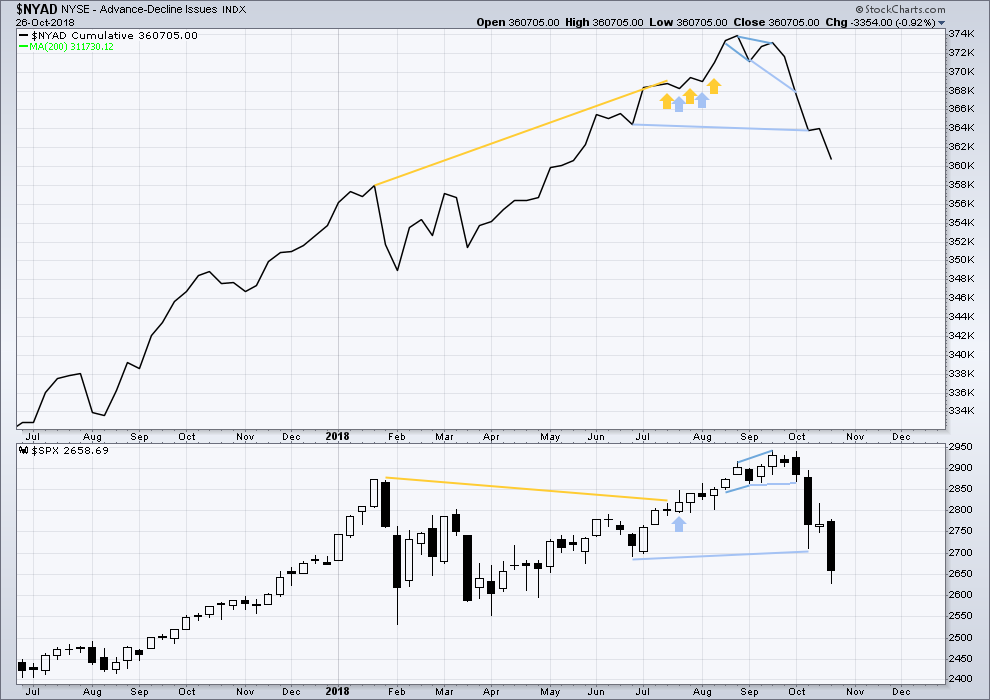
There is normally 4-6 months divergence between price and market breadth prior to a full fledged bear market. This has been so for all major bear markets within the last 90 odd years. With no longer term divergence yet at this point, any decline in price should be expected to be a pullback within an ongoing bull market and not necessarily the start of a bear market. New all time highs from the AD line on the 29th of August means that the beginning of any bear market may be at the end of December 2018, but it may of course be a lot longer than that. My next expectation for the end of this bull market may now be October 2019.
Breadth should be read as a leading indicator.
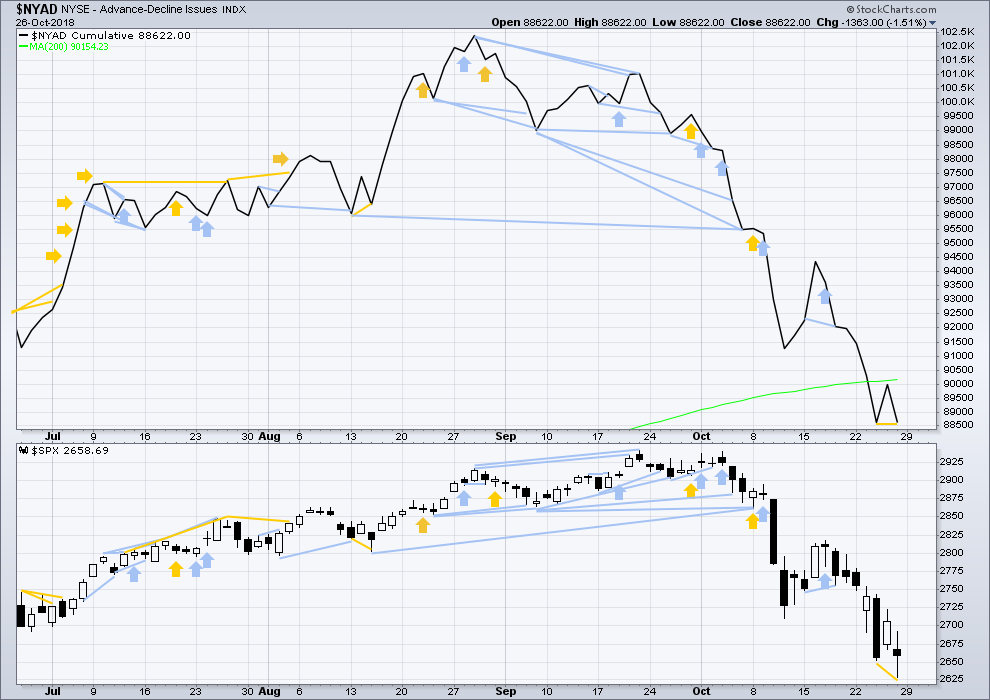
Price has made a new short term swing low, but the AD line is flat. There may be bullish divergence here, but it is weak.
VOLATILITY – INVERTED VIX CHART
WEEKLY CHART
Click chart to enlarge. Chart courtesy of StockCharts.com. So that colour blind members are included, bearish signals
will be noted with blue and bullish signals with yellow.
The fall in price this week comes with a normal corresponding increase in volatility as inverted VIX also declines. There is no new divergence. Last noted mid term bearish divergence has now been resolved.
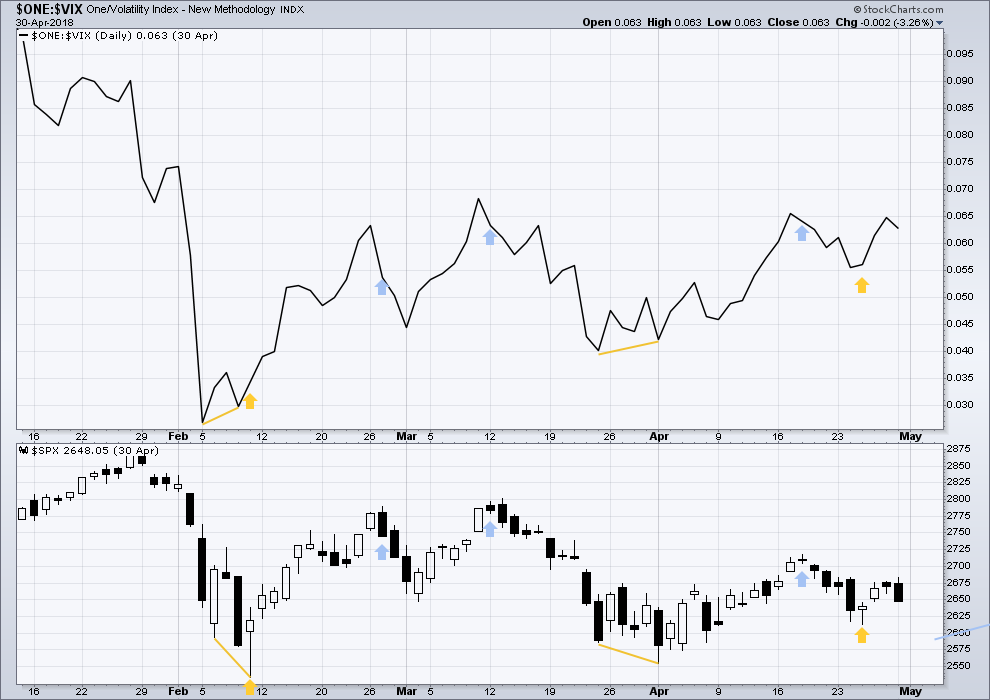
DAILY CHART
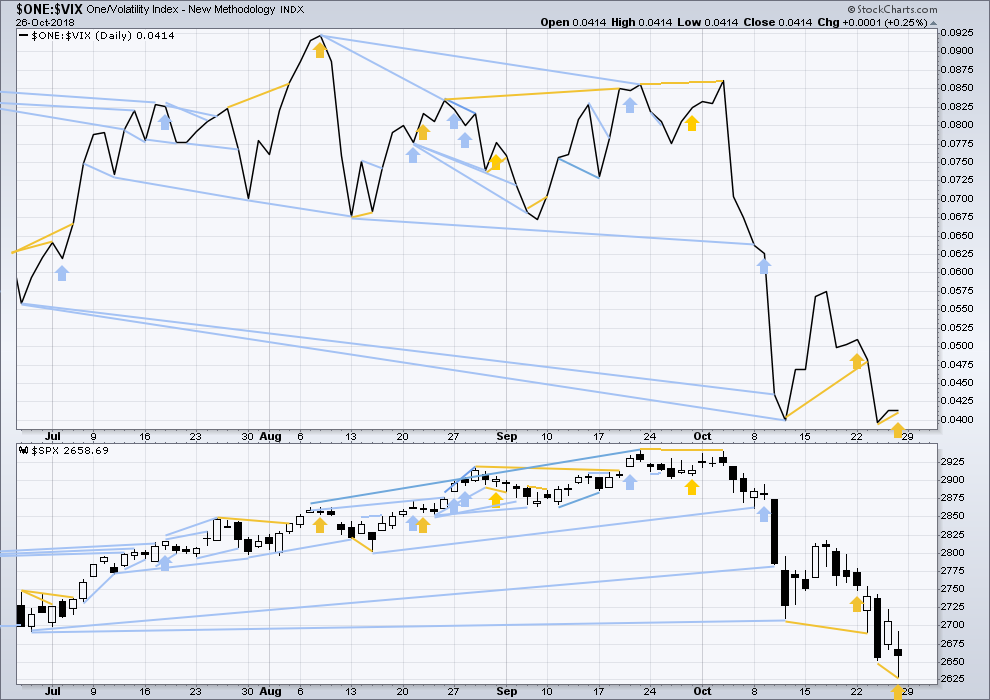
Click chart to enlarge. Chart courtesy of StockCharts.com. So that colour blind members are included, bearish signals
will be noted with blue and bullish signals with yellow.
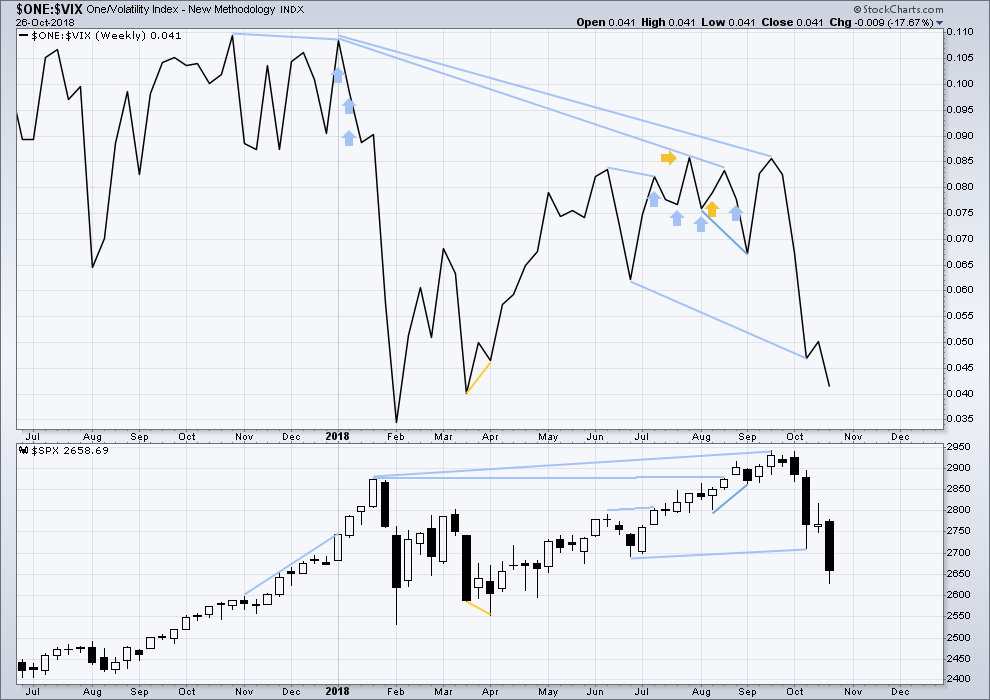
Normally, volatility should decline as price moves higher and increase as price moves lower. This means that normally inverted VIX should move in the same direction as price.
There is now short term bullish divergence between lows in price and inverted VIX. There is also weak bullish single day divergence as price moved lower on Friday but inverted VIX was flat.
DOW THEORY
The following lows need to be exceeded for Dow Theory to confirm the end of the bull market and a change to a bear market:
DJIA: 23,344.52.
DJT: 9,806.79.
S&P500: 2,532.69.
Nasdaq: 6,630.67.
ANALYSIS OF INTERMEDIATE WAVE (4)
TECHNICAL ANALYSIS
Click chart to enlarge. Chart courtesy of StockCharts.com.
Intermediate wave (4) was a large symmetrical triangle. The deepest wave was the first wave. At its low there was a clear candlestick reversal pattern and bullish divergence between price and Stochastics.
RSI barely managed to reach into oversold.
The current correction for primary wave 4 may behave differently, but there should be some similarities.
It is expected that primary wave 4 may be stronger than intermediate wave (4).
VIX
Click chart to enlarge. Chart courtesy of StockCharts.com.
This is a daily chart.
At the two major lows within intermediate wave (4), inverted VIX exhibited single short term bullish divergence.
At highs within intermediate wave (4), inverted VIX exhibited one single day bullish divergence with price.
AD LINE
Click chart to enlarge. Chart courtesy of StockCharts.com.
This is a daily chart.
At the two major lows within intermediate wave (4), there was bullish divergence between price and the AD line. At the two major highs within intermediate wave (4), there was each one instance of single day bearish divergence.
GOLD
For the mid term, volume and On Balance Volume this week give an important signal. For the short term, Friday’s candlestick gives a contradictory signal. The main Elliott wave count remains the same.
Summary: Another multi week consolidation may have begun, which may end about 1,217 and may not move below 1,201.14.
For the short term, next week may see a small downwards swing to support. The short term target is about 1,220.
Resistance is about 1,240 and support is about 1,220.
The final target for this bounce to end is at strong resistance about 1,305 – 1,310.
Grand SuperCycle analysis is here.
Last historic analysis with monthly charts is here.
There are four remaining weekly wave counts at this time for cycle wave b: a triangle, a flat, a combination, and a double zigzag.
At this stage, they will now be presented roughly in order of probability. The triangle and the double zigzag wave counts have about an even probability; the combination and flat wave counts now look less likely.
MAIN ELLIOTT WAVE COUNT
WEEKLY CHART – TRIANGLE
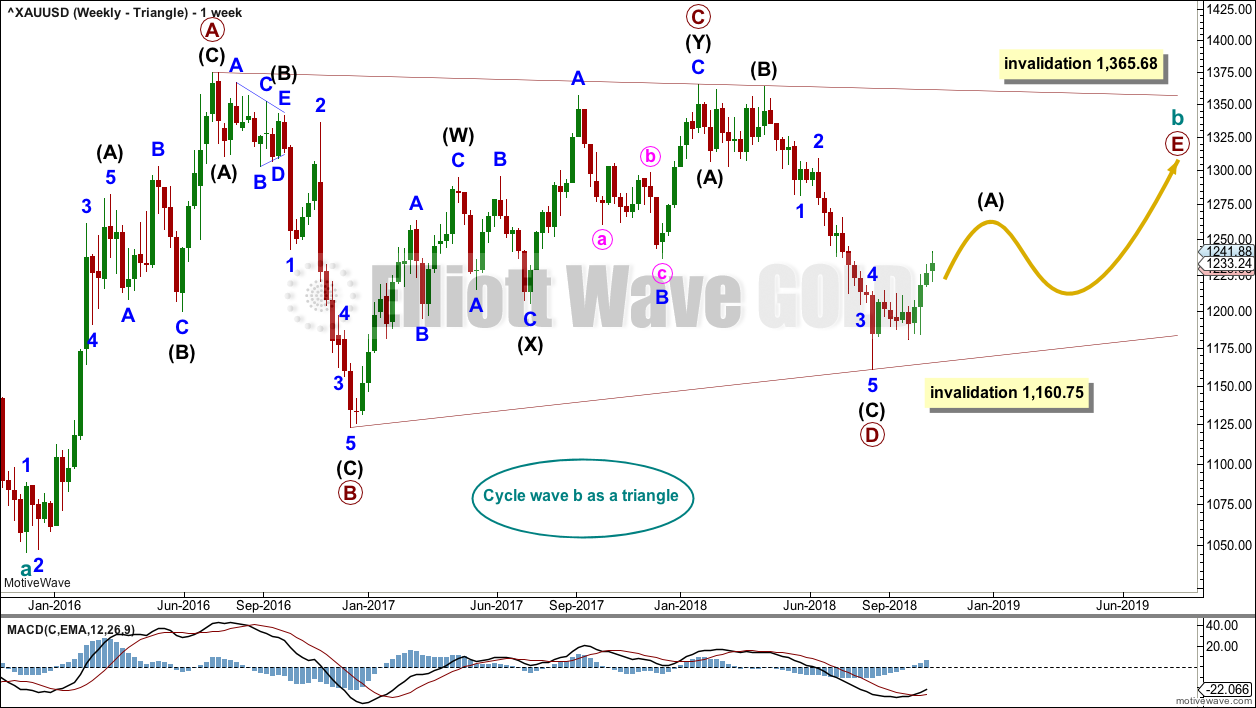
Click chart to enlarge.
Cycle wave b may be an incomplete regular contracting triangle. Primary wave E may not move beyond the end of primary wave C above 1,365.68. Within primary wave E, intermediate wave B may not move beyond the start of intermediate wave A below 1,160.75.
Four of the five sub-waves of a triangle must be zigzags, with only one sub-wave allowed to be a multiple zigzag. Wave C is the most common sub-wave to subdivide as a multiple, and this is how primary wave C for this example fits best. Primary wave E would most likely be a single zigzag. It is also possible that it may subdivide as a triangle to create a rare nine wave triangle.
There are no problems in terms of subdivisions or rare structures for this wave count. It has an excellent fit and so far a typical look.
Primary wave E may now continue higher as a large three wave structure.
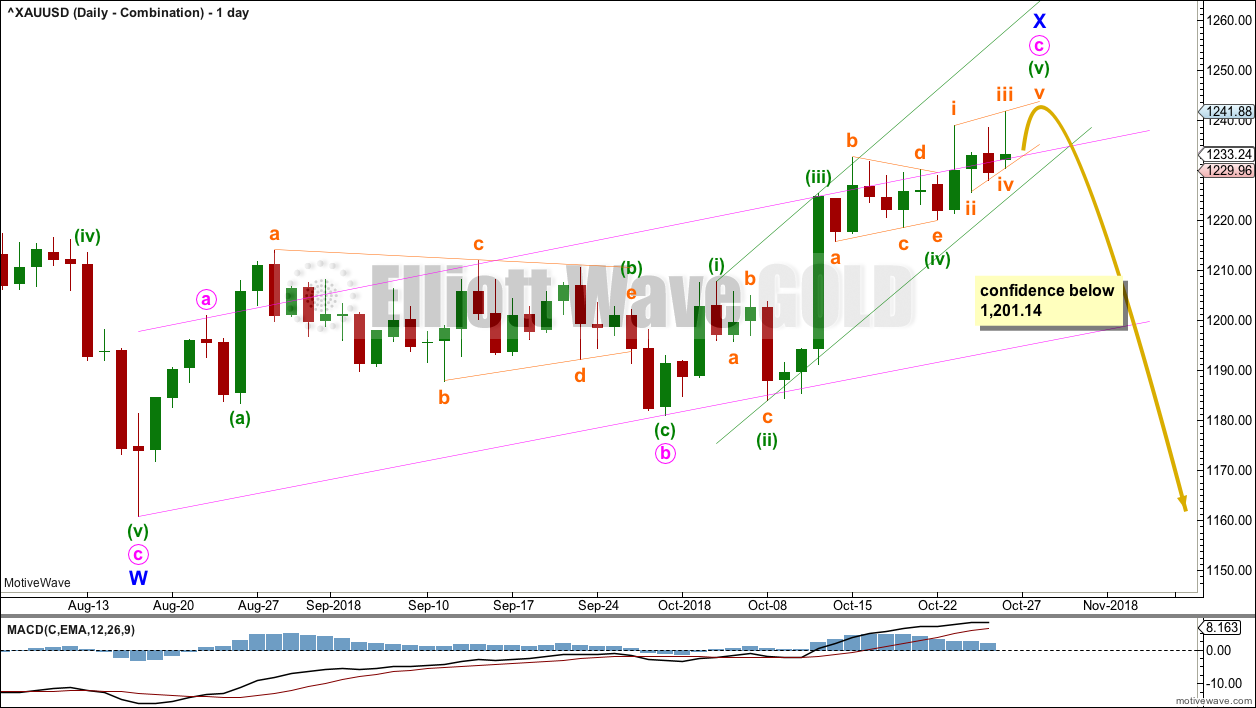
DAILY CHART – TRIANGLE
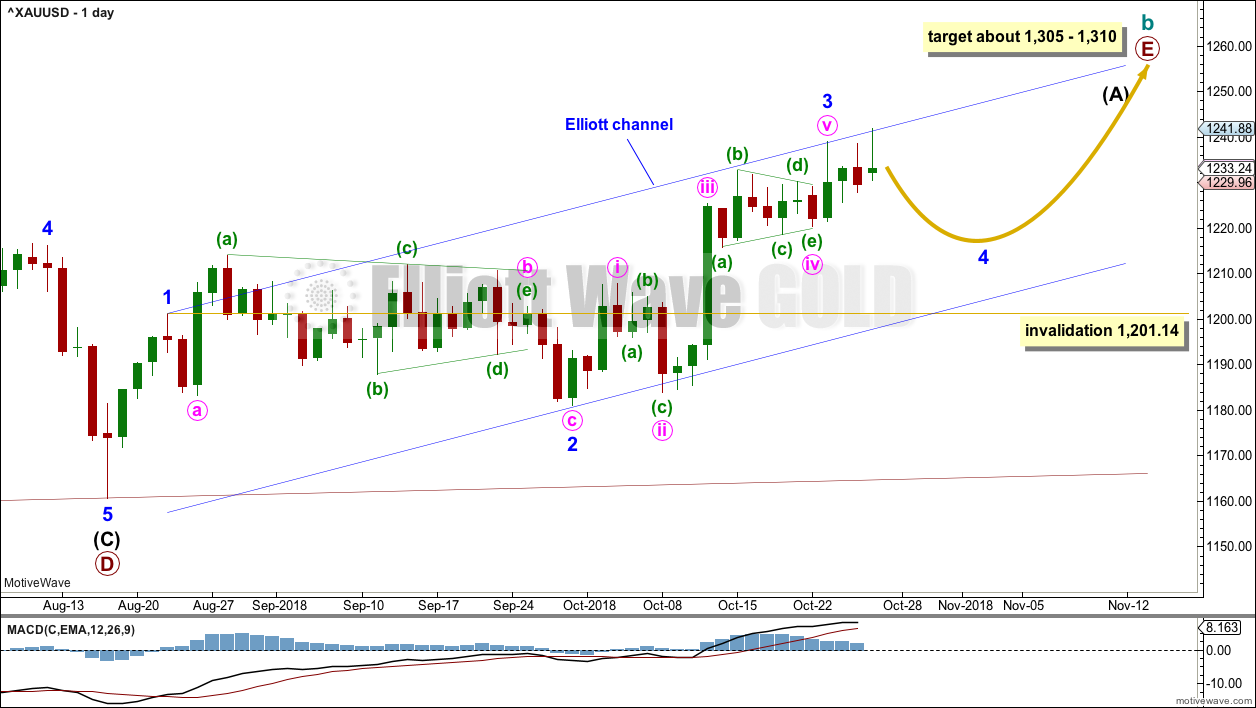
Click chart to enlarge.
Primary wave E should now be underway for this wave count.
Primary wave E should subdivide as a zigzag. Intermediate wave (A) should subdivide as a five wave structure.
Within intermediate wave (A), so far minor waves 1 through to 3 may now be complete. Minor wave 3 exhibits no Fibonacci ratio to minor wave 1. Minor wave 2 was a relatively shallow 0.497 flat correction. Minor wave 4 may exhibit alternation as a deeper zigzag, or it may also be a more shallow sideways combination or triangle.
Minor wave 4 may not move into minor wave 1 price territory below 1,201.14.
Minor wave 2 lasted 27 sessions. Minor wave 4 may exhibit reasonable proportion to minor wave 2; it may last about a Fibonacci 21 or 34 sessions. If minor wave 4 unfolds as a zigzag, then it may be quicker, possibly lasting about a Fibonacci 13 sessions.
Draw the channel about intermediate wave (A) using Elliott’s first technique. Draw the first trend line from the ends of minor waves 1 to 3, then place a parallel copy on the end of minor wave 2. If it is time consuming enough, then minor wave 4 may find support about the lower edge of this channel. Upwards movement for Friday found strong resistance about the upper edge of this channel.
A target for primary wave E is the strong zone of resistance about 1,305 to 1,310. Primary wave E is most likely to subdivide as a zigzag (although it may also subdivide as a triangle to create a rare nine wave triangle), and it should last at least a Fibonacci 13 weeks. It may also last a total Fibonacci 21 or 34 weeks. So far it has lasted only 8 weeks. Primary wave E may not move beyond the end of primary wave C above 1,365.68.
WEEKLY CHART – DOUBLE ZIGZAG
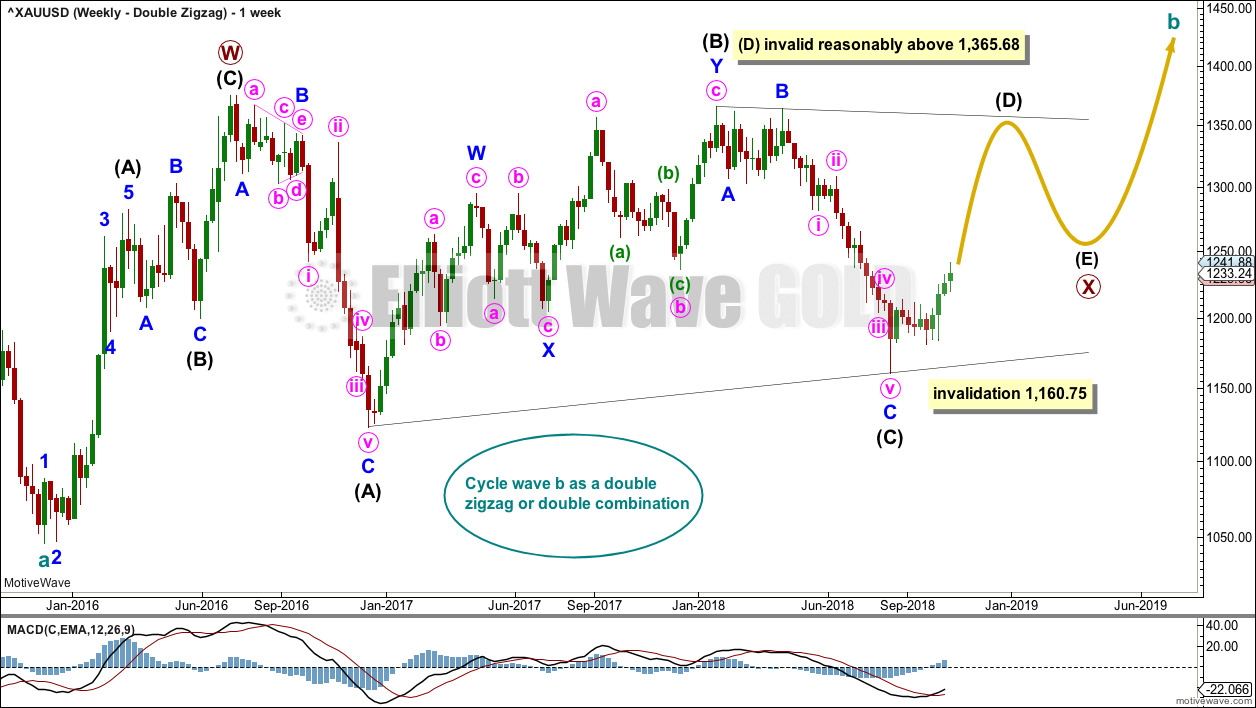
Click chart to enlarge.
It is also possible that cycle wave b may be a double zigzag or a double combination.
The first zigzag in the double is labelled primary wave W. This has a good fit.
The double may be joined by a corrective structure in the opposite direction, a triangle labelled primary wave X. The triangle would be about three quarters complete.
Within the triangle of primary wave X, intermediate wave (C) should be complete. Within intermediate wave (D), minor wave B may not move beyond the start of minor wave A below 1,160.75.
Intermediate wave (D) would most likely subdivide as a single zigzag. The subdivisions at the daily chart level for this wave count would be the same as for the first triangle wave count above; a zigzag unfolding higher would be labelled A-B-C.
This wave count may now expect choppy overlapping movement in an ever decreasing range for several more months.
Primary wave Y would most likely be a zigzag because primary wave X would be shallow; double zigzags normally have relatively shallow X waves.
Primary wave Y may also be a flat correction if cycle wave b is a double combination, but combinations normally have deep X waves. This would be less likely.
This wave count has good proportions and no problems in terms of subdivisions.
WEEKLY CHART – COMBINATION
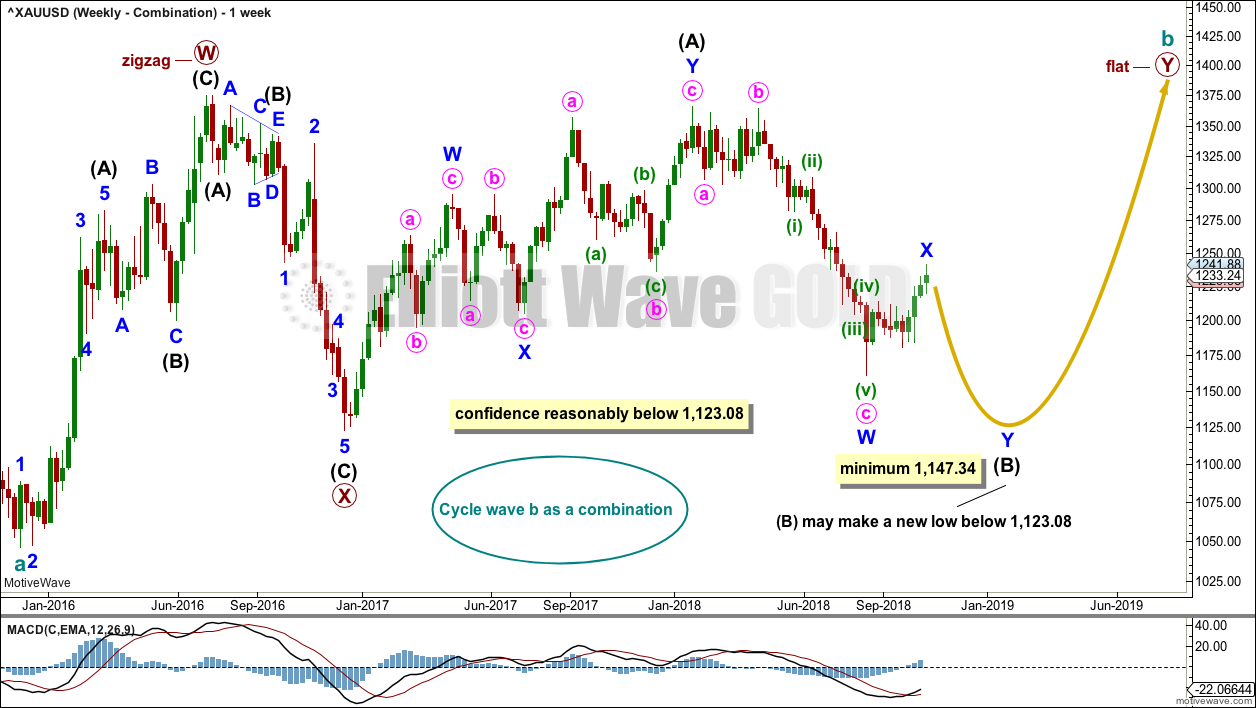
Click chart to enlarge.
If cycle wave b is a combination, then the first structure in a double may be a complete zigzag labelled primary wave W.
The double may be joined by a three in the opposite direction, a zigzag labelled primary wave X.
The second structure in the double may be a flat correction labelled primary wave Y. My research on Gold so far has found that the most common two structures in a double combination are one zigzag and one flat correction. I have found only one instance where a triangle unfolded for wave Y. The most likely structure for wave Y would be a flat correction by a very wide margin, so that is what this wave count shall expect.
Within a flat correction for primary wave Y, the current downwards wave of intermediate wave (B) may be a double zigzag. Intermediate wave (B) must retrace a minimum 0.9 length of intermediate wave (A) at 1,147.34. Intermediate wave (B) may move beyond the start of intermediate wave (A) as in an expanded flat.
Because the minimum requirement for intermediate wave (B) is not yet met, this wave count requires that intermediate wave (B) continues lower. This is the most immediately bearish of all four weekly wave counts.
When intermediate wave (B) is complete, then intermediate wave (C) would be expected to make at least a slight new high above the end of intermediate wave (A) at 1,365.68 to avoid a truncation. Primary wave Y would be most likely to end about the same level as primary wave W at 1,374.91, so that the whole structure takes up time and moves price sideways, as that is the purpose of double combinations.
While double combinations are very common, triples are extremely rare. I have found no examples of triple combinations for Gold at daily chart time frames or higher back to 1976. When the second structure in a double is complete, then it is extremely likely (almost certain) that the whole correction is over.
DAILY CHART – COMBINATION
Click chart to enlarge.
Minor wave X may now be incomplete.
When minuette wave (v) may be complete, then this wave count would again expect a trend change and a new downwards wave to a minimum at 1,147.34.
WEEKLY CHART – FLAT
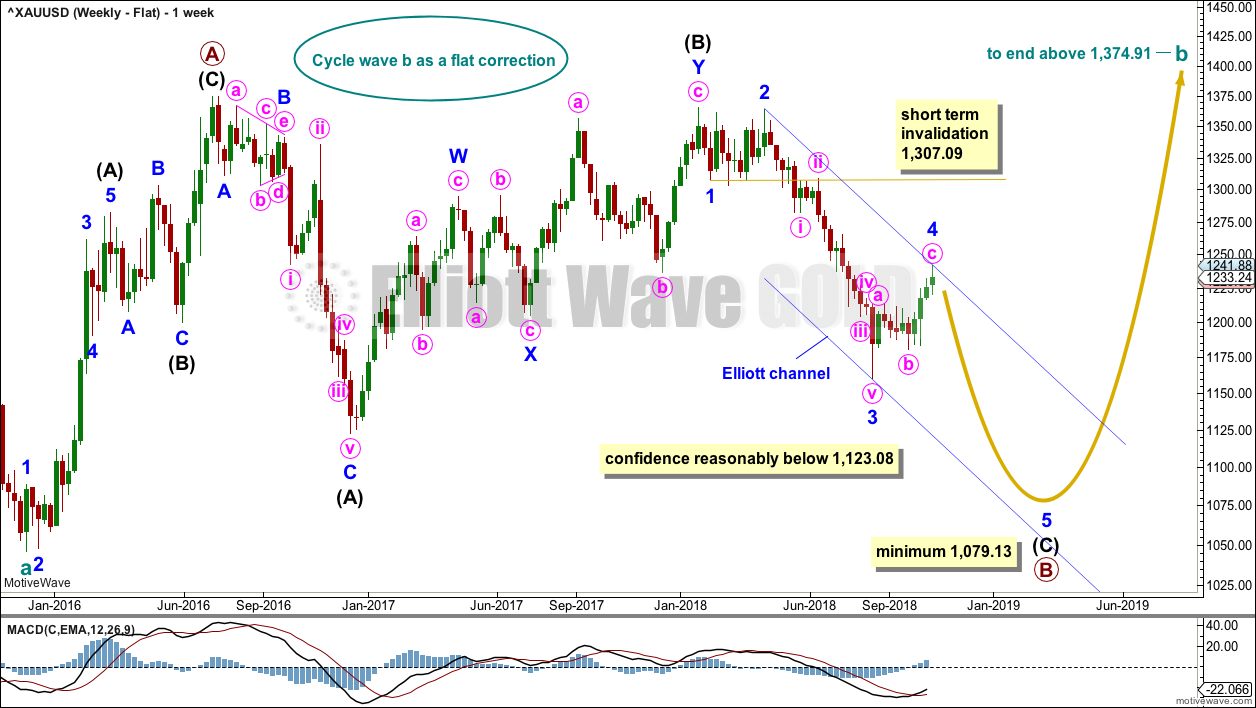
Click chart to enlarge.
It is possible that cycle wave b may be a flat correction. Within a flat correction, primary wave B must retrace a minimum 0.9 length of primary wave A at 1,079.13 or below. Primary wave B may make a new low below the start of primary wave A at 1,046.27 as in an expanded flat correction.
Only a new low reasonably below 1,123.08 would provide reasonable confidence in this wave count.
Intermediate wave (C) must subdivide as a five wave structure; it may be unfolding as an impulse. Within intermediate wave (C), minor waves 1 through to 4 may be complete. If it continues further, then minor wave 4 may not move into minor wave 1 price territory above 1,307.09.
The blue channel is drawn using Elliott’s second technique. Minor wave 5 may end at support about the lower edge of this channel.
Minor wave 2 was a double zigzag lasting nine weeks. Minor wave 4 exhibits little alternation as a single zigzag and reasonable proportion lasting ten weeks.
TECHNICAL ANALYSIS
WEEKLY CHART
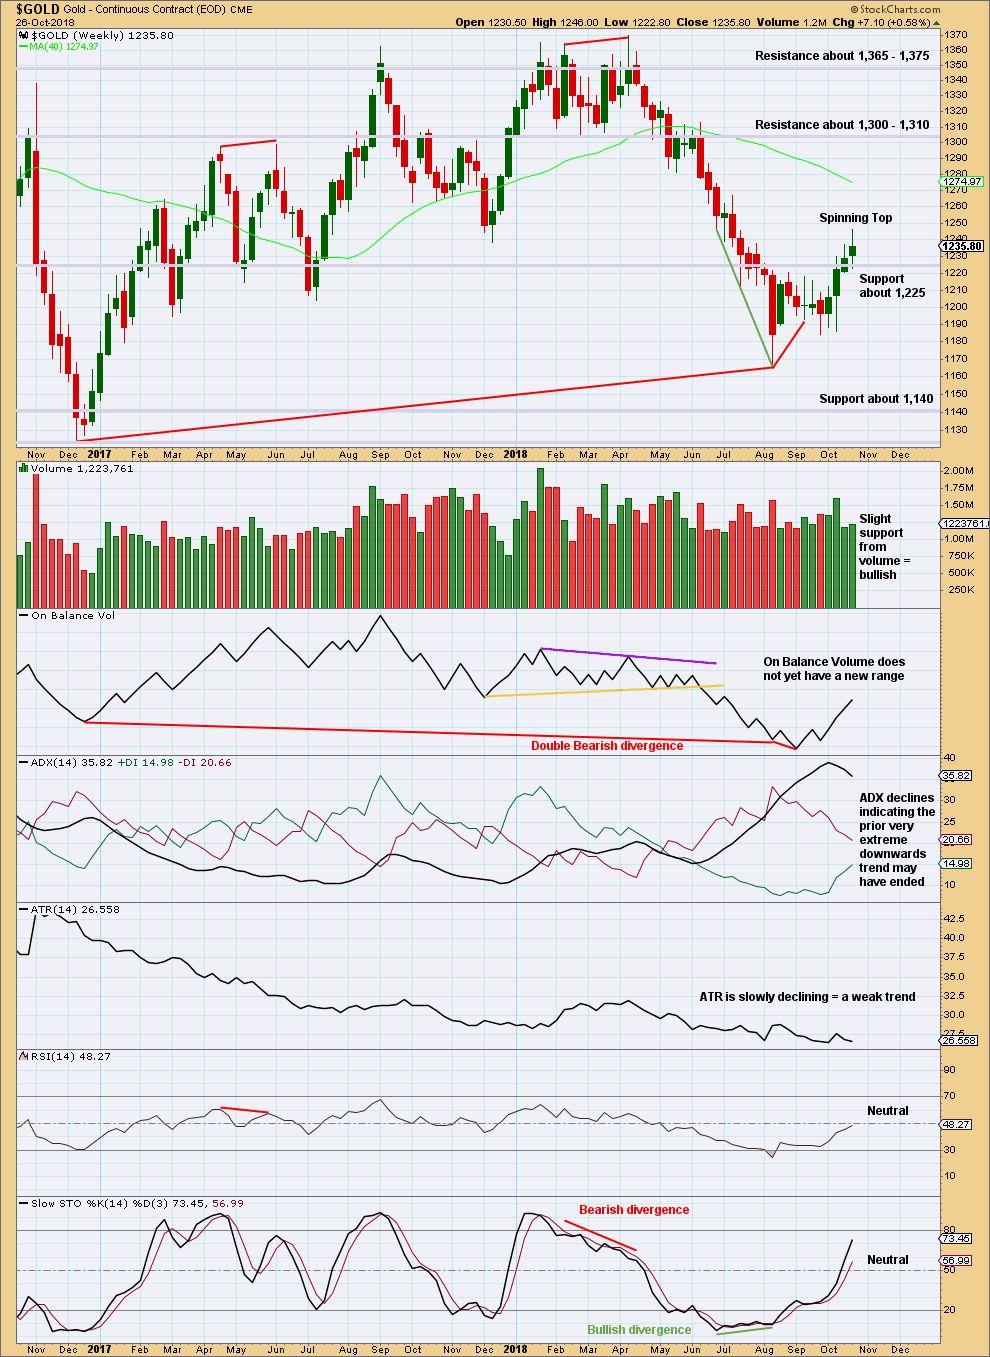
Click chart to enlarge. Chart courtesy of StockCharts.com.
On Balance Volume has made a lower low than its prior low at the end of November 2015. This divergence is extremely bearish but does not rule out a consolidation unfolding here; the divergence does strongly support the Triangle wave count, which expects a consolidation or bounce up to test resistance now and then a continuation of a major bear market. It could also support the flat wave count that allows for a new low below 1,046.27 in coming months.
This week’s Spinning Top candlestick pattern puts the trend from up to neutral.
DAILY CHART
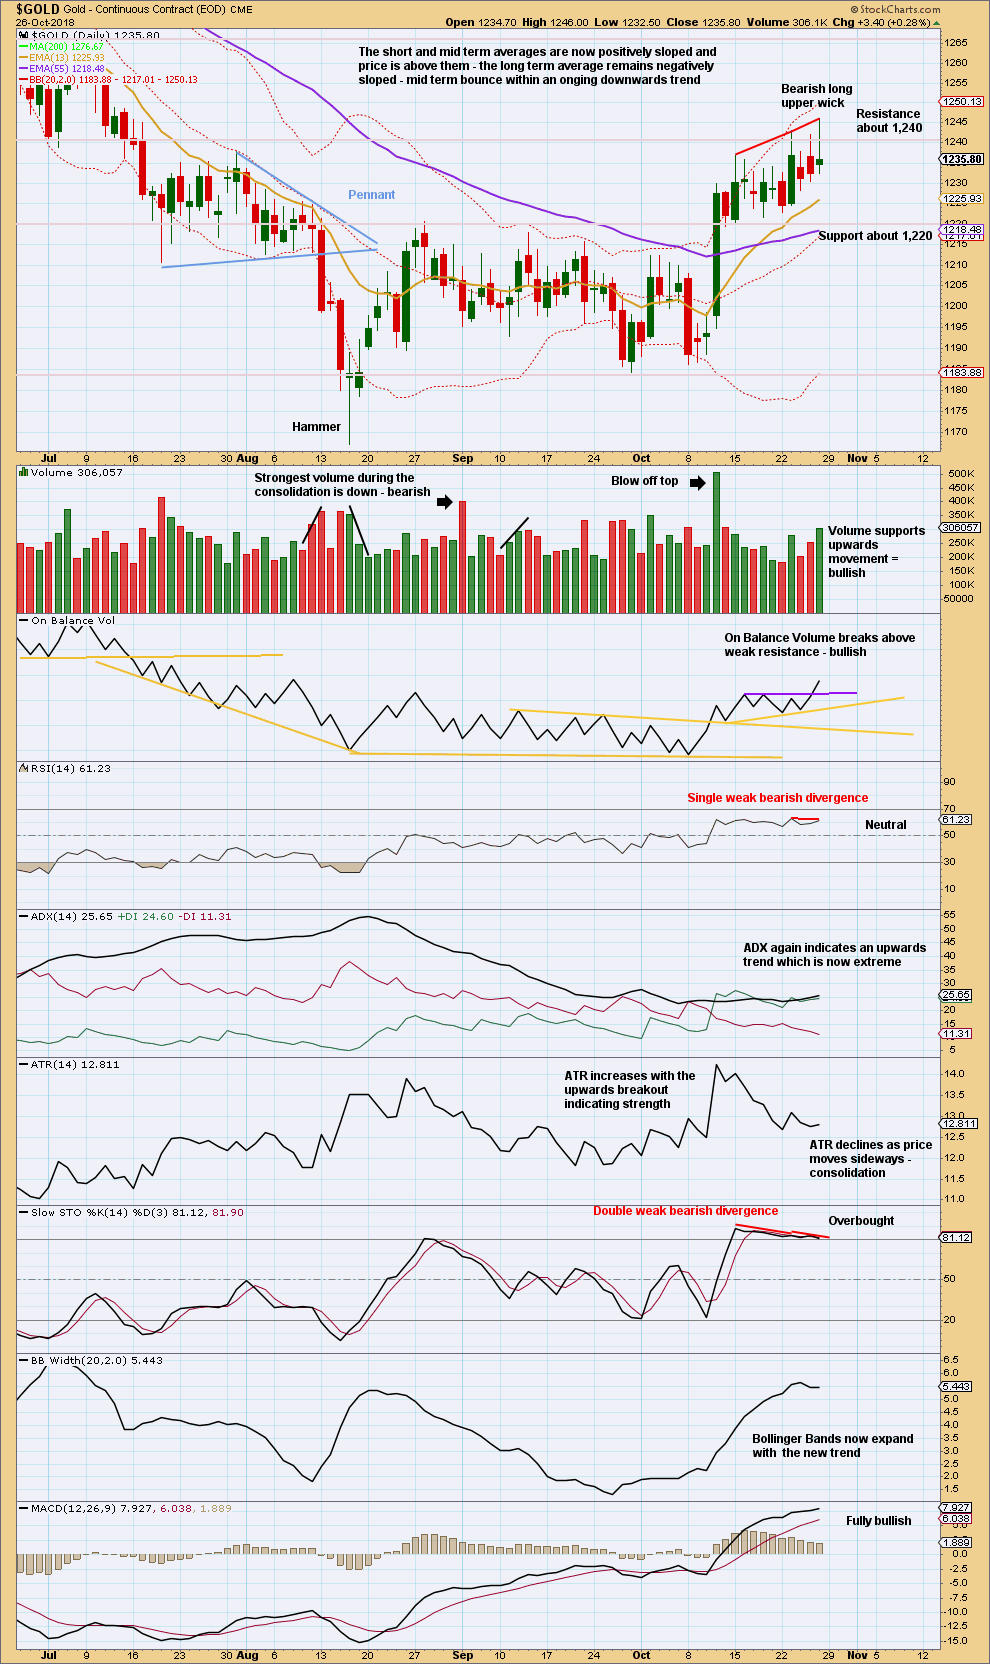
Click chart to enlarge. Chart courtesy of StockCharts.com.
Price remains range bound with resistance about 1,240 and support about 1,220. With a long upper wick, which is bearish, this Friday’s candlestick failed to close outside this range.
While ADX still indicates an upwards trend, the ADX line is now just above the directional lines indicating the trend is becoming extreme.
On Friday volume was strong and On Balance Volume gave a bullish signal. However, the close back into the consolidation zone is a stronger indicator. Price, with support from volume, needs to close above 1,240 for a breakout.
GDX WEEKLY CHART
Click chart to enlarge. Chart courtesy of StockCharts.com.
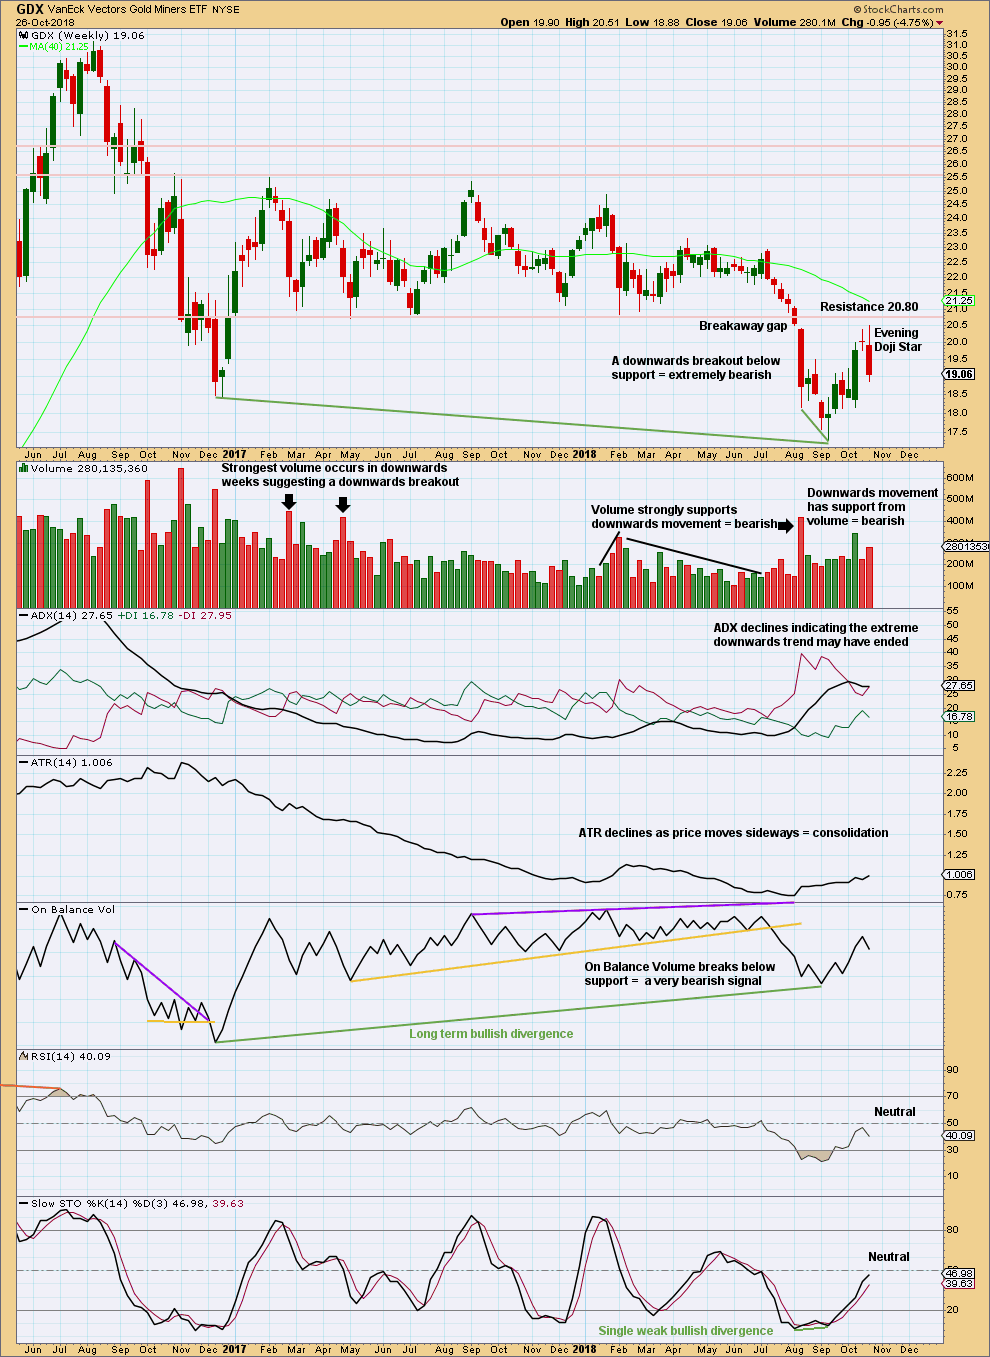
GDX had a large consolidation that lasted from January 2017 to August 2018. A downwards breakout below support at 20.80 in early August 2018 is highly significant. The breakout had support from volume, which adds confidence.
Upwards movement to the high this week now looks like a completed back test of resistance close to prior support at 20.80. The Evening doji star pattern indicates the bounce may be complete. The high this week at 20.51 is exactly the upper edge of the breakaway gap.
It would now be typical to see price move down and away. The target is at 16.02.
GDX DAILY CHART
Click chart to enlarge. Chart courtesy of StockCharts.com.
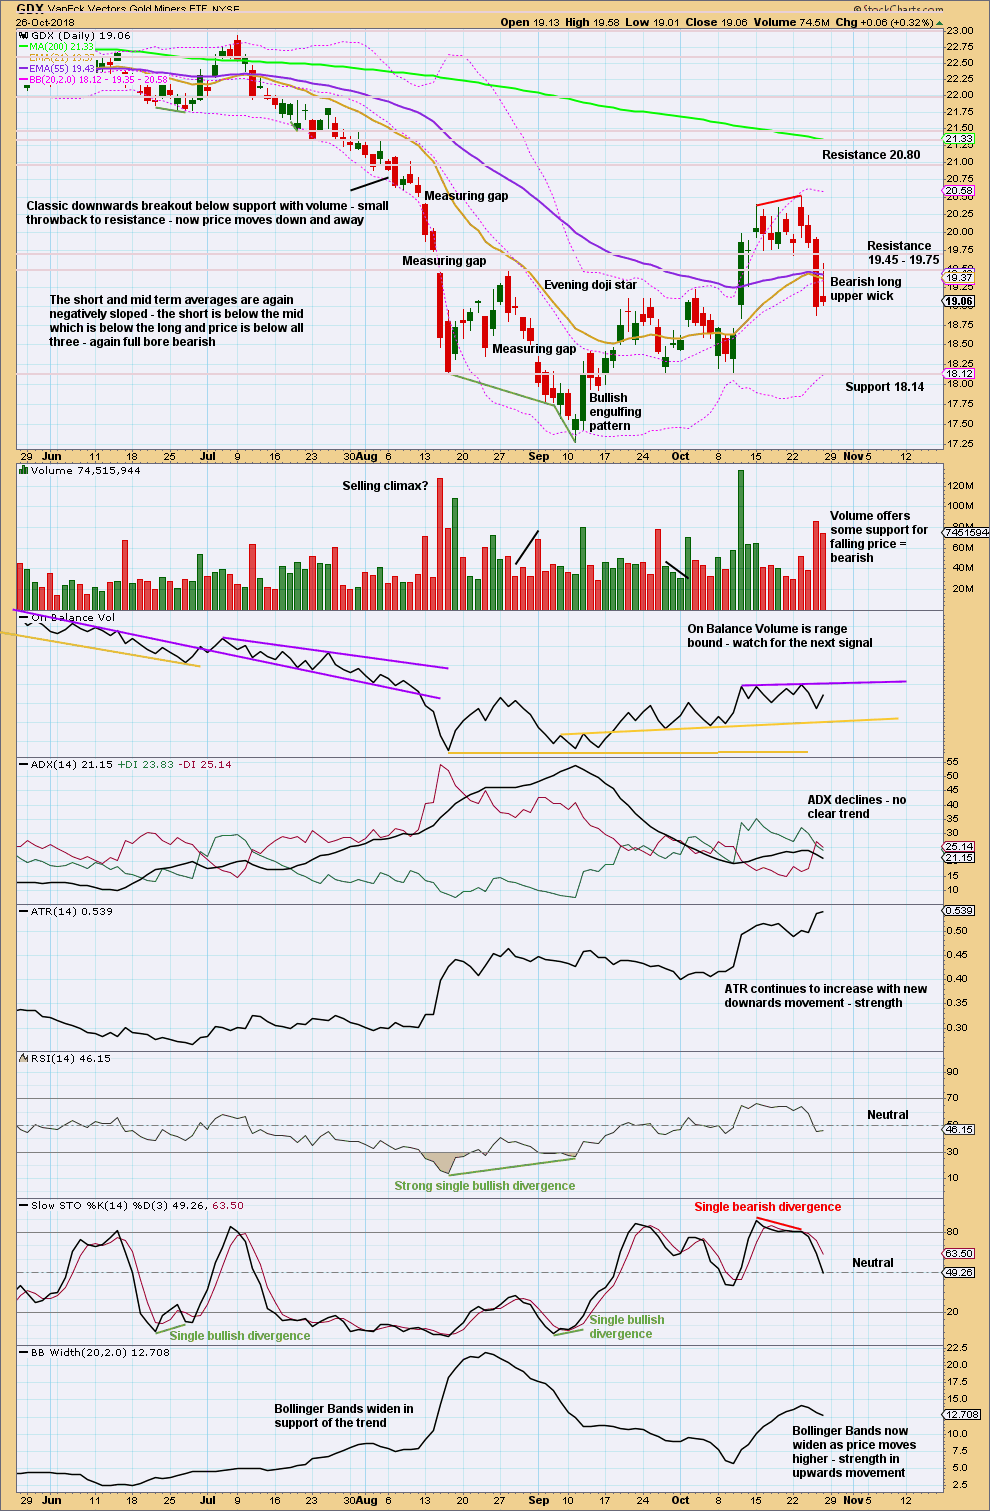
The back test looks complete. It did not manage to get right up to 20.80.
The target is at 16.02. Price will not move in a straight line to this target; there will be consolidations and bounces along the way. Next support is about 18.15.
US OIL
More downwards movement below 66.86 invalidated one of the two remaining daily Elliott wave counts.
At the end of this week, two versions of the remaining Elliott wave count are provided.
Summary: While price remains within the narrow channel on the daily charts, expect a little more downwards movement next week to complete this final downwards swing. The target remains about 63.60; but as soon as price makes a new low below 64.43, then a low could be in.
If price breaks above the narrow channel, then consider the low may be in. Confidence in this view may be had if price makes a new high above 70.51. The target would then be 96.59 to 106.25.
This downwards swing may end sooner rather than later. It may offer a final good entry opportunity to join an upwards trend. The next wave up could be quite strong; it could end with a strong blow off top.
MAIN WAVE COUNT
MONTHLY CHART
Click chart to enlarge.
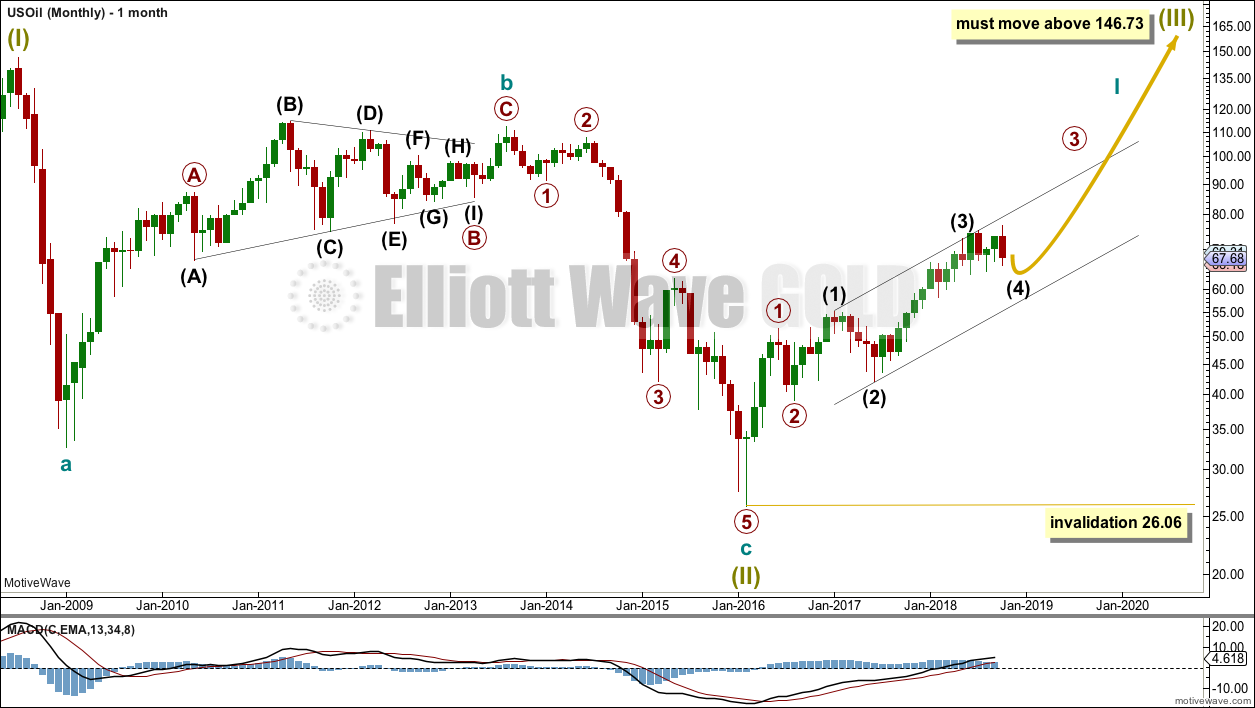
The bear market for US Oil looks to be over and a new bull market looks to be in its early stages. The prior bearish wave count has been invalidated, leaving only this very bullish wave count.
A huge zigzag down to the last low may be complete and is labelled here Super Cycle wave (II).
Cycle wave b must be seen as complete in August 2013 for this wave count to work. It cannot be seen as complete at the prior major swing high in May 2011.
Cycle wave b is seen as a zigzag, and within it primary wave B is seen as a running contracting triangle. These are fairly common structures, although nine wave triangles are uncommon. All subdivisions fit.
Primary wave C moves beyond the end of primary wave A, so it avoids a truncation. But it does not have to move above the price territory of primary wave B to avoid a truncation, which is an important distinction.
If cycle wave b begins there, then cycle wave c may be seen as a complete five wave impulse.
Super Cycle wave (III) must move beyond the end of Super Cycle wave (I). It must move far enough above that point to allow room for a subsequent Super Cycle wave (IV) to unfold and remain above Super Cycle wave (I) price territory.
Cycle wave I may be incomplete. It may be unfolding as an impulse and may have now moved through the middle portion. Commodities have a tendency to exhibit swift strong fifth waves, and this tendency is especially prevalent for third wave impulses. Intermediate wave (5) to end primary wave 3 may be very swift and strong, ending with a blow off top.
When cycle wave I is complete, then cycle wave II may be a deep correction that may not move beyond the start of cycle wave I below 26.06.
Data from FXCM for USOil does not go back to the beginning of Super Cycle wave (I). Without an accurate known length of Super Cycle wave (I) a target cannot be calculated for Super Cycle wave (III) to end using Fibonacci ratios. The target for Super Cycle wave (III) may be calculated when cycle waves I, II, III and IV within it are complete. That cannot be done for many years.
WEEKLY CHART
Click chart to enlarge.
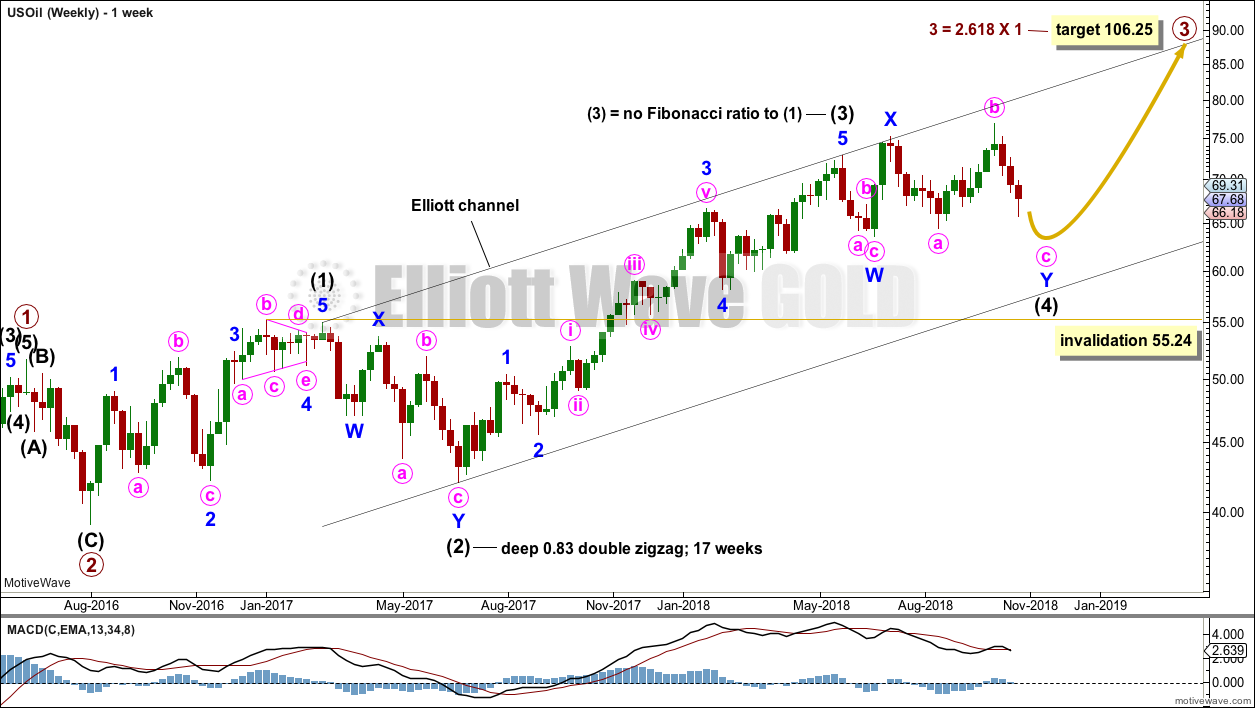
Intermediate wave (3) is now complete. There is no Fibonacci ratio between intermediate waves (1) and (3), and intermediate wave (3) is longer than 1.618 the length of intermediate wave (1).
This wave count fits with classic technical analysis at the monthly and daily chart levels.
Intermediate wave (2) was a deep double zigzag. Given the guideline of alternation, intermediate wave (4) may be expected to most likely be a shallow flat, triangle or combination. It may be about even in duration with intermediate wave (2), or it may be a little longer because triangles and combinations are more time consuming structures.
At this stage, the possibility of a completed triangle for intermediate wave (4) has been invalidated. The only remaining option now is a combination, and the two daily wave counts below both look at two different ways of labelling intermediate wave (4) as a combination.
DAILY CHART
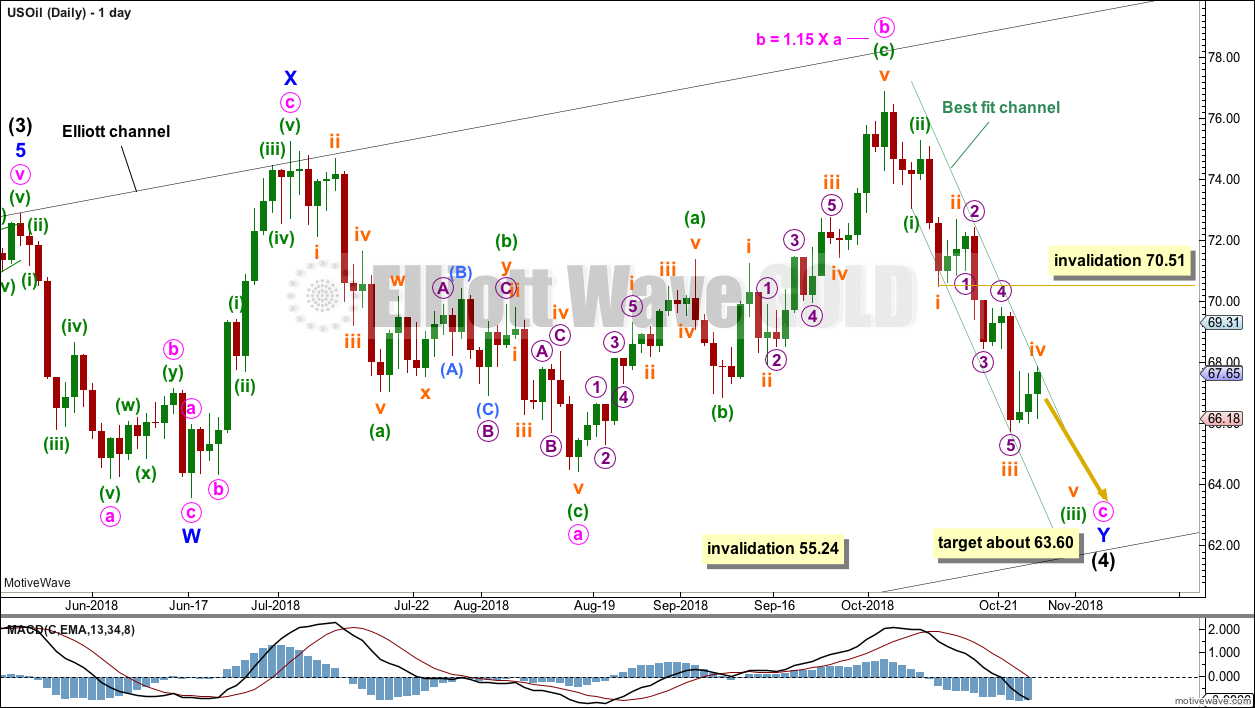
Click chart to enlarge.
Intermediate wave (4) may be unfolding as a double combination.
The first structure in a double combination may be a complete zigzag labelled minor wave W. There is a little disproportion within minute wave a between the corrections of minuette waves (ii) and (iv), but this is slight enough to be acceptable for this market.
The double is joined by a complete three in the opposite direction, a zigzag labelled minor wave X. X waves within combinations have no minimum nor maximum allowable length, and may make new price extremes beyond the start of wave W as this one does. The only guideline in terms of depth for X waves is that they are normally very deep.
The second structure in a double combination would most likely be a flat correction as the two most common structures in a double combination are one zigzag and one flat.
Within a possible flat correction for minor wave Y, minute wave a looks like a completed three. Minute wave b has now met the minimum 0.9 length of minute wave a, and it has moved beyond the start of minute wave a, indicating an expanded flat. Minute wave b is within the common range of 1 to 1.38 times the length of minute wave a. Expanded flats are very common structures.
Minute wave c would be extremely likely to end at least slightly below the end of minute wave a at 64.43 to avoid a truncation and a very rare running flat.
The purpose of the second structure in a double combination is to take up time and move price sideways. To achieve this purpose minor wave Y would be most likely to end about the same level as minor wave W about 63.60.
Minute wave c must subdivide as a five wave structure, most likely an impulse. Within the impulse, so far minuette waves (i) and (ii) may be complete. Minuette wave (iii) may still be incomplete and may only subdivide as an impulse. Within the impulse, subminuette wave iv may not move into subminuette wave i price territory above 70.51.
Price remains within the narrow best fit channel. Volume analysis still supports more downwards movement. It should be assumed that while price remains within this channel the current downwards trend remains intact.
ALTERNATE DAILY CHART
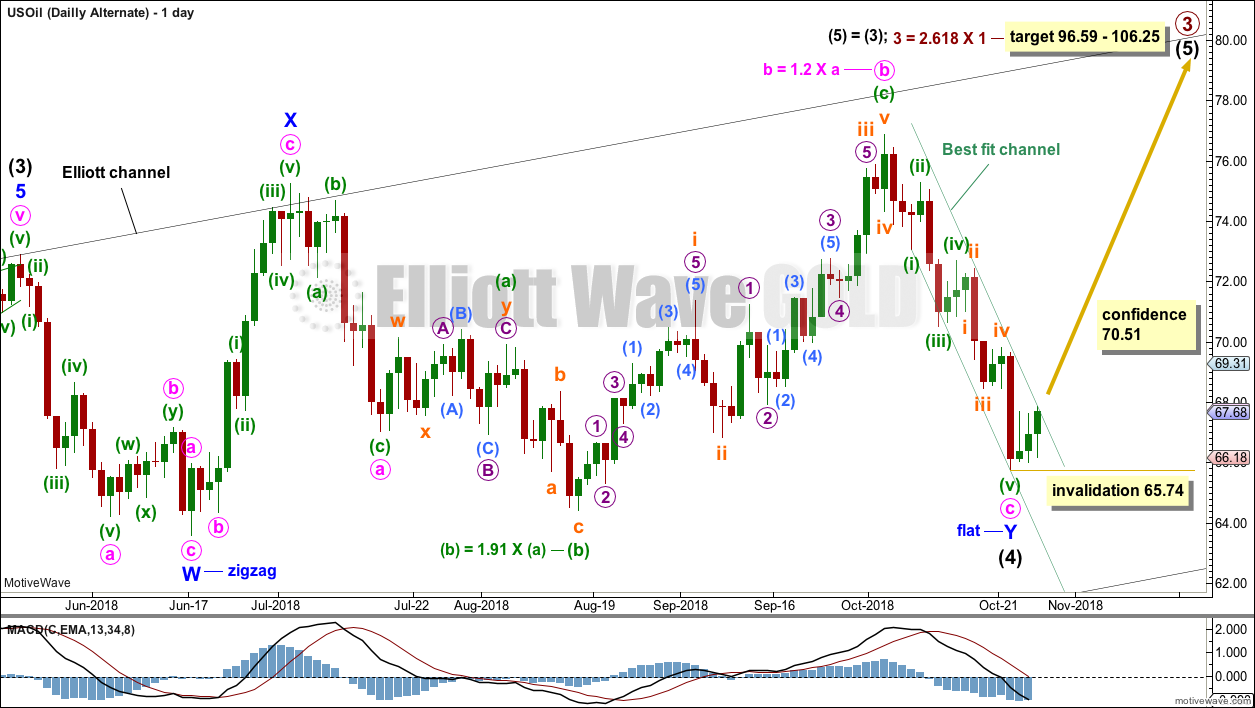
Click chart to enlarge.
It is possible to see a double combination complete at this week’s low.
This wave count is identical to the main daily chart up to the low labelled minor wave W.
Thereafter, a flat correction for minor wave Y is labelled slightly differently.
Within minor wave Y, minute wave a may have been over earlier. Minute wave b is now labelled as an expanded flat correction. This does not have quite as good a fit nor look as the main wave count.
Within the expanded flat, minuette wave (b) at 1.91 times the length of minuette wave (a) is reasonably longer than the common range of up to 1.38. This reduces the probability of this wave count.
Minuette wave (c) for this wave count must be seen as a five wave structure. While this will fit, it does not have as good a look as the main wave count seeing this upwards wave as a three wave zigzag.
If minor wave Y is complete, then it may have ended still reasonably close to minor wave W.
Within the new upwards wave of intermediate wave (5), no second wave correction may move beyond the start of its first wave below 65.74.
TECHNICAL ANALYSIS
MONTHLY CHART
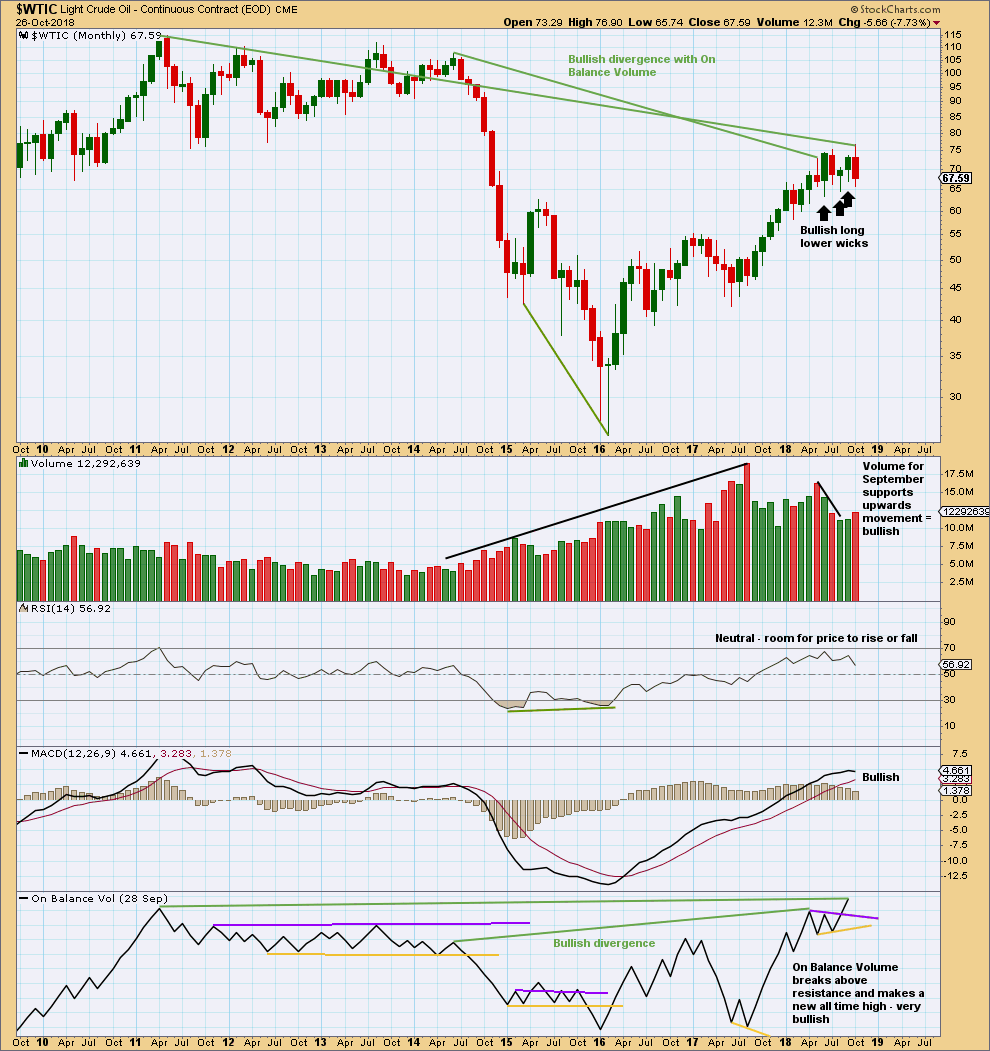
Click chart to enlarge. Chart courtesy of StockCharts.com.
The larger trend remains upwards.
The last three months have seen price move sideways. Three long and lower monthly wicks are bullish. Now September shows support from volume for upwards movement; the short term volume profile is now bullish.
On Balance Volume gives a bullish signal, breaking above resistance. On Balance Volume has also made a new high above the prior high of May 2011. As On Balance Volume should be read as a leading indicator, price may follow through with a new high above May 2011’s high.
WEEKLY CHART
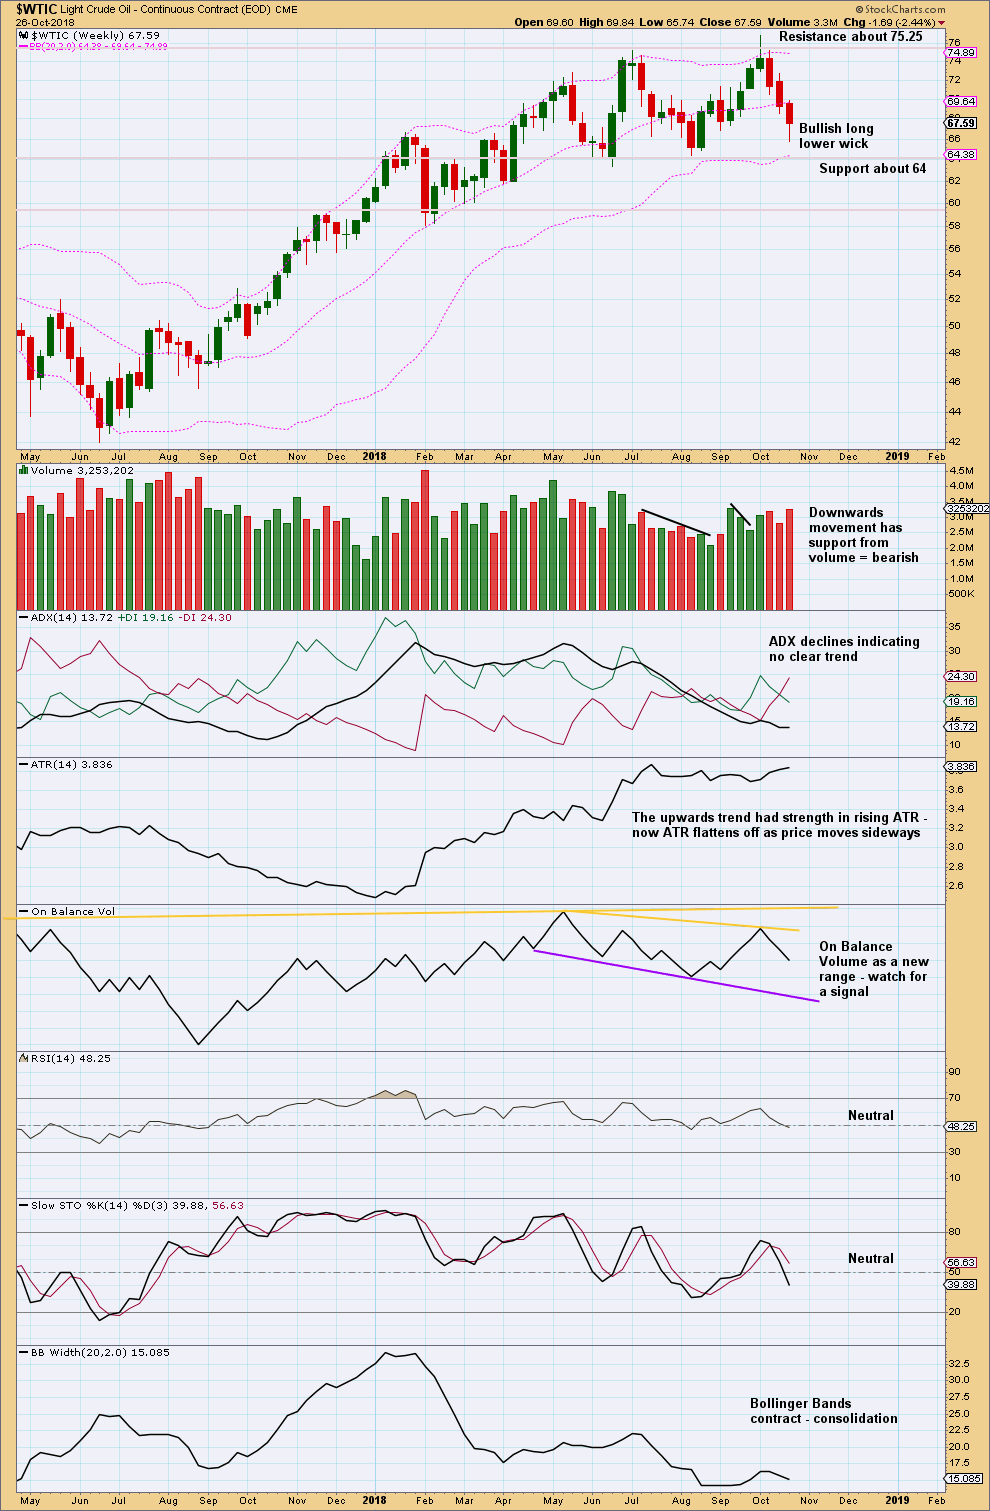
Click chart to enlarge. Chart courtesy of StockCharts.com.
It is upwards weeks during the consolidation that have strongest support from volume. This looks like a continuation pattern. The breakout would most likely be upwards.
A downwards swing within the consolidation is not yet at support, but it is close.
It is noted that for the current bull market for Oil, which began in February 2016, pullbacks along the way up have often ended on downwards weeks which had support from volume. Support this week for downwards movement may not necessarily indicate more downwards movement next week; it is possible that a low may be in this week.
The long lower wick this week is bullish. There is at this stage no candlestick reversal pattern to indicate an end to this pullback.
DAILY CHART
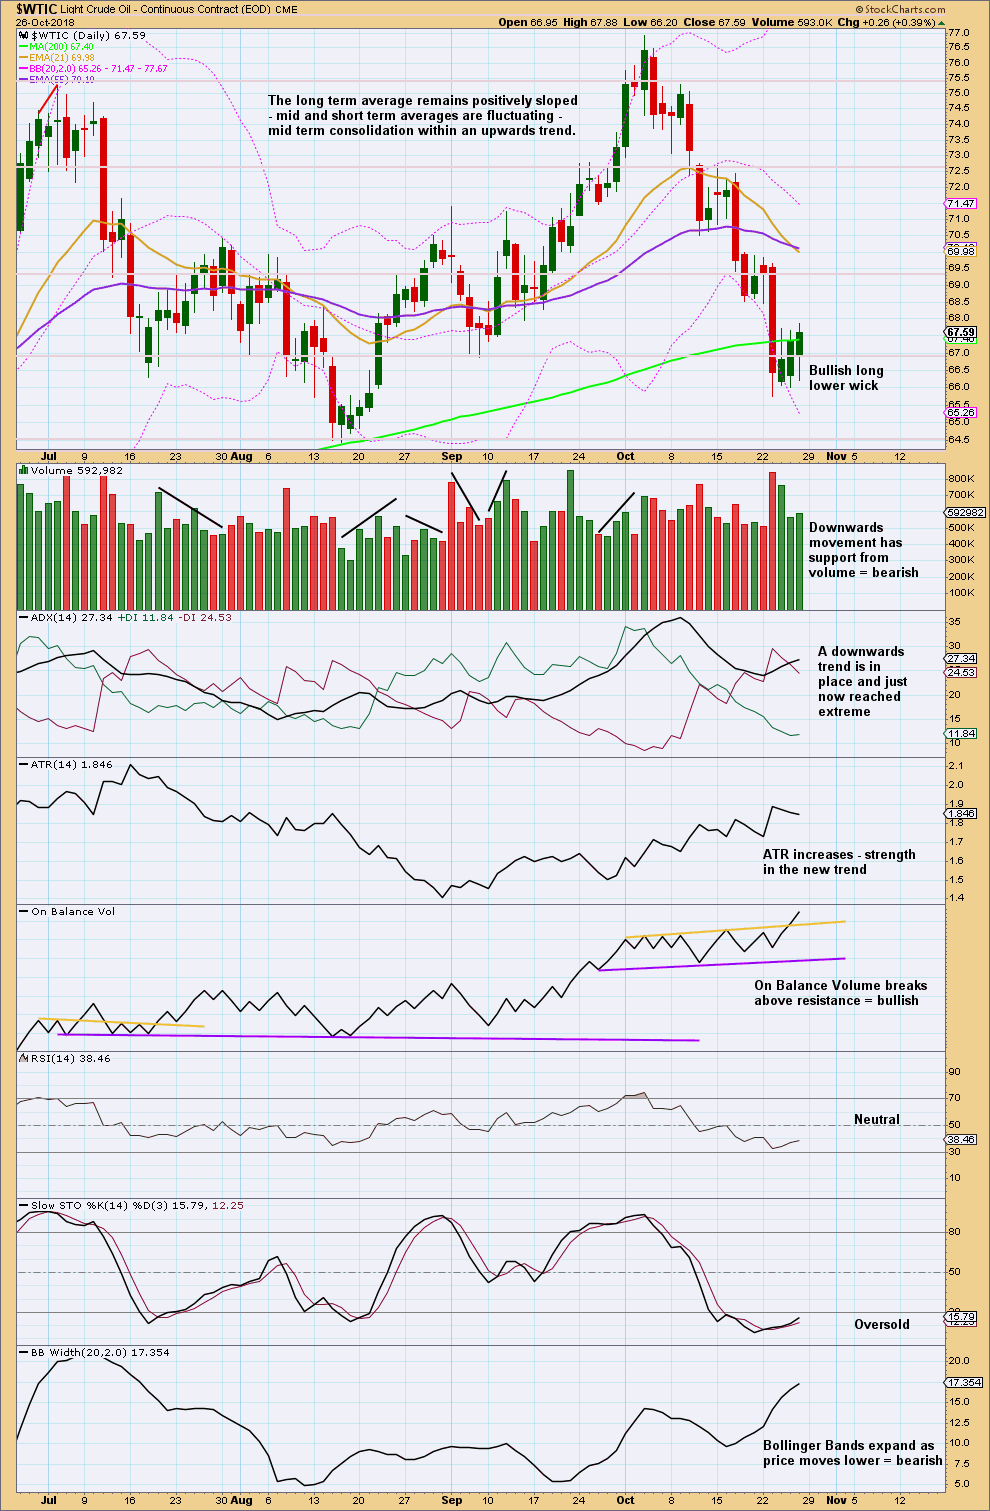
Click chart to enlarge. Chart courtesy of StockCharts.com.
Support about the 200 day moving average has been breached. The last three sessions may be a short back test of resistance.
The short term volume profile remains bearish. Look for support close by now about 64.40.
A reasonable bullish signal this week from On Balance Volume supports the idea that price may break out of this consolidation upwards.
This downwards swing is either over here or more likely over very soon. Look for a candlestick reversal pattern at the low.
—
Always practice good risk management as the most important aspect of trading. Always trade with stops and invest only 1-5% of equity on any one trade. Failure to manage risk is the most common mistake new traders make.
Getting close to the end of Minor Y and Intermediate 4 on OIL. I may begin scaling in soon, like next week.
Oil daily chart updated:
Adjust the best fit channel slightly. Draw the lower trend line first from the lows of minuette (i) to subminuette iii, then push a parallel copy up to sit along the upper candlestick wicks for the last two sessions.
This channel is too steep to have any reasonable technical significance. But it can be used as a very early warning. The breach would have to be clear and strong to take notice of it. If a good sized green daily candlestick moves above it that would be a warning a low may be in place.
But first, a new low below 64.43 is needed for minor Y to be an expanded flat (very common structures) and not a running flat (very rare structures).
Along the way down if my analysis of the structure of minute c is correct, then one more small bounce for minuette (iv) may unfold.
Thanks Lara for the mid-week update. It is much appreciated.
You’re most welcome Rodney.
Oil is taking it on the chin today (Tues. 10/30), big time. Main count is right on track. It looks like this week might be a good time to go long for a mid term to long term position trade. I will be using the leveraged ETF WTIU. Today its price is down around $30.
If we get a move to $100 on oil, I expect WTIU to move to around $75 or roughly 150% gain. When taking the long position, one could set a stop loss a couple of points below entry. This is good risk reward ratio. I am going to be all over it this week.
Not trading advice. Remember Lara’s warnings, 1%-5% equity on one trade & use stops.
Rodney,
I appreciate your posts. I started a position in the ETF USO yesterday at $14.10 with planned additions around $13.65 and $13.50 if those levels come to pass.
With your trading advice disclaimer acknowledged, I find your view of the risk reward opportunity using WTIU to be captivating. I will be considering the merits of that one.
Best wishes to you!
Thanks. I am still waiting for the end of Intermediate 4 (in oil of course).
Rodney, I use UCO, with a 1 or 2 % risk. UCO has good volume and is a 2x leverage etf. It would make sense to me a 3x would lose more value in a volatile market or commodity. I know you and Lara are very bullish on oil and I respect both opinions. I do think risk is very high for oil at this time. I use the Elliott wave oscillator and it is showing triple divergence on a weekly chart and has turned red. This afternoon I plan on looking at force index to make a judgement call. I would place a buy stop above today’s high. I would consider myself entry level swing trader. Please reply if you disagree with my thoughts, I’m a very open minded individual.
Yes, Bill, WTIU is thinly traded. But I think the liquidity is sufficient for my purposes.
How do you use the EW Oscillator? Do you use just the histogram or do you add moving averages etc? Thanks in advance for sharing.
EW oscillator is a measurement of momentum. Combine that with the alligator, 13 and 34 ema I look for impulsive moves in the market. This is all from Bill Williams 3 books. Right now both daily and weekly are moving lower with daily EW below 0 line. Momentum is weak and not showing weakness. I like what Lara shared breaking out of that trend channel.
*Momentum is weak and not showing strength*
$WTIC and XLE look very correlated in my opinion if you look at the attached chart on a longer term basis…
I am really disturbed by the weakness of oil stocks…. In Canada (where I am), it is horrible on how the Canadian Oil stocks are acting… They are much , much weaker than in the US….
If you draw a trend line under the lows of XLE, the trend is broken…
In stockcharts.com using XLE:$WTIC as the ticker, the chart is breaking down… Usually, in my book, the oil stocks should be a leverage play on top of Oil… It does not look like it now… This is very bearish for the sector…. So something is wrong… We have to let it play to see what’s going on…
Maybe the rise of interest rates is hurting the Oil sector…
In the Gold sector, it is also happening… GDX is much weaker than Gold… This is very bearish as well…
I am still in the camp that the S&P 500 is the strongest place to be as the rest of the world is pretty weak…
Thanks Lara for all you do.
Thanks Lara. Oil continues to look like the best market for traders / investors. It is trending and about to resume its long term up trend and it anticipates about a 50% move. Looking good.
I agree.
The S&P looks like it may be highly volatile for the next couple of months. Gold looks likely to be still either in a huge sideways consolidation, or to resume it’s bear market.
But Oil. Oil is the one to watch folks, IMO. It’s in a bull market, and there’s money to be made there.
Unless of course you can trade Silver or GDX short. Then they have excellent long held consolidations that have recently broken out down with volume.
Lara, that is great about oil but look at the XLE sector it has been hammered really hard☝️ It seems it does not anticipate any bull market in oil🤷🏼♂️🤷🏼♂️🤷🏼♂️ What is your veiw on that? It is much easier to bet on oil via oil stocks or sector like XLE but it has been crashing down with the market and even harder… 🤷🏼♂️🤷🏼♂️🤷🏼♂️ Moreover, it did not show any trend for the last year…. just consolidation within a range🤷🏼♂️ What do you think about it?
I checked the correlation coefficient between US Oil and XLE. While they often do have a positive correlation, this correlation is completely unreliable. The correlation coefficient at the monthly chart level between these two markets can reach close to zero.
I am analysing US Oil here, not XLE. And with no reliable correlation between these two markets I am not going to make an assumption that what XLE does has any bearing on what US Oil price should do.
Have a read of this. I’ve tried to explain here the conventional way of using a correlation coefficient, and what it is.
I have a bunch of articles in the “education” category: access them when you are logged in and can see the RH sidebar. Go to the “category” drop down box, choose “education”.
There are a few pages there which cover most of the technical indicators I use, and some other stuff.
Thanks I also do not see any significant correlation and that is why it looks strange….if the trend in oil is up the oil shares follow maybe with some lag…. but, they are going severely the opposite direction…. and it looks disturbing☝️🤷🏼♂️
When I look at XLE it looks like it could possibly be basing action since February 2016.
While price remains above the low of February 2016 then the trend may be neutral for this instrument.
It’s had a huge consolidation with resistance about 79.40 and support about 61.80. It’s a downwards week which has strongest volume, but I haven’t looked there at daily volume.
Watch for a breakout. A hedge there may be a profitable option. Or wait to enter only after a clear breakout with support from volume (for upwards).
Guys, the thing is everything depends on DXY☝️☝️☝️If it spikes up to 100-101( maybe Bank of China devalues yuan, then , SP goes deeply in C ( and all the oil and gold stocks too almost everything) maybe up to 2200-2300 level in SP then FedReserve will give up raising rates and even starts to change policy and push DXY lower then we will see big rally in all the Oil sector, materials, gold and emerging markets…. we are not there yet! Hope democrats win the lower house at least and this will prevent overall huge worldwide crisis and at least postpone it☝️☝️☝️ Still hoping for DXY much lower after the spike and SP will eventually come to 3600 target with oil and gold, EM and raw materials rally☝️☝️☝️ So, we will see much more volatility ahead before DXY tops somewhere above 100 and below 103,7☝️