
The consolidation continues. The breakout direction is expected to be the same.
Summary: Price continues to consolidate with resistance about 14.95 and support about 14.25. Look for an upwards breakout now most likely next week but possibly the week after. There is very strong resistance above at 15.60. Price may be bouncing up to test this resistance. If it does so, then it would be highly likely to turn there and begin a sustained downwards trend.
The larger trend remains down until proven otherwise.
Monthly charts were reviewed here.
New updates to this analysis are in bold.
ELLIOTT WAVE COUNTS
MAIN WAVE COUNT
WEEKLY CHART – TRIANGLE
Click chart to enlarge.
This first wave count has good support from classic technical analysis, so it will be favoured. This wave count looks likely.
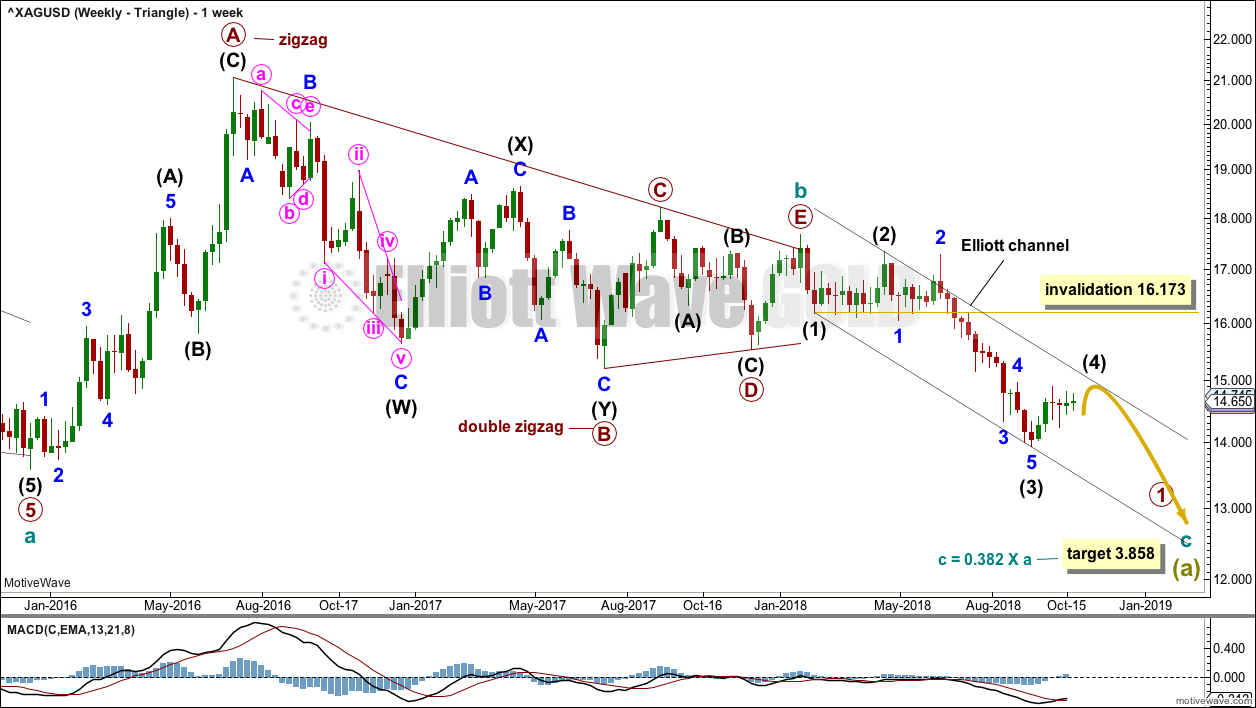
The first wave count expects that the bear market, which began from the April 2011 high, is incomplete.
Cycle wave a is seen as a five wave impulse for this main wave count. There are multiple corrective structures possible still for cycle wave b.
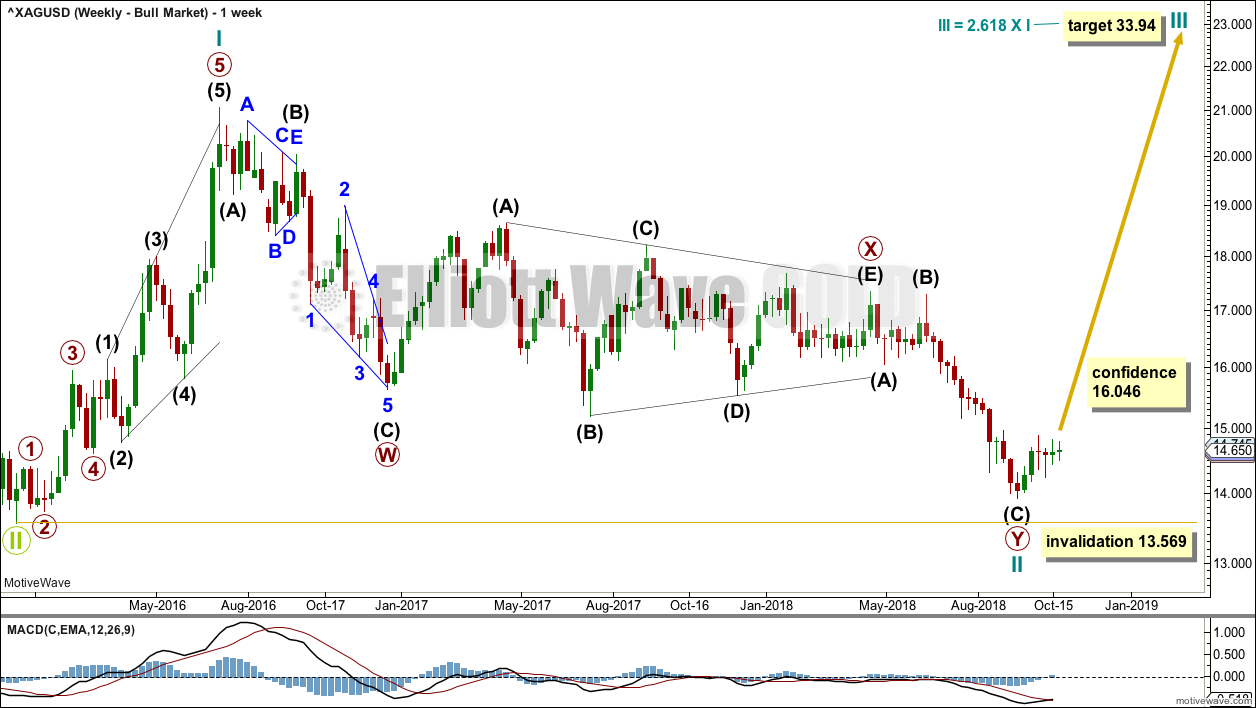
This first weekly chart sees cycle wave b as a now possibly complete regular contracting triangle.
Primary wave E of the triangle may have ended with an overshoot of the A-C trend line.
Within cycle wave c, primary wave 1 may be an incomplete impulse. Within primary wave 1, intermediate waves (1), (2) and (3) may now be complete.
Intermediate wave (4) may not move into intermediate wave (1) price territory above 16.173.
Intermediate wave (2) was a deep 0.77 flat correction lasting ten weeks. Intermediate wave (4) may most likely be a zigzag and may last a Fibonacci eight or thirteen weeks. It would most likely be shallow.
The Elliott channel is drawn from the ends of intermediate degree waves. The upper edge may provide resistance for intermediate wave (4).
Fourth waves are not always contained within a channel drawn using Elliott’s first technique. If intermediate wave (4) breaches the upper edge of this channel, then when it is complete the channel may be redrawn using Elliott’s second technique.
DAILY CHART – TRIANGLE
Click chart to enlarge.
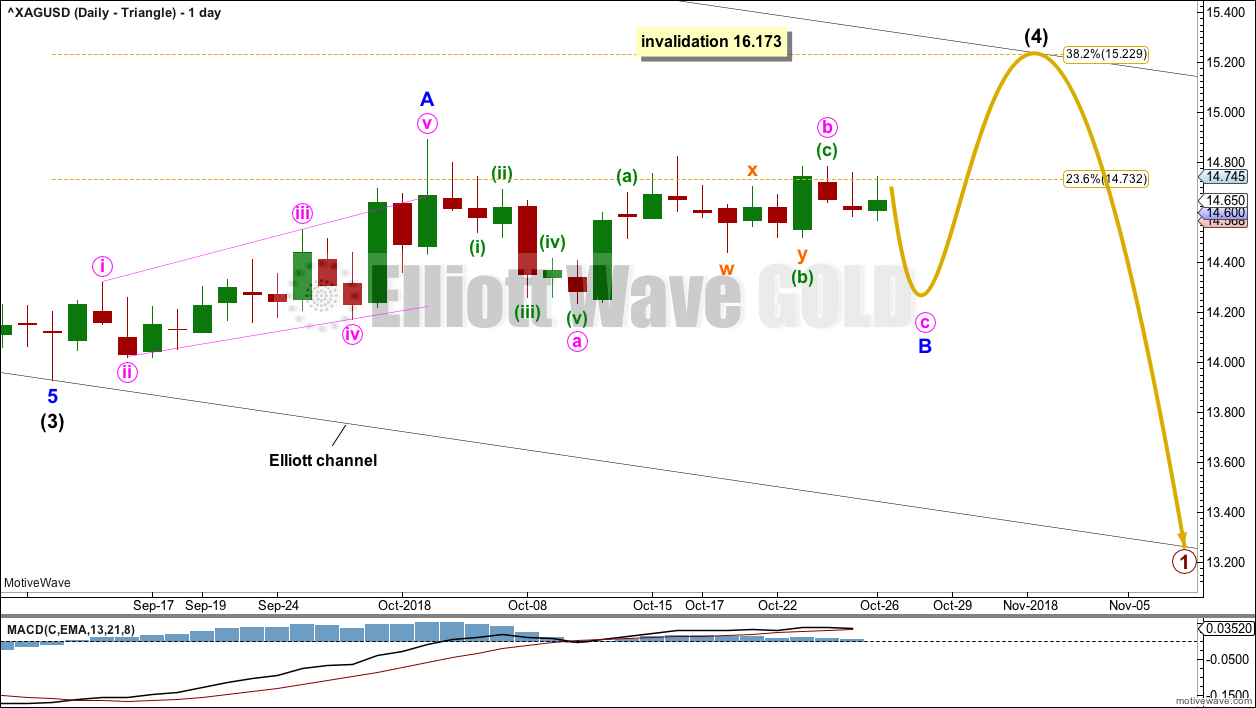
Intermediate wave (4) may have begun with a five wave structure for minor wave A, which subdivides as a leading expanding diagonal.
If minor wave A is a five wave structure, then minor wave B may not move beyond its start below 13.929. However, it is also possible to see minor wave A as a multiple zigzag, which is a corrective structure and classified as a three. If minor wave A is a three, then minor wave B may make a new low below its start; there is no lower invalidation point for this reason.
Minor wave B may end next week as a zigzag. Within the zigzag, minute wave c would be most likely to make at least a slight new low below the end of minute wave a at 14.236 to avoid a truncation.
Overall, intermediate wave (4) may continue for a few weeks more. If it finds resistance about the upper edge of the Elliott channel, then it may end close to the 0.382 Fibonacci ratio.
WEEKLY CHART – COMBINATION
Click chart to enlarge.
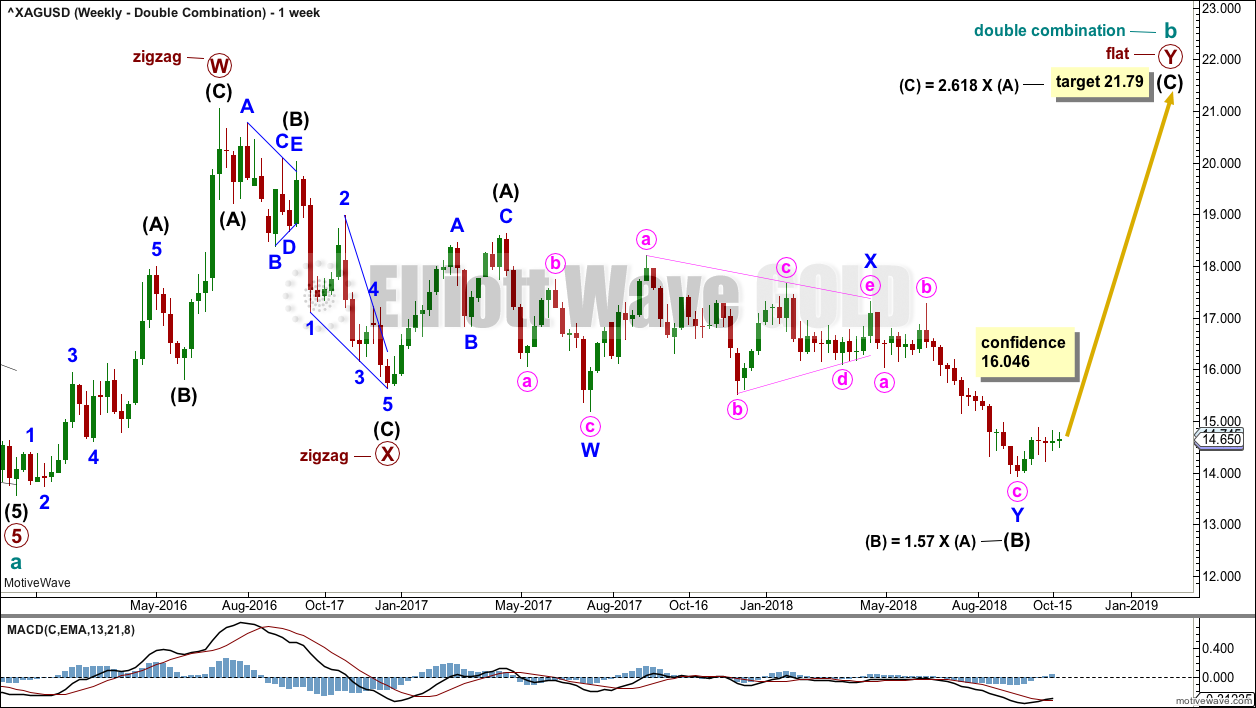
Cycle wave b may still be completing as a double combination: zigzag – X – flat. The second structure, a flat correction for primary wave Y, may be underway.
Within a flat correction, intermediate wave (B) has now met and passed the minimum 0.9 length of intermediate wave (A) at 15.938.
The purpose of combinations is to take up time and move price sideways. To achieve this purpose the second structure in the double normally ends about the same level as the first.
Intermediate wave (B) may be over. Intermediate wave (C) may now continue as a large five wave motive structure higher. A target is calculated for intermediate wave (C) that expects it to end reasonably close to the 21.062, so that primary wave Y ends about the same level as primary wave W.
DAILY CHART – COMBINATION
Click chart to enlarge.
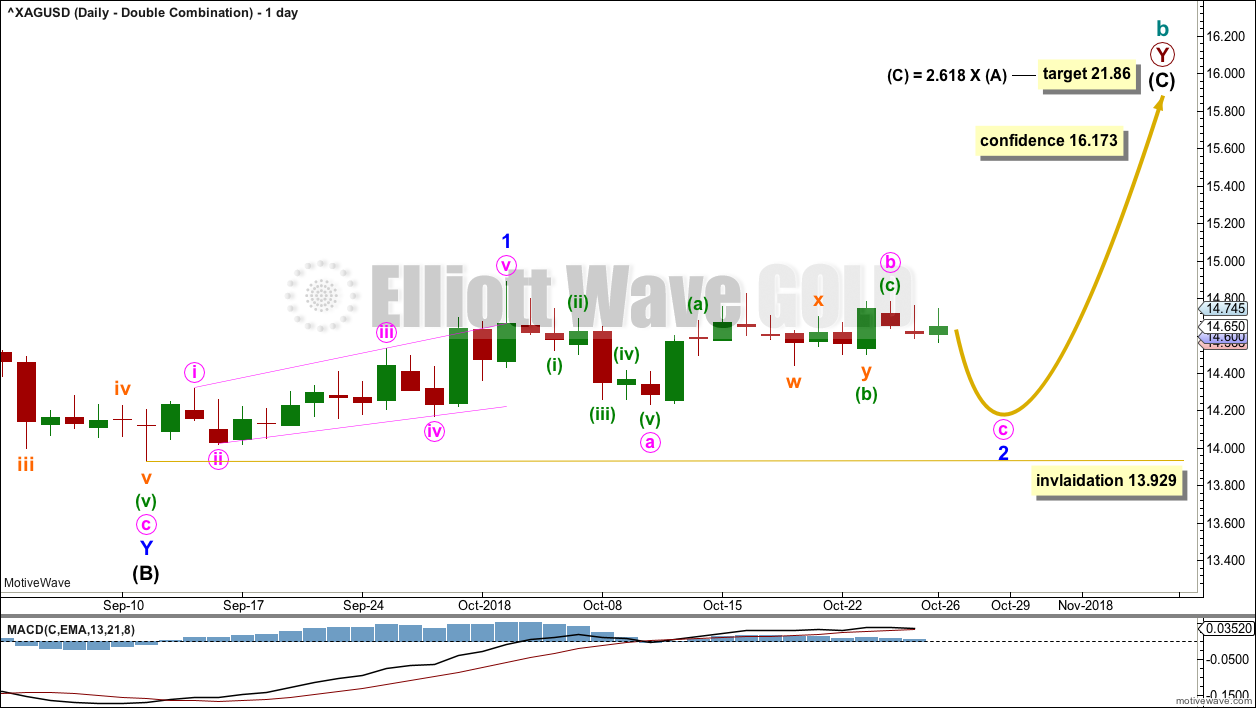
A new high above 16.173 would invalidate the first triangle wave count and offer some confidence in this combination wave count. At that stage, the downwards breakout may be considered false and a new upwards wave may be underway.
Intermediate wave (C) must subdivide as a five wave structure. Within intermediate wave (C), minor wave 2 may not move beyond the start of minor wave 1 below 13.929.
Minor wave 2 may be unfolding as a zigzag. Within the zigzag, minute wave c would be most likely to make at least a slight new low below the end of minute wave a at 14.236 to avoid a truncation.
When minor wave 2 is complete, then an upwards breakout from the current consolidation would be expected with an increase in upwards momentum and support from volume.
ALTERNATE WAVE COUNT
WEEKLY CHART – BULL WAVE COUNT
Click chart to enlarge.
Cycle wave II may be a complete double zigzag. Cycle wave II would be very deep at 0.95 of cycle wave I. This is typical behaviour for the first second wave correction within a new trend for commodities.
If it continues any further, then cycle wave II may not move beyond the start of cycle wave I below 13.569.
DAILY CHART – BULL WAVE COUNT
Click chart to enlarge.
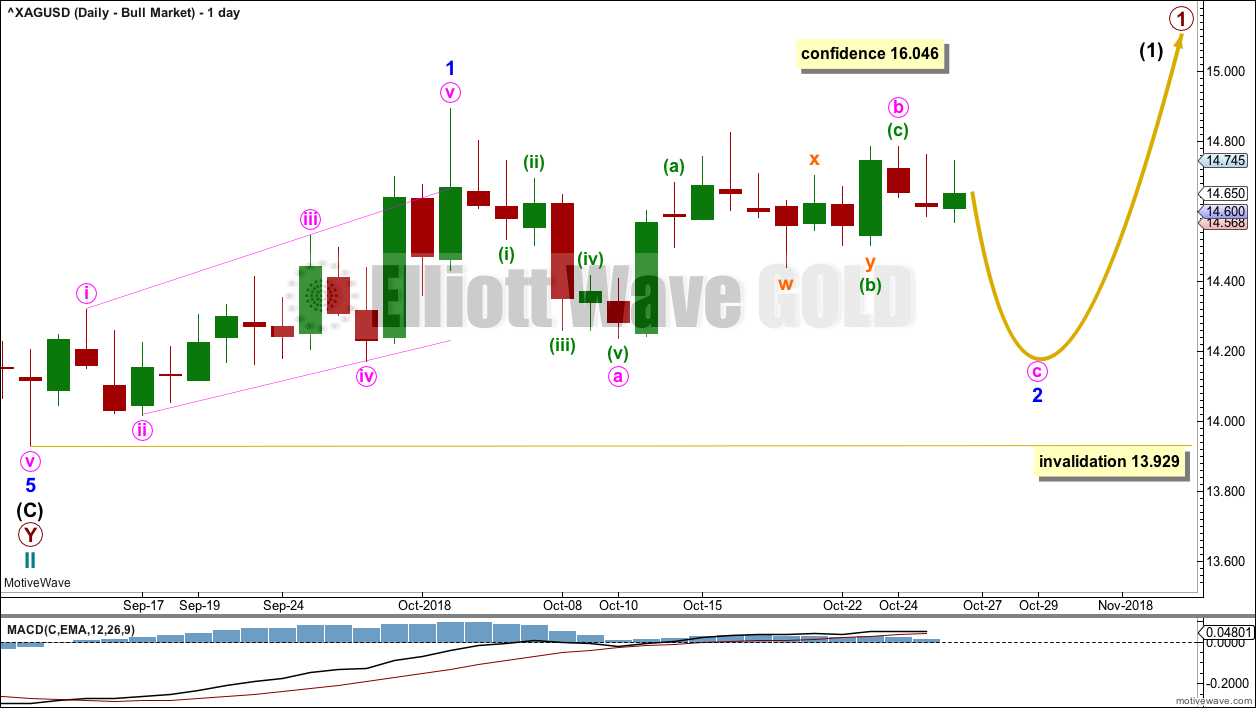
A five wave impulse (down) for intermediate wave (C) may be complete for this wave count.
If cycle wave II is over, then the new trend up for cycle wave III should begin with a five wave structure. That may now be a complete leading expanding diagonal, which is labelled minor wave 1. Minor wave 2 may not move beyond the start of minor wave 1 below 13.929.
TECHNICAL ANALYSIS
WEEKLY CHART
Click chart to enlarge. Chart courtesy of StockCharts.com.
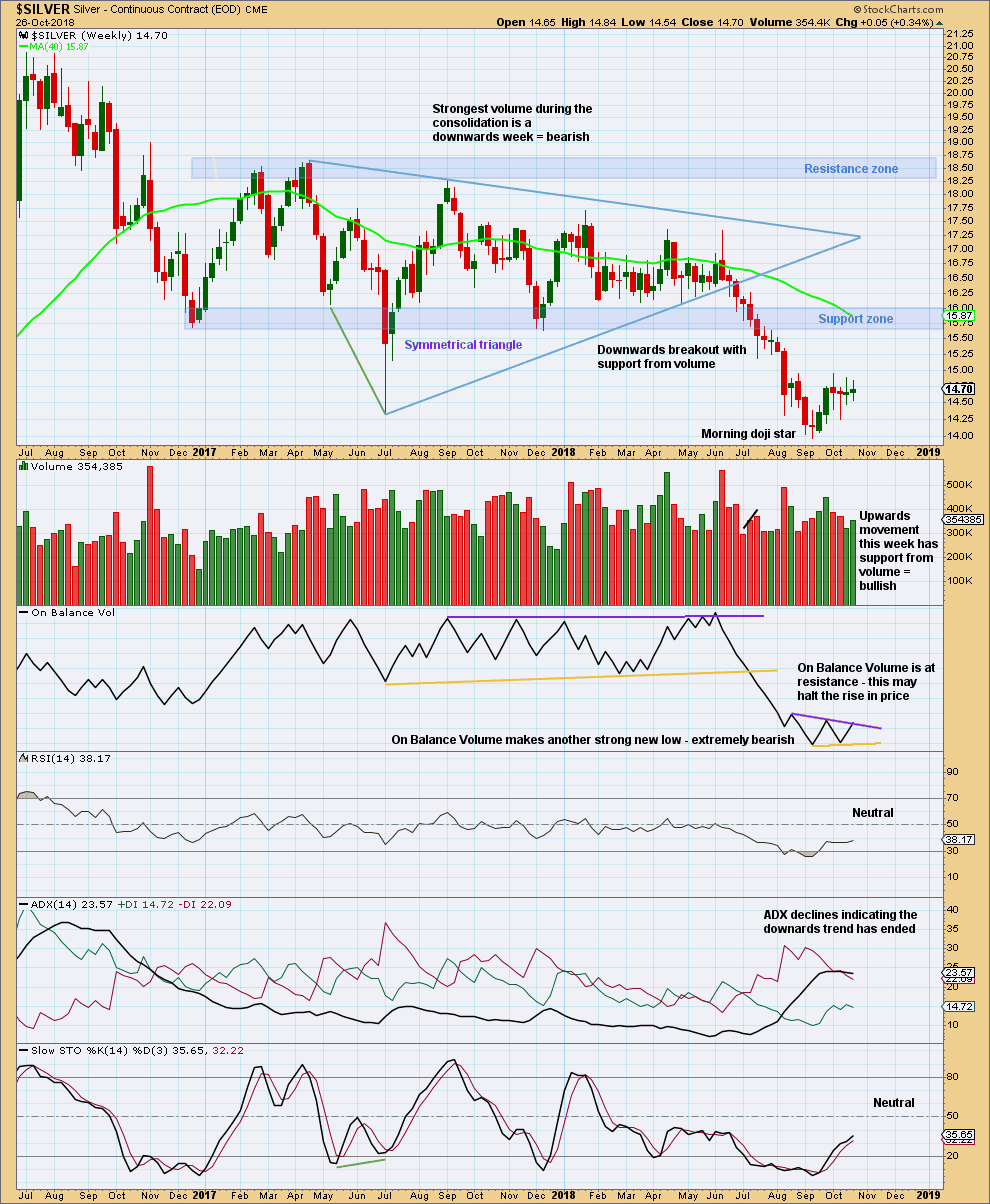
Silver has seen a classic downwards breakout from the shaded support zone, which then provided resistance for a small back test.
It is possible that price may now bounce up to test resistance at prior support. The short term volume profile remains bullish.
A target from the breakout of the symmetrical triangle is about 12.08.
If price does bounce up to test resistance about 15.65 to 15.75, that may offer a good entry point for a short position on Silver, which may be held for months.
DAILY CHART

Click chart to enlarge. Chart courtesy of StockCharts.com.
Silver is within a smaller short term consolidation with resistance about 14.95 and support about 14.25. It is four upwards days during this consolidation which all have strongest volume, giving reasonable confidence that an upwards breakout is more likely than downwards.
For the short term, a pennant pattern may be forming. But this is not a very good example, because it is a little too long in duration (the best flags and pennants form within 15 days; this one has lasted 19 days so far), and it is not preceded by a very steep rise in price. Using the measured rule a possible target may be about 15.79.
Look out for resistance at 15.65 – 15.75. If Stochastics reaches overbought while price reaches resistance, then look for the upwards bounce to end there.
Published @ 03:15 a.m. EST on October 29, 2018.
—
Careful risk management protects your trading account(s).
Follow my two Golden Rules:
1. Always trade with stops.
2. Risk only 1-5% of equity on any one trade.