
Upwards movement was expected for Silver for the week, which is what has happened.
Summary: Look now for price to bounce higher to test resistance about 15.65. The bounce may last several weeks.
The larger trend remains down until proven otherwise.
Monthly charts were reviewed here.
New updates to this analysis are in bold.
ELLIOTT WAVE COUNTS
MAIN WAVE COUNT
WEEKLY CHART – TRIANGLE
Click chart to enlarge.
This first wave count has good support from classic technical analysis, so it will be favoured. This wave count looks likely.
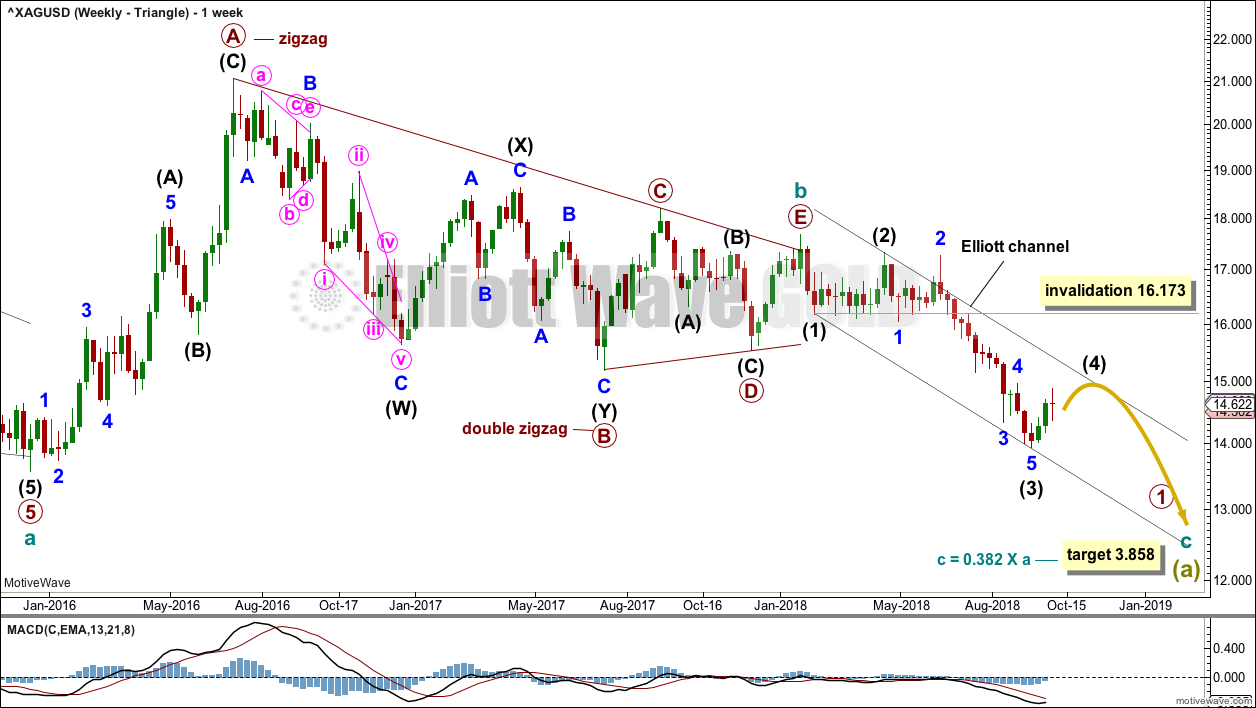
The first wave count expects that the bear market, which began from the April 2011 high, is incomplete.
Cycle wave a is seen as a five wave impulse for this main wave count. There are multiple corrective structures possible still for cycle wave b.
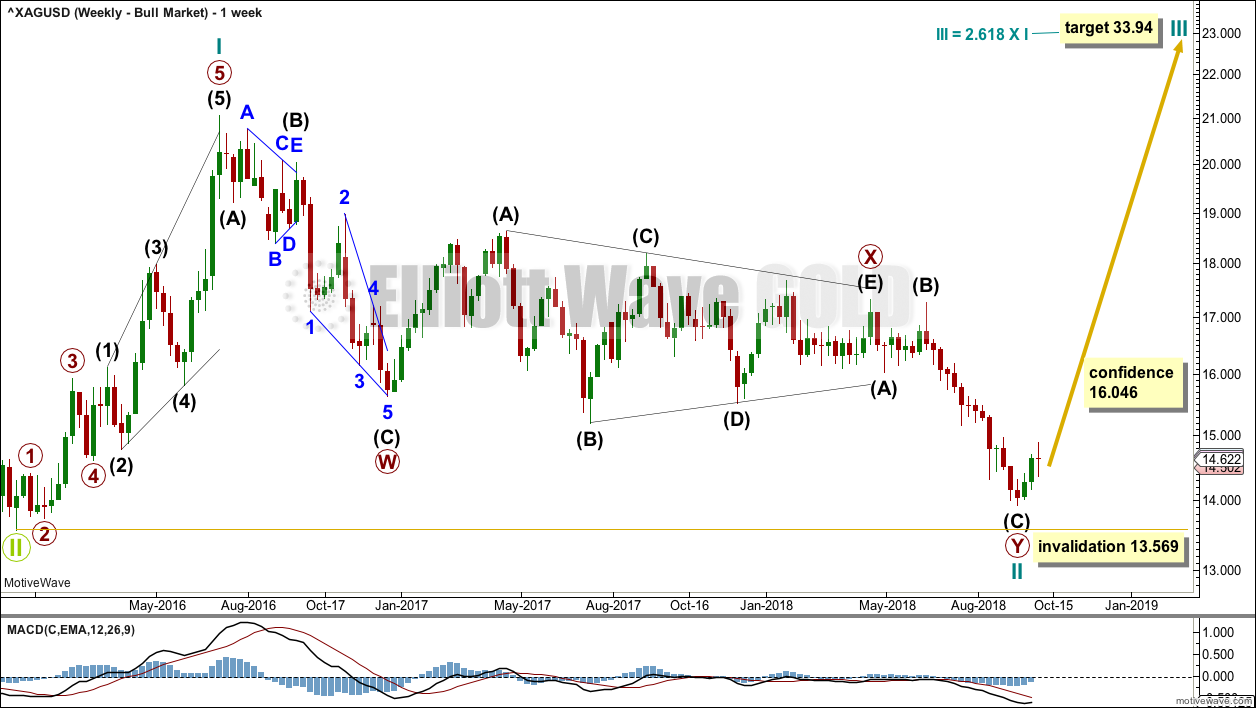
This first weekly chart sees cycle wave b as a now possibly complete regular contracting triangle.
Primary wave E of the triangle may have ended with an overshoot of the A-C trend line.
Within cycle wave c, primary wave 1 may be an incomplete impulse. Within primary wave 1, intermediate waves (1), (2) and (3) may now be complete.
Intermediate wave (4) may not move into intermediate wave (1) price territory above 16.173.
Intermediate wave (2) was a deep 0.77 flat correction lasting ten weeks. Intermediate wave (4) may most likely be a zigzag and may last a Fibonacci five, eight or thirteen weeks. It would most likely be shallow.
The Elliott channel is redrawn from the ends of intermediate degree waves. The upper edge may provide resistance for intermediate wave (4).
DAILY CHART – TRIANGLE
Click chart to enlarge.
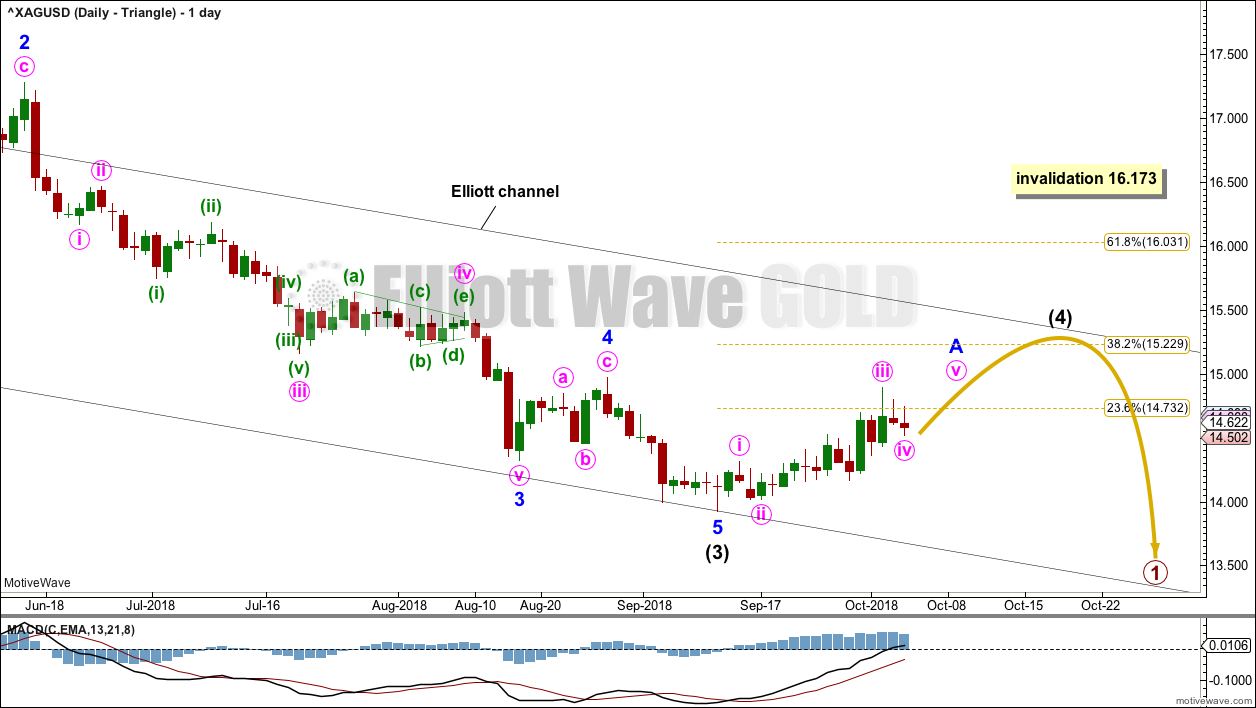
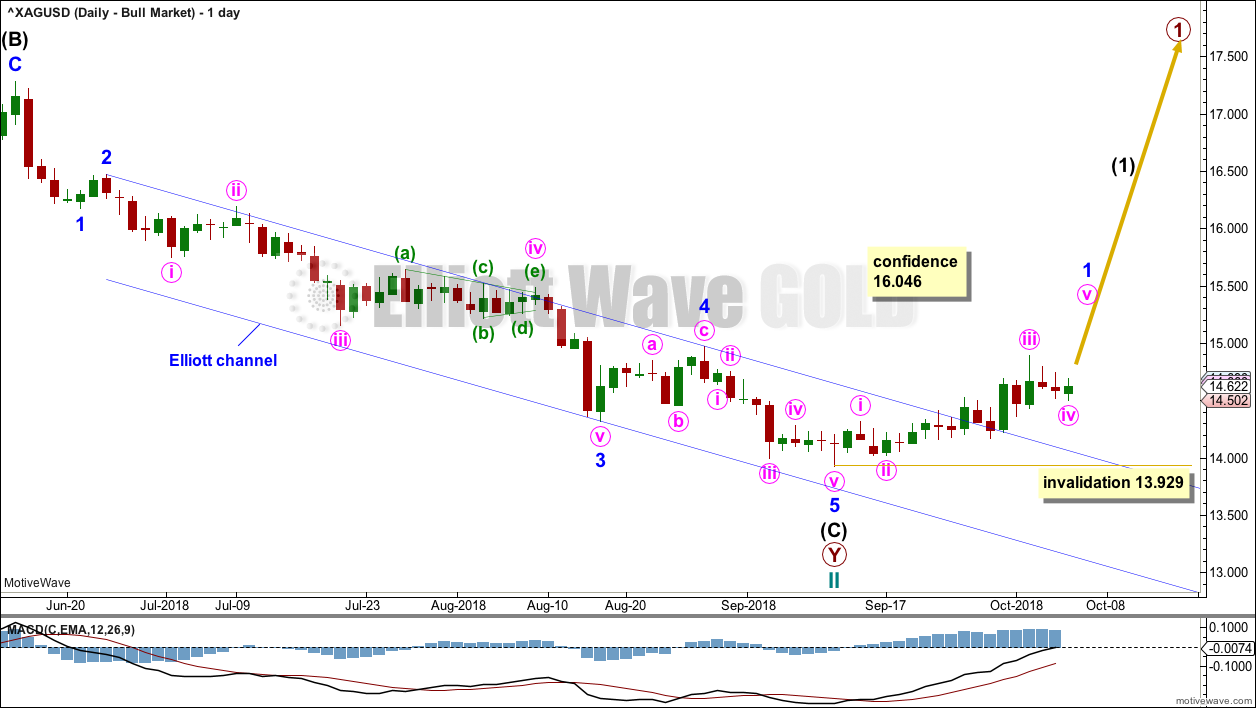
Intermediate wave (4) may begin with a five up on the daily chart if it subdivides as a zigzag.
If intermediate wave (4) finds resistance about the upper edge of the Elliott channel, then it may end about the 0.382 Fibonacci ratio of intermediate wave (3).
WEEKLY CHART – COMBINATION
Click chart to enlarge.
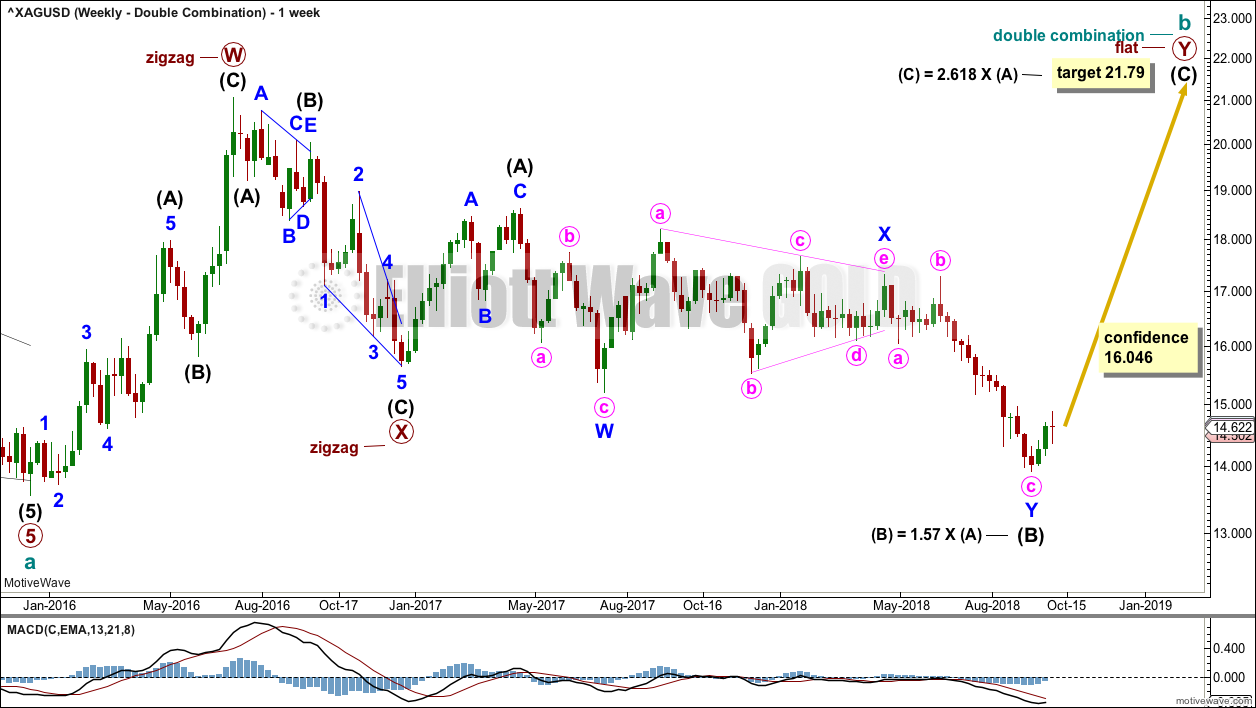
Cycle wave b may still be completing as a double combination: zigzag – X – flat. The second structure, a flat correction for primary wave Y, may be underway.
Within a flat correction, intermediate wave (B) has now met and passed the minimum 0.9 length of intermediate wave (A) at 15.938.
The purpose of combinations is to take up time and move price sideways. To achieve this purpose the second structure in the double normally ends about the same level as the first.
Intermediate wave (B) may be over. Intermediate wave (C) may now continue as a large five wave motive structure higher. A target is calculated for intermediate wave (C) that expects it to end reasonably close to the 21.062, so that primary wave Y ends about the same level as primary wave W.
DAILY CHART – COMBINATION
Click chart to enlarge.
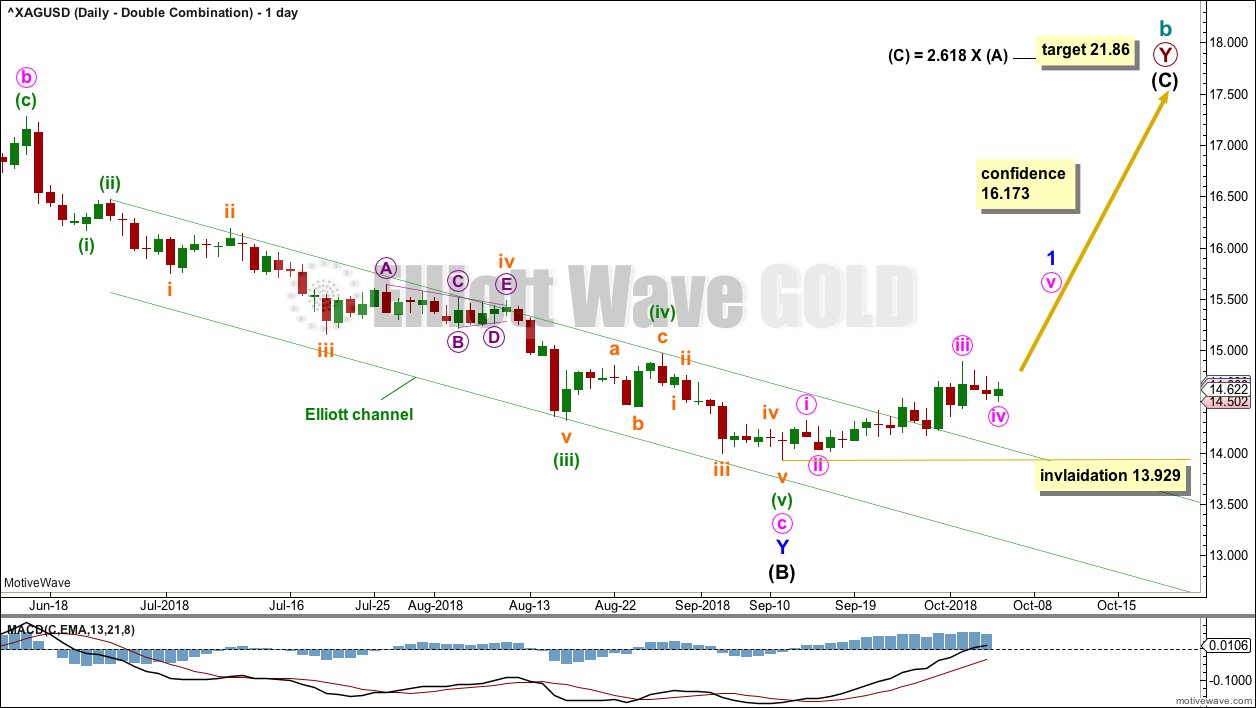
Within the zigzag of minor wave Y, minute wave c may be a complete five wave structure.
A new high above 16.173 would invalidate the first triangle wave count and offer some confidence in this combination wave count. At that stage, the downwards breakout may be considered false and a new upwards wave may be underway.
Intermediate wave (C) must subdivide as a five wave structure. Within intermediate wave (C), minor wave 2 may not move beyond the start of minor wave 1 below 13.929.
ALTERNATE WAVE COUNT
WEEKLY CHART – BULL WAVE COUNT
Click chart to enlarge.
Cycle wave II may be a complete double zigzag. Cycle wave II would be very deep at 0.95 of cycle wave I. This is typical behaviour for the first second wave correction within a new trend for commodities.
If it continues any further, then cycle wave II may not move beyond the start of cycle wave I below 13.569.
DAILY CHART – BULL WAVE COUNT
Click chart to enlarge.
A five wave impulse (down) for intermediate wave (C) may be complete for this wave count.
If cycle wave II is over, then the new trend up for cycle wave III should begin with a five wave structure. So far that would be incomplete. Within the new upwards trend, minor wave 2 may not move beyond the start of minor wave 1 below 13.929.
TECHNICAL ANALYSIS
WEEKLY CHART
Click chart to enlarge. Chart courtesy of StockCharts.com.
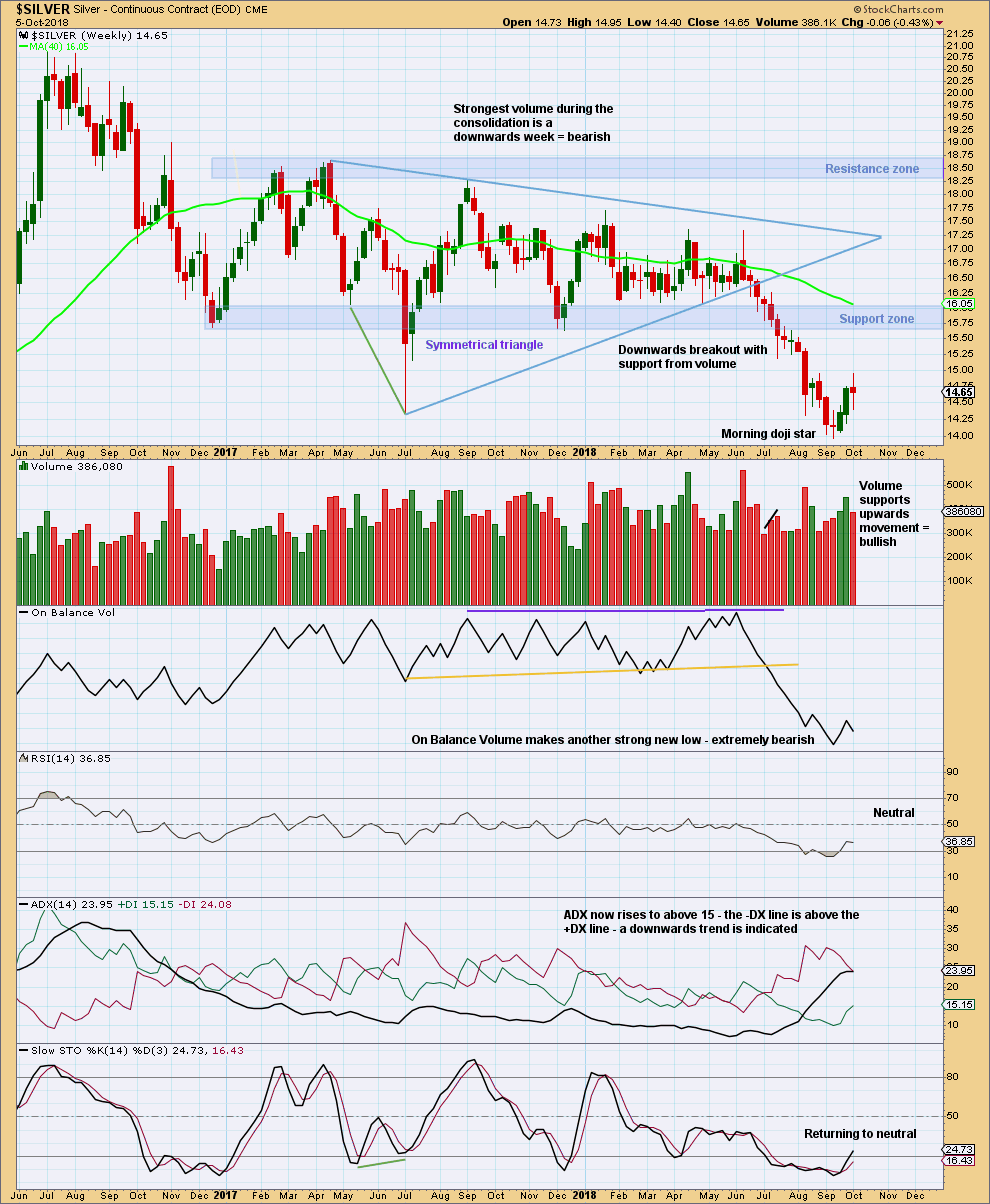
Silver has seen a classic downwards breakout from the shaded support zone, which then provided resistance for a small back test. It is possible that another back test may come.
ADX is giving the strongest signal it can give, rising from a low level below both directional lines. The trend is not yet extreme.
It looks like for the short to mid term a low is in place; the Morning Doji Star candlestick reversal pattern should be given reasonable weight here, and upwards movement has support from volume.
It is possible that price may now consolidate or bounce up to test resistance at prior support.
A target from the breakout of the symmetrical triangle is about 12.08.
DAILY CHART
Click chart to enlarge. Chart courtesy of StockCharts.com.
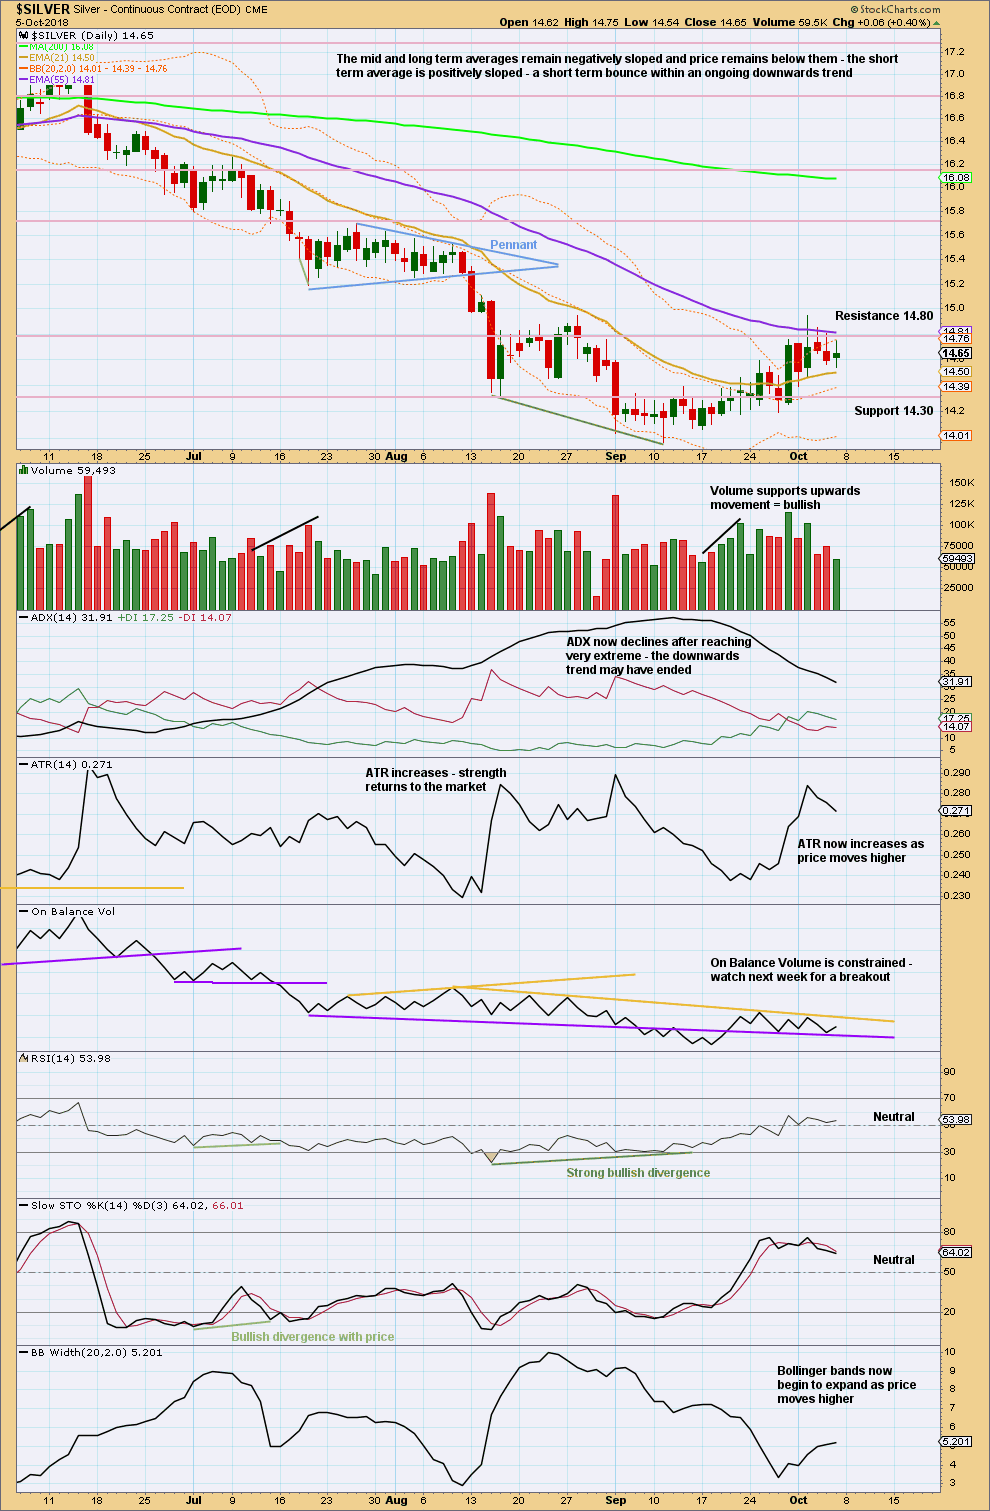
Resistance is about 14.80 currently. If price breaks above resistance here, then next strong resistance is about 15.65 – 15.75.
Watch On Balance Volume carefully next week. A breakout there may precede the next direction for price.
Published @ 11:14 p.m. EST on 6th October, 2018.
—
Careful risk management protects your trading account(s).
Follow my two Golden Rules:
1. Always trade with stops.
2. Risk only 1-5% of equity on any one trade.