
Sideways and slightly lower movement was expected for the week as a pullback unfolds. Price has moved lower, more than anticipated, but it remains well within the allowable limits for this pullback. Both Elliott wave counts remain valid.
This week volume analysis is used to determine where this pullback may end, and specific trading advice is offered to members.
Summary: Pullbacks may be used as opportunities to join the upwards trend. This pullback may end very soon. Risk is at 66.86; as long as price remains above 66.86, it may be a very good opportunity to enter long positions which may be held for several weeks. A possible profit target is at 106.25, but be prepared to adjust this profit target upwards. Look out for the possibility of blow off top coming in a few weeks.
Members who are prepared to hold an underwater position for a few days may enter here as price is close to 66.86. Members who are not prepared to hold an underwater position may wait a few days; the risk there is that the pullback could be over more quickly than the Elliott wave count expects.
If price makes a new low below 66.86, then the preferred triangle daily chart would be invalidated and the combination daily chart would then have confidence. If this happens, then expect more downwards movement to about 63.60 before the pullback finally ends. If that happens, long positions may be closed for a small loss and another entry opportunity may occur in another week to two.
New updates to this analysis are in bold.
MAIN WAVE COUNT
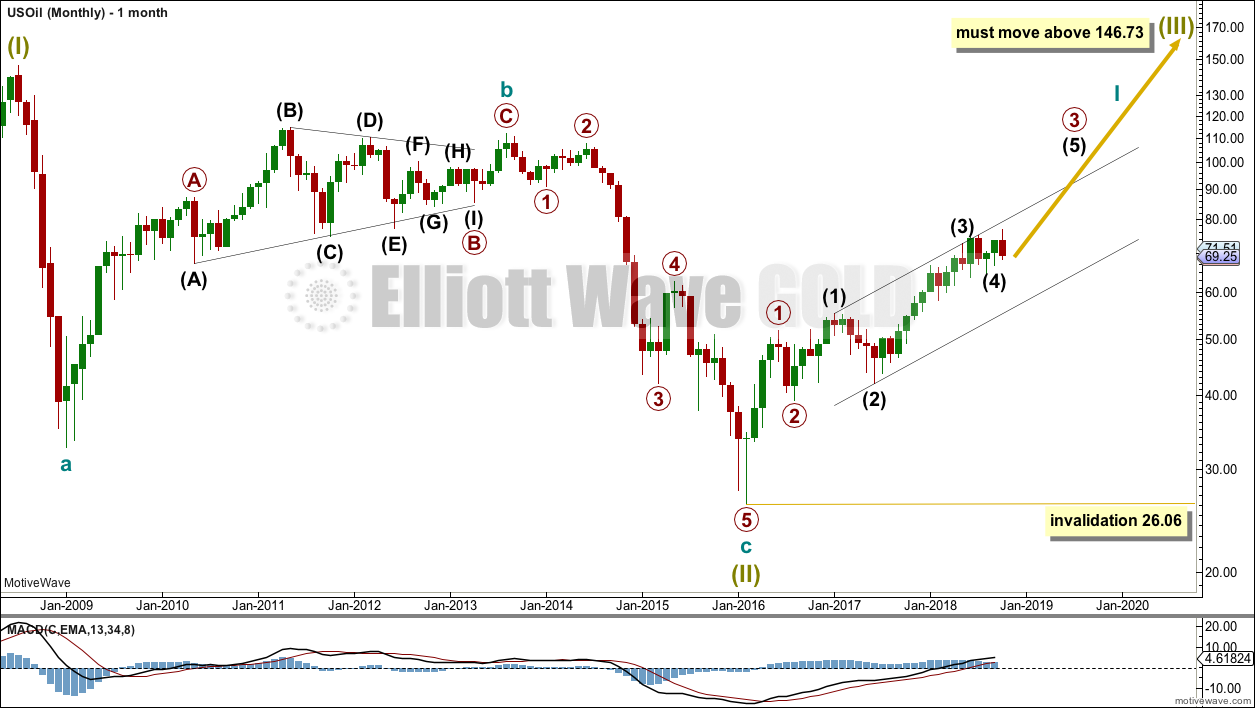
MONTHLY CHART
Click chart to enlarge.
The bear market for US Oil looks to be over and a new bull market looks to be in its early stages. The prior bearish wave count has been invalidated, leaving only this very bullish wave count.
A huge zigzag down to the last low may be complete and is labelled here Super Cycle wave (II).
Cycle wave b must be seen as complete in August 2013 for this wave count to work. It cannot be seen as complete at the prior major swing high in May 2011.
Cycle wave b is seen as a zigzag, and within it primary wave B is seen as a running contracting triangle. These are fairly common structures, although nine wave triangles are uncommon. All subdivisions fit.
Primary wave C moves beyond the end of primary wave A, so it avoids a truncation. But it does not have to move above the price territory of primary wave B to avoid a truncation, which is an important distinction.
If cycle wave b begins there, then cycle wave c may be seen as a complete five wave impulse.
Super Cycle wave (III) must move beyond the end of Super Cycle wave (I). It must move far enough above that point to allow room for a subsequent Super Cycle wave (IV) to unfold and remain above Super Cycle wave (I) price territory.
Cycle wave I may be incomplete. It may be unfolding as an impulse and may have now moved through the middle portion. Commodities have a tendency to exhibit swift strong fifth waves, and this tendency is especially prevalent for third wave impulses. Intermediate wave (5) to end primary wave 3 may be very swift and strong, ending with a blow off top.
When cycle wave I is complete, then cycle wave II may be a deep correction that may not move beyond the start of cycle wave I below 26.06.
Data from FXCM for USOil does not go back to the beginning of Super Cycle wave (I). Without an accurate known length of Super Cycle wave (I) a target cannot be calculated for Super Cycle wave (III) to end using Fibonacci ratios. The target for Super Cycle wave (III) may be calculated when cycle waves I, II, III and IV within it are complete. That cannot be done for many years.
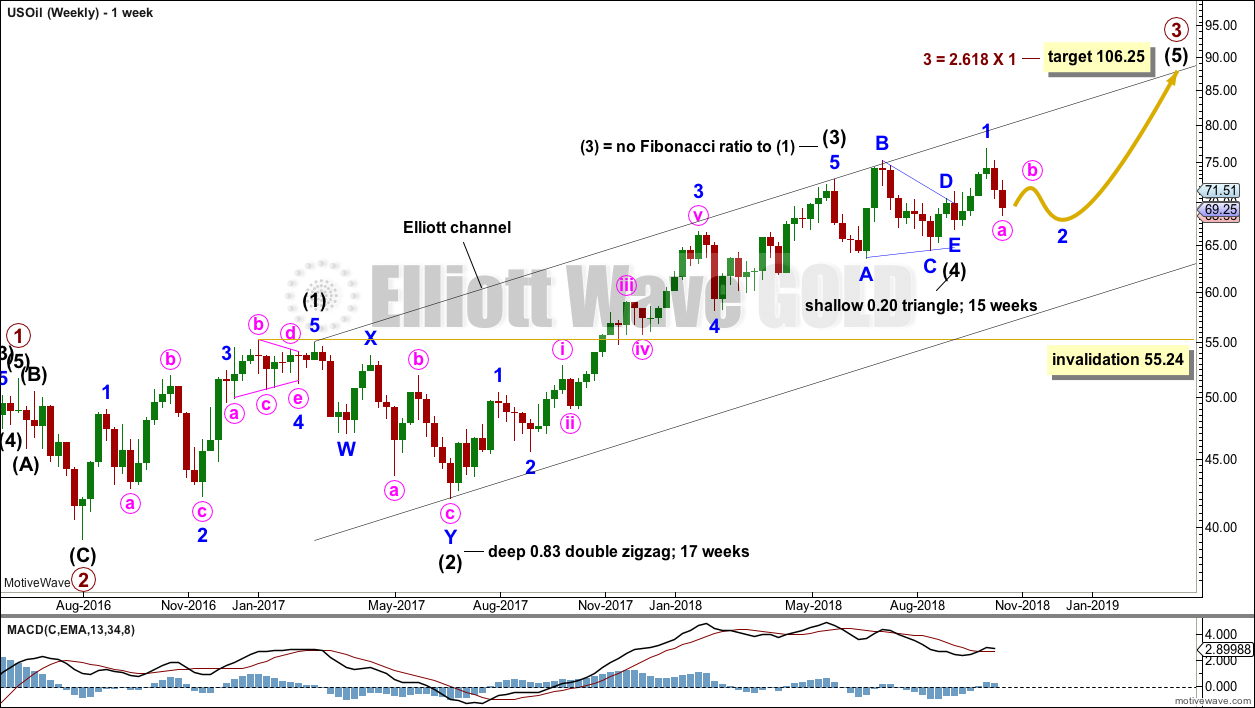
WEEKLY CHART
Click chart to enlarge.
Intermediate wave (3) is now complete. There is no Fibonacci ratio between intermediate waves (1) and (3), and intermediate wave (3) is longer than 1.618 the length of intermediate wave (1).
This wave count fits with classic technical analysis at the monthly and daily chart levels.
Intermediate wave (2) was a deep double zigzag. Given the guideline of alternation, intermediate wave (4) may be expected to most likely be a shallow flat, triangle or combination. It may be about even in duration with intermediate wave (2), or it may be a little longer because triangles and combinations are more time consuming structures.
Intermediate wave (4) may be a complete triangle; this looks most likely. If it continues further, then it may end within another very few weeks as a combination; this now looks less likely.
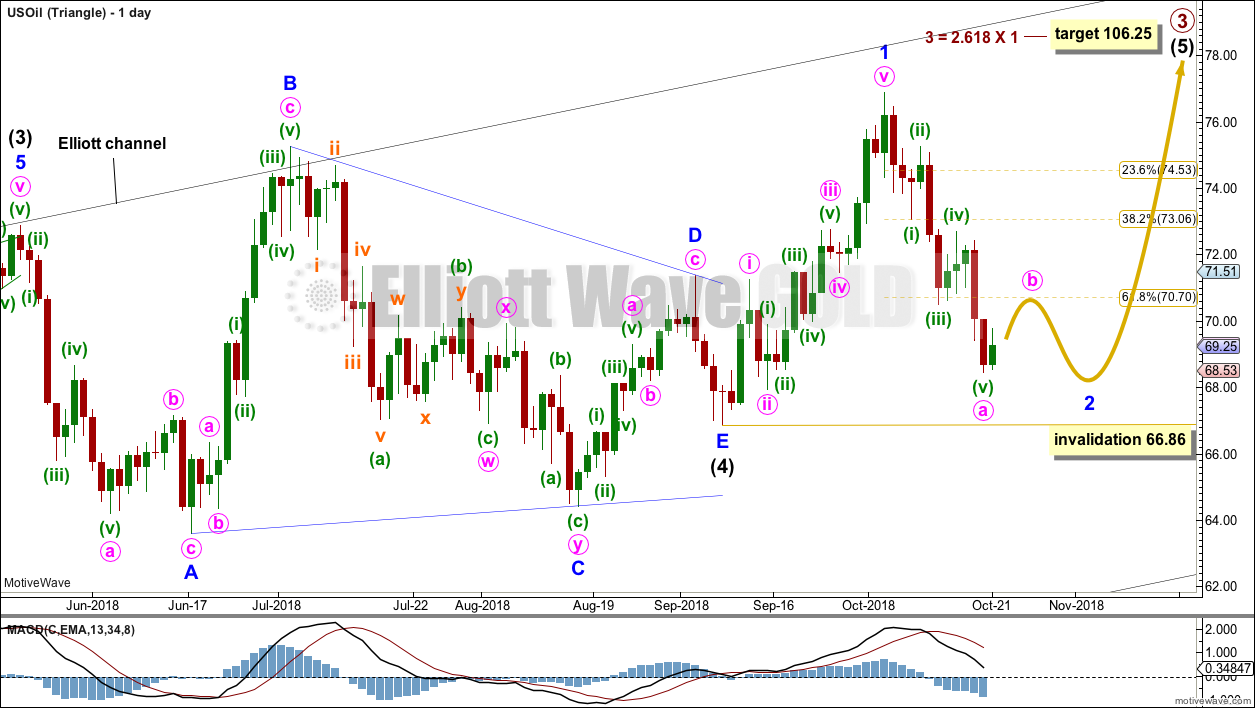
TRIANGLE
Click chart to enlarge.
Intermediate wave (4) may be a complete triangle.
All triangle sub-waves subdivide into single or multiple zigzags, with only one sub-wave a more complicated multiple. The final wave of minor wave E ends reasonably short of the A-C trend line.
This triangle meets all Elliott wave rules, but it does come to a rather quick conclusion. This is possible, but it does not have a typical look. The probability is now slightly reduced.
If intermediate wave (4) is complete, then intermediate wave (5) has begun. Within intermediate wave (5), a pullback for minor wave 2 may now continue that may not move beyond the start of minor wave 1 below 66.86.
Minor wave 2 is now deeper than the 0.618 Fibonacci ratio and the structure looks incomplete. It is common for Oil for the first second wave in a new impulse to be very deep indeed, so the depth of minor wave 2 here follows a common pattern for this market.
Within minor wave 2, a small bounce for minute wave b may begin next week. Minute wave b should exhibit reasonable weakness; it should not have support from volume, and it may exhibit bearish divergence at its end. Thereafter, minute wave c should move below the end of minute wave a to avoid a truncation. Minor wave 2 may then have a clear three wave look on the daily chart.
Look for a candlestick reversal pattern to signal the end of minor wave 2. This does not always occur, but it offers confidence in a trend change when it does occur.
It is possible that minor wave 2 could be over at this week’s low. It would now have lasted a reasonable duration and have a normal depth. Minor wave 2 could be relabelled as a double zigzag and the structure would look complete.
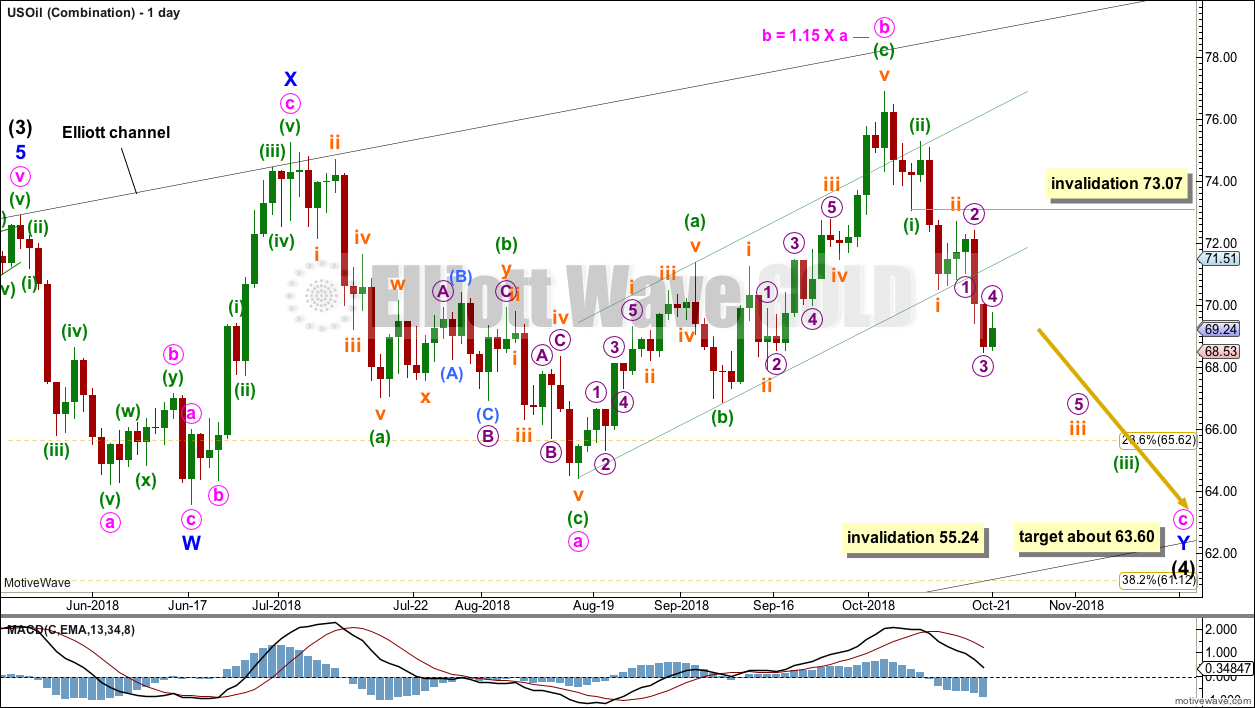
COMBINATION
Click chart to enlarge.
Intermediate wave (4) may be unfolding as a double combination.
The first structure in a double combination may be a complete zigzag labelled minor wave W. There is a little disproportion within minute wave a between the corrections of minuette waves (ii) and (iv), but this is slight enough to be acceptable for this market.
The double is joined by a complete three in the opposite direction, a zigzag labelled minor wave X. X waves within combinations have no minimum nor maximum allowable length, and may make new price extremes beyond the start of wave W as this one does. The only guideline in terms of depth for X waves is that they are normally very deep.
The second structure in a double combination would most likely be a flat correction as the two most common structures in a double combination are one zigzag and one flat.
Within a possible flat correction for minor wave Y, minute wave a looks like a completed three. Minute wave b has now met the minimum 0.9 length of minute wave a, and it has moved beyond the start of minute wave a, indicating an expanded flat. Minute wave b is within the common range of 1 to 1.38 times the length of minute wave a. Expanded flats are very common structures.
Minute wave c would be extremely likely to end at least slightly below the end of minute wave a at 64.43 to avoid a truncation and a very rare running flat.
The purpose of the second structure in a double combination is to take up time and move price sideways. To achieve this purpose minor wave Y would be most likely to end about the same level as minor wave W about 63.60.
Minute wave c must subdivide as a five wave structure, most likely an impulse. Within the impulse, so far minuette waves (i) and (ii) may be complete. Minuette wave (iii) may now be underway and may have just passed its middle strongest portion this week. Minuette wave (iv) may not move into minuette wave (i) price territory above 73.07.
If price moves below 66.86 by any amount at any time frame, then this would be the only remaining daily wave count.
TECHNICAL ANALYSIS
MONTHLY CHART
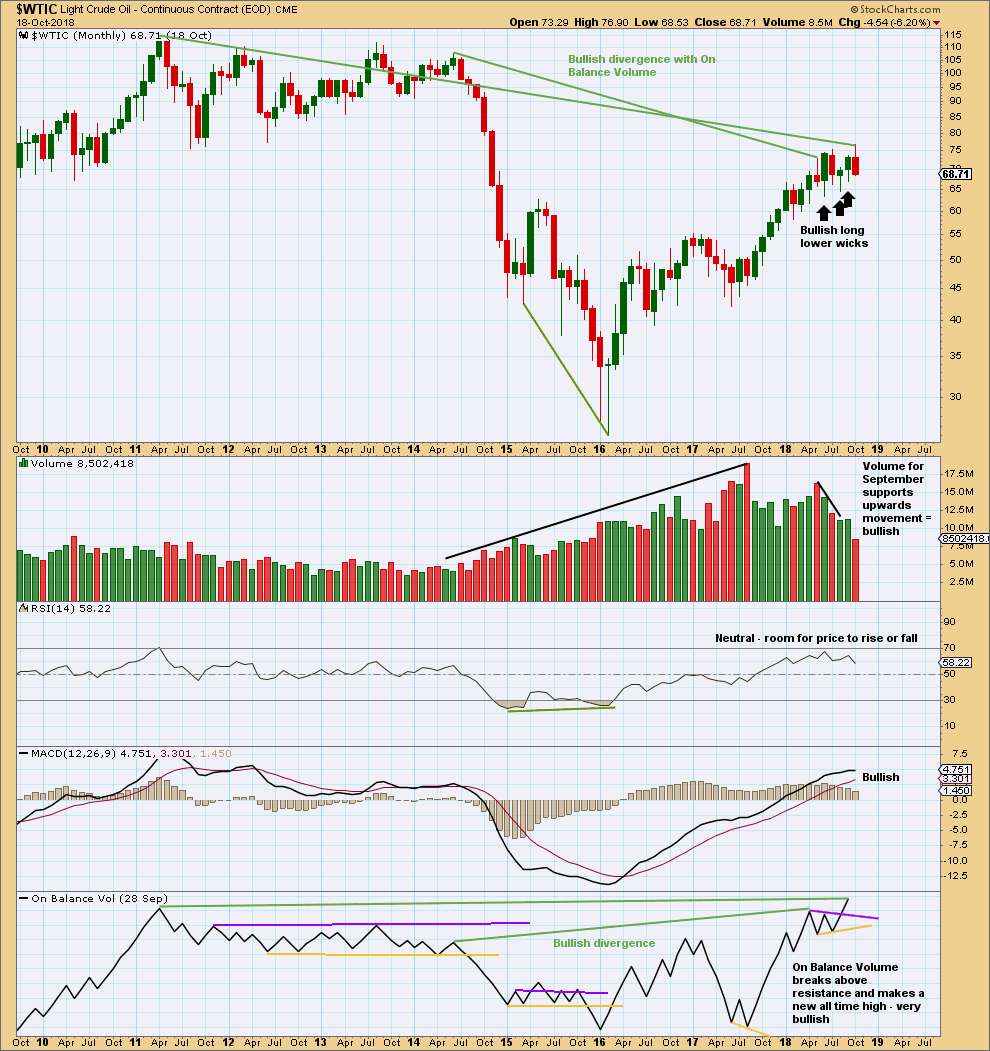
Click chart to enlarge. Chart courtesy of StockCharts.com.
The larger trend remains upwards.
The last three months have seen price move sideways. Three long and lower monthly wicks are bullish. Now September shows support from volume for upwards movement; the short term volume profile is now bullish.
On Balance Volume gives a bullish signal, breaking above resistance. On Balance Volume has also made a new high above the prior high of May 2011. As On Balance Volume should be read as a leading indicator, price may follow through with a new high above May 2011’s high.
WEEKLY CHART
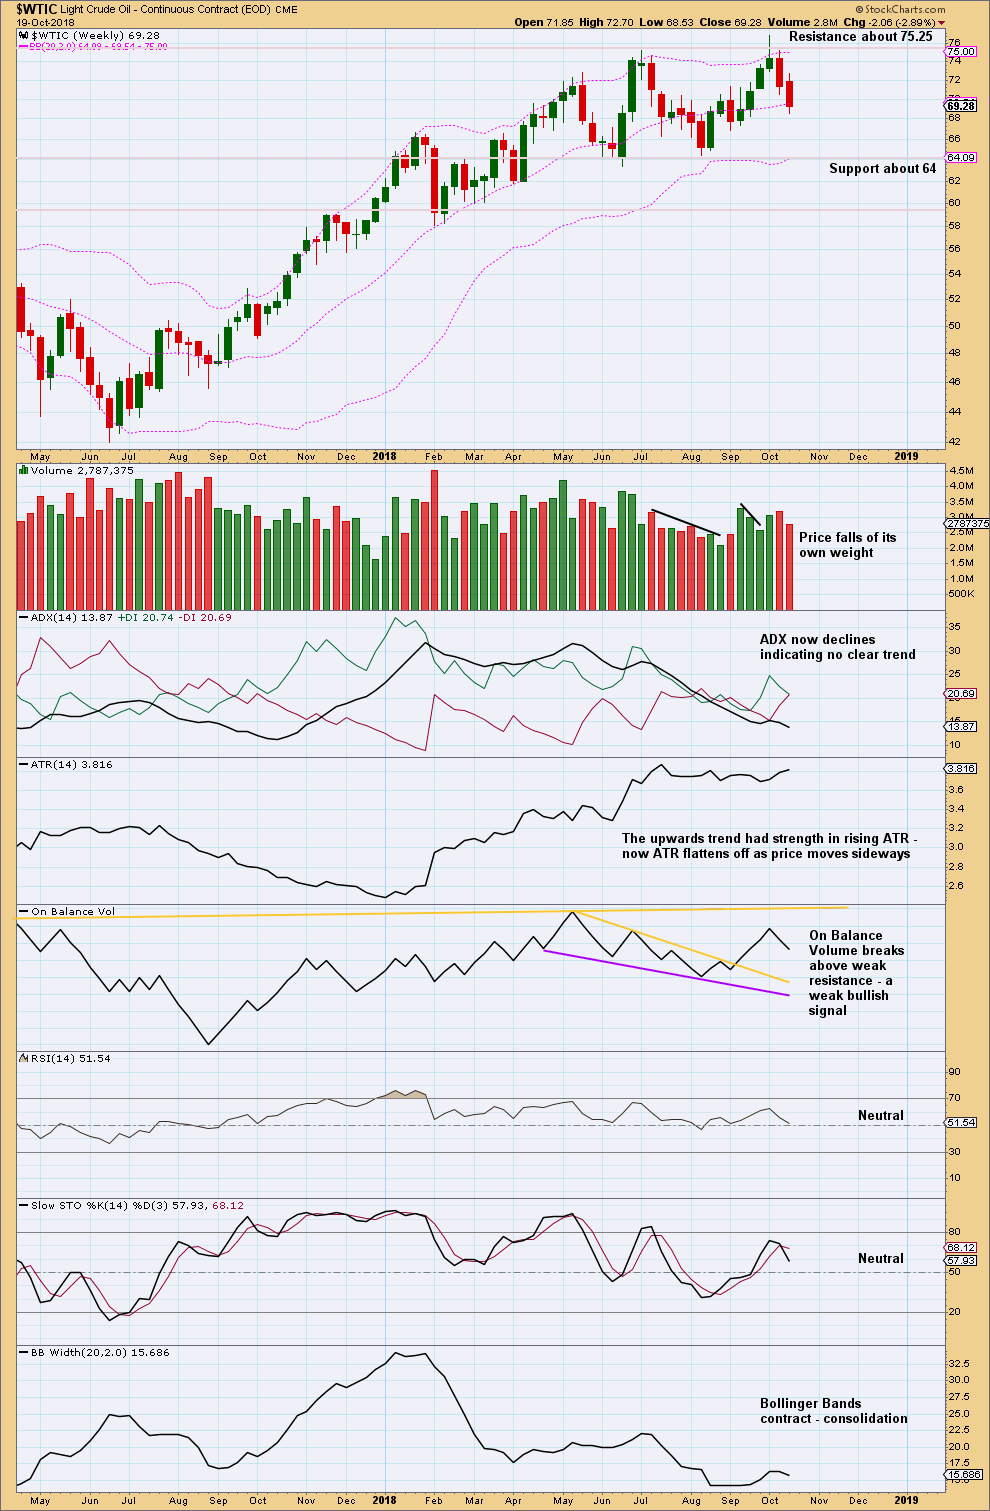
Click chart to enlarge. Chart courtesy of StockCharts.com.
It is upwards weeks during the consolidation that have strongest support from volume. This looks like a continuation pattern. The breakout would most likely be upwards.
The short term volume profile remains slightly bullish. There is room for price to fall further. Support below remains at about 64.
DAILY CHART
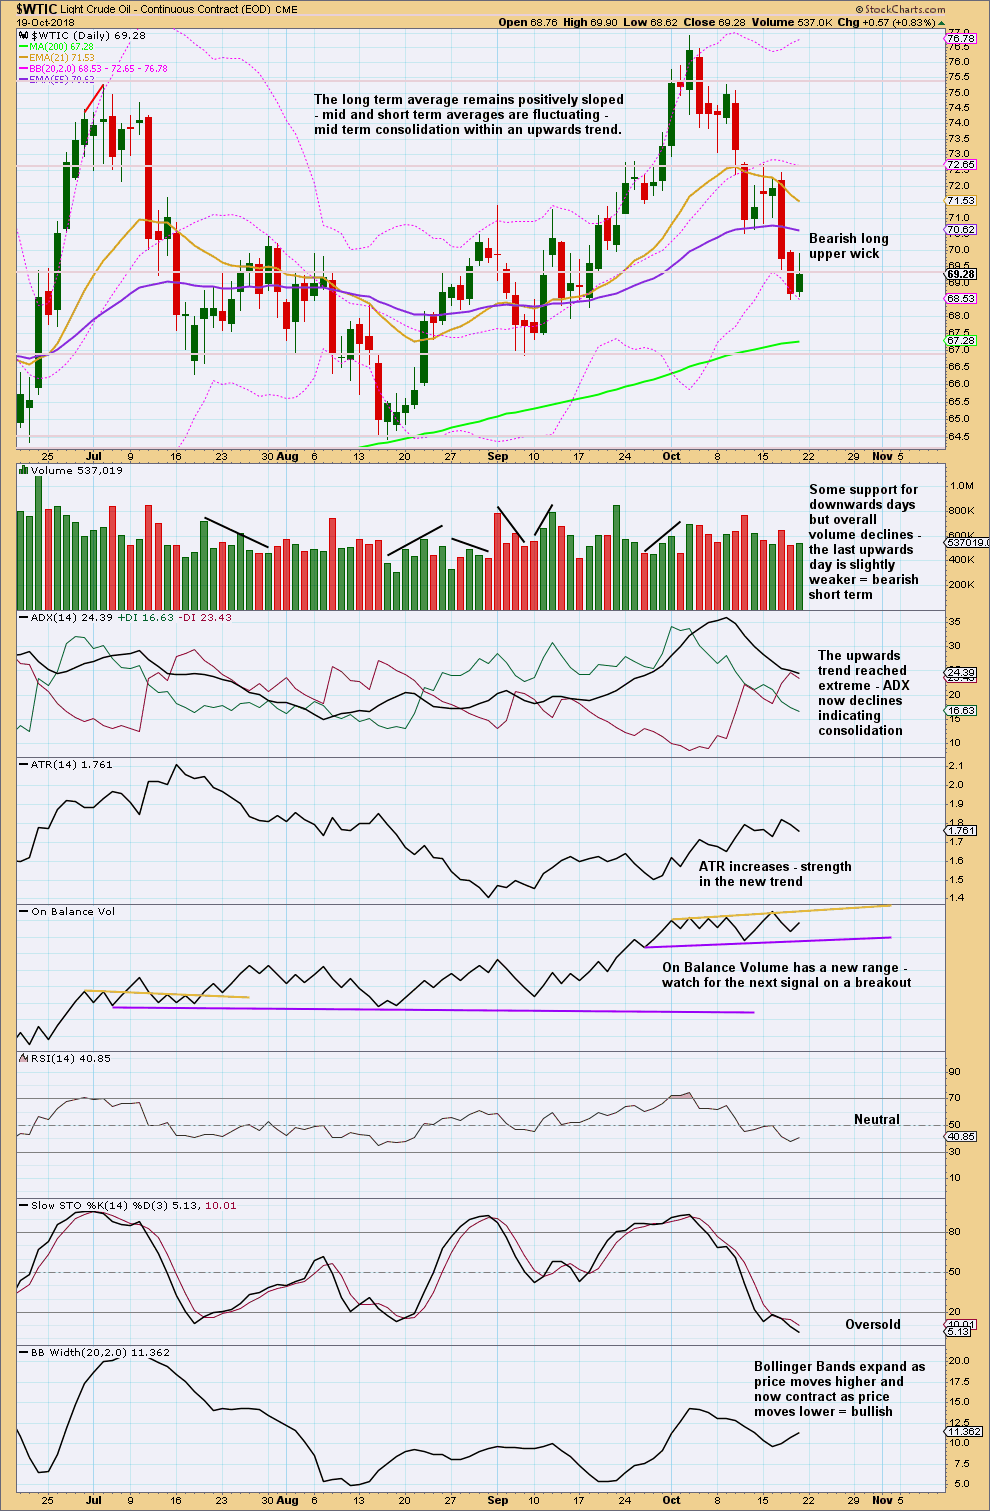
Click chart to enlarge. Chart courtesy of StockCharts.com.
Support below may be found at the 200 day moving average. The short term volume profile remains slightly bearish. Upwards movement for Friday exhibits some weakness; it looks most likely that Monday may see price move lower.
Downwards movement may now be limited: Stochastics is oversold and price is close to support. Look for this pullback to end very soon.
Published @ 04:35 p.m. EST on 20th October, 2018.
—
Careful risk management protects your trading account(s).
Follow my two Golden Rules:
1. Always trade with stops.
2. Risk only 1-5% of equity on any one trade.
Updated weekly chart for Oil:
The triangle is invalidated. The combination is now the only valid structural option I can see for US Oil.
I am now expecting more downwards movement to at least slightly below 64.43, most likely to end about 63.60.
This should happen this week.
Updated daily chart:
This is the only daily wave count remaining valid.
Use the best fit channel. If price reaches 64.43 or below then look for a subsequent breach of the channel to indicate a trend change and the end of intermediate (4).