
More downwards movement below 66.86 invalidated one of the two remaining daily Elliott wave counts.
At the end of this week, two versions of the remaining Elliott wave count are provided.
Summary: While price remains within the narrow channel on the daily charts, expect a little more downwards movement next week to complete this final downwards swing. The target remains about 63.60; but as soon as price makes a new low below 64.43, then a low could be in.
If price breaks above the narrow channel, then consider the low may be in. Confidence in this view may be had if price makes a new high above 70.51. The target would then be 96.59 to 106.25.
This downwards swing may end sooner rather than later. It may offer a final good entry opportunity to join an upwards trend. The next wave up could be quite strong; it could end with a strong blow off top.
New updates to this analysis are in bold.
MAIN WAVE COUNT
MONTHLY CHART
Click chart to enlarge.
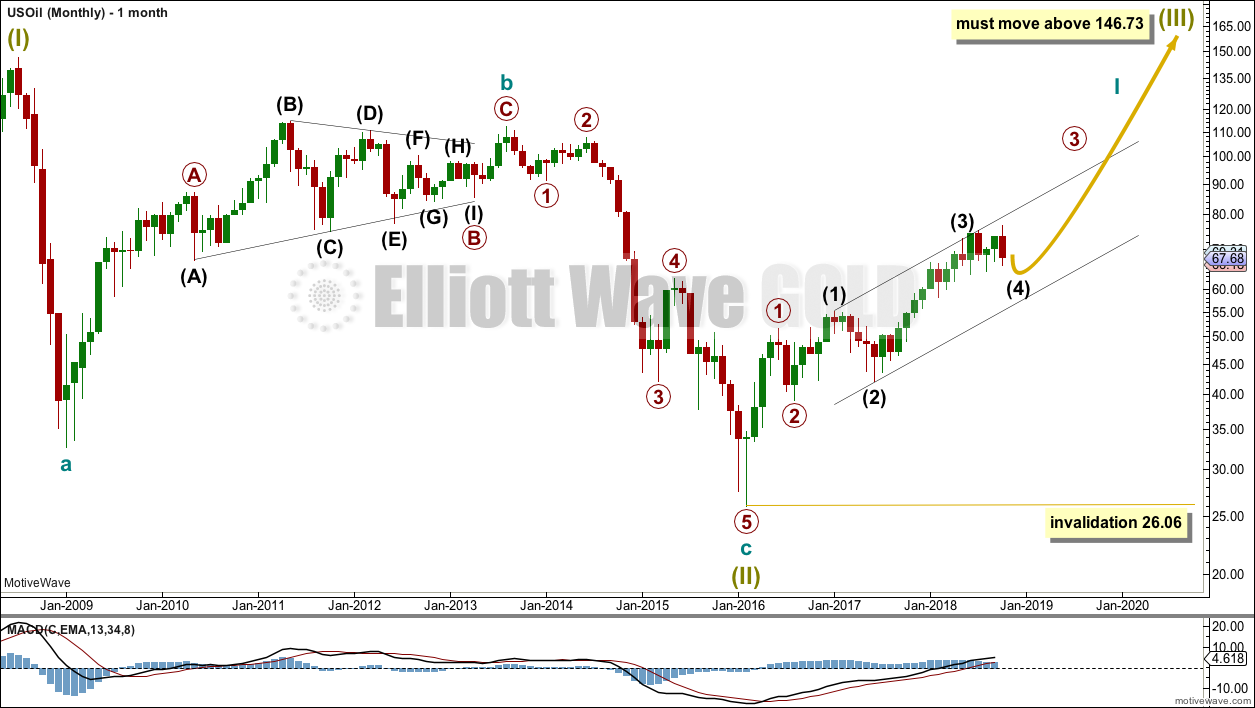
The bear market for US Oil looks to be over and a new bull market looks to be in its early stages. The prior bearish wave count has been invalidated, leaving only this very bullish wave count.
A huge zigzag down to the last low may be complete and is labelled here Super Cycle wave (II).
Cycle wave b must be seen as complete in August 2013 for this wave count to work. It cannot be seen as complete at the prior major swing high in May 2011.
Cycle wave b is seen as a zigzag, and within it primary wave B is seen as a running contracting triangle. These are fairly common structures, although nine wave triangles are uncommon. All subdivisions fit.
Primary wave C moves beyond the end of primary wave A, so it avoids a truncation. But it does not have to move above the price territory of primary wave B to avoid a truncation, which is an important distinction.
If cycle wave b begins there, then cycle wave c may be seen as a complete five wave impulse.
Super Cycle wave (III) must move beyond the end of Super Cycle wave (I). It must move far enough above that point to allow room for a subsequent Super Cycle wave (IV) to unfold and remain above Super Cycle wave (I) price territory.
Cycle wave I may be incomplete. It may be unfolding as an impulse and may have now moved through the middle portion. Commodities have a tendency to exhibit swift strong fifth waves, and this tendency is especially prevalent for third wave impulses. Intermediate wave (5) to end primary wave 3 may be very swift and strong, ending with a blow off top.
When cycle wave I is complete, then cycle wave II may be a deep correction that may not move beyond the start of cycle wave I below 26.06.
Data from FXCM for USOil does not go back to the beginning of Super Cycle wave (I). Without an accurate known length of Super Cycle wave (I) a target cannot be calculated for Super Cycle wave (III) to end using Fibonacci ratios. The target for Super Cycle wave (III) may be calculated when cycle waves I, II, III and IV within it are complete. That cannot be done for many years.
WEEKLY CHART
Click chart to enlarge.
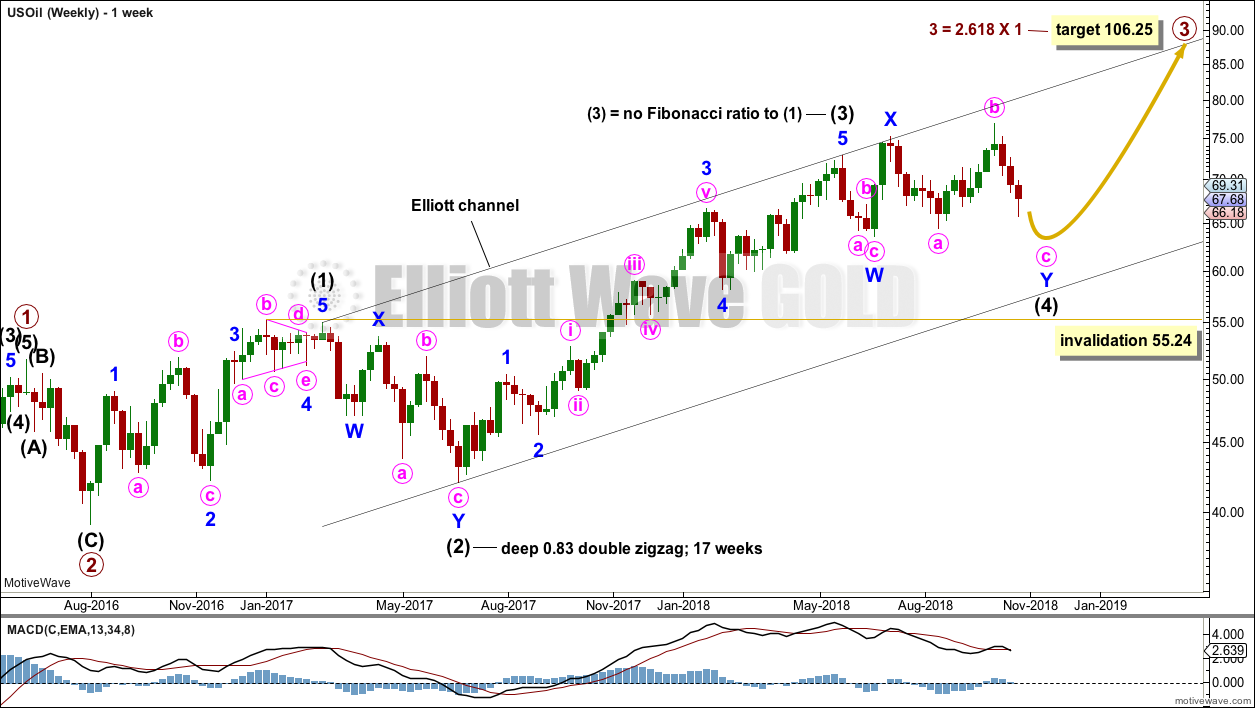
Intermediate wave (3) is now complete. There is no Fibonacci ratio between intermediate waves (1) and (3), and intermediate wave (3) is longer than 1.618 the length of intermediate wave (1).
This wave count fits with classic technical analysis at the monthly and daily chart levels.
Intermediate wave (2) was a deep double zigzag. Given the guideline of alternation, intermediate wave (4) may be expected to most likely be a shallow flat, triangle or combination. It may be about even in duration with intermediate wave (2), or it may be a little longer because triangles and combinations are more time consuming structures.
At this stage, the possibility of a completed triangle for intermediate wave (4) has been invalidated. The only remaining option now is a combination, and the two daily wave counts below both look at two different ways of labelling intermediate wave (4) as a combination.
DAILY CHART
Click chart to enlarge.
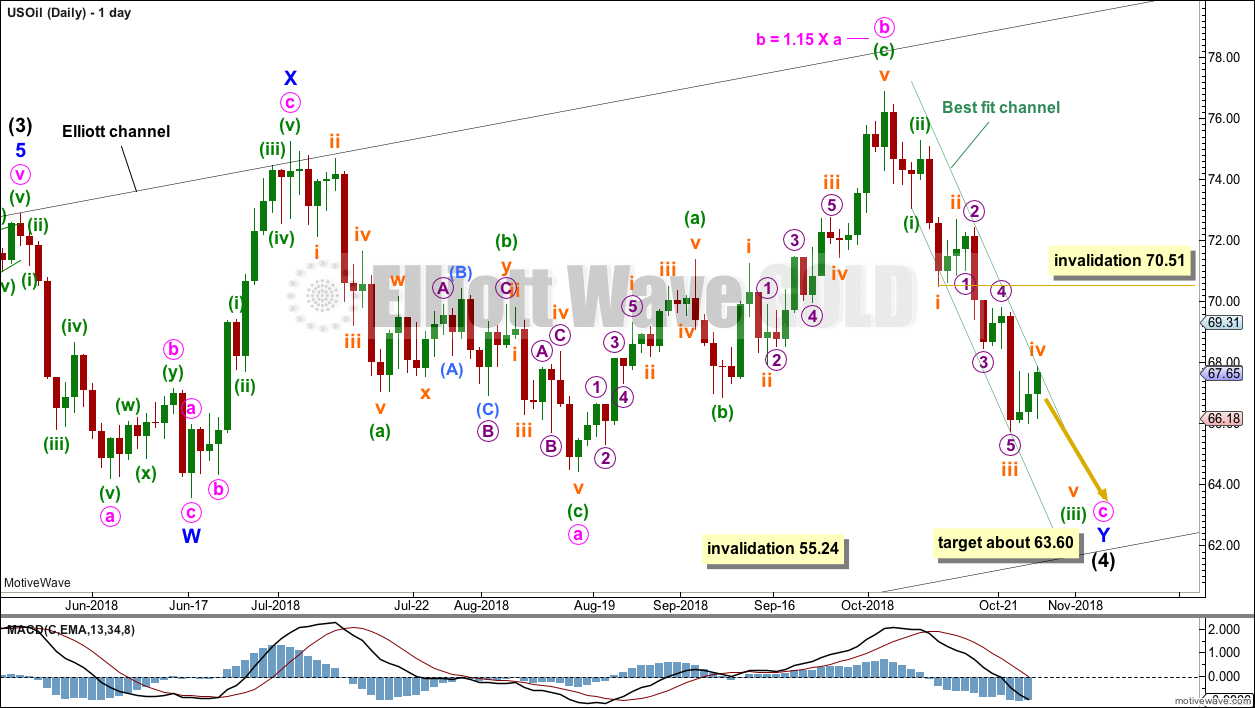
Intermediate wave (4) may be unfolding as a double combination.
The first structure in a double combination may be a complete zigzag labelled minor wave W. There is a little disproportion within minute wave a between the corrections of minuette waves (ii) and (iv), but this is slight enough to be acceptable for this market.
The double is joined by a complete three in the opposite direction, a zigzag labelled minor wave X. X waves within combinations have no minimum nor maximum allowable length, and may make new price extremes beyond the start of wave W as this one does. The only guideline in terms of depth for X waves is that they are normally very deep.
The second structure in a double combination would most likely be a flat correction as the two most common structures in a double combination are one zigzag and one flat.
Within a possible flat correction for minor wave Y, minute wave a looks like a completed three. Minute wave b has now met the minimum 0.9 length of minute wave a, and it has moved beyond the start of minute wave a, indicating an expanded flat. Minute wave b is within the common range of 1 to 1.38 times the length of minute wave a. Expanded flats are very common structures.
Minute wave c would be extremely likely to end at least slightly below the end of minute wave a at 64.43 to avoid a truncation and a very rare running flat.
The purpose of the second structure in a double combination is to take up time and move price sideways. To achieve this purpose minor wave Y would be most likely to end about the same level as minor wave W about 63.60.
Minute wave c must subdivide as a five wave structure, most likely an impulse. Within the impulse, so far minuette waves (i) and (ii) may be complete. Minuette wave (iii) may still be incomplete and may only subdivide as an impulse. Within the impulse, subminuette wave iv may not move into subminuette wave i price territory above 70.51.
Price remains within the narrow best fit channel. Volume analysis still supports more downwards movement. It should be assumed that while price remains within this channel the current downwards trend remains intact.
ALTERNATE DAILY CHART
Click chart to enlarge.
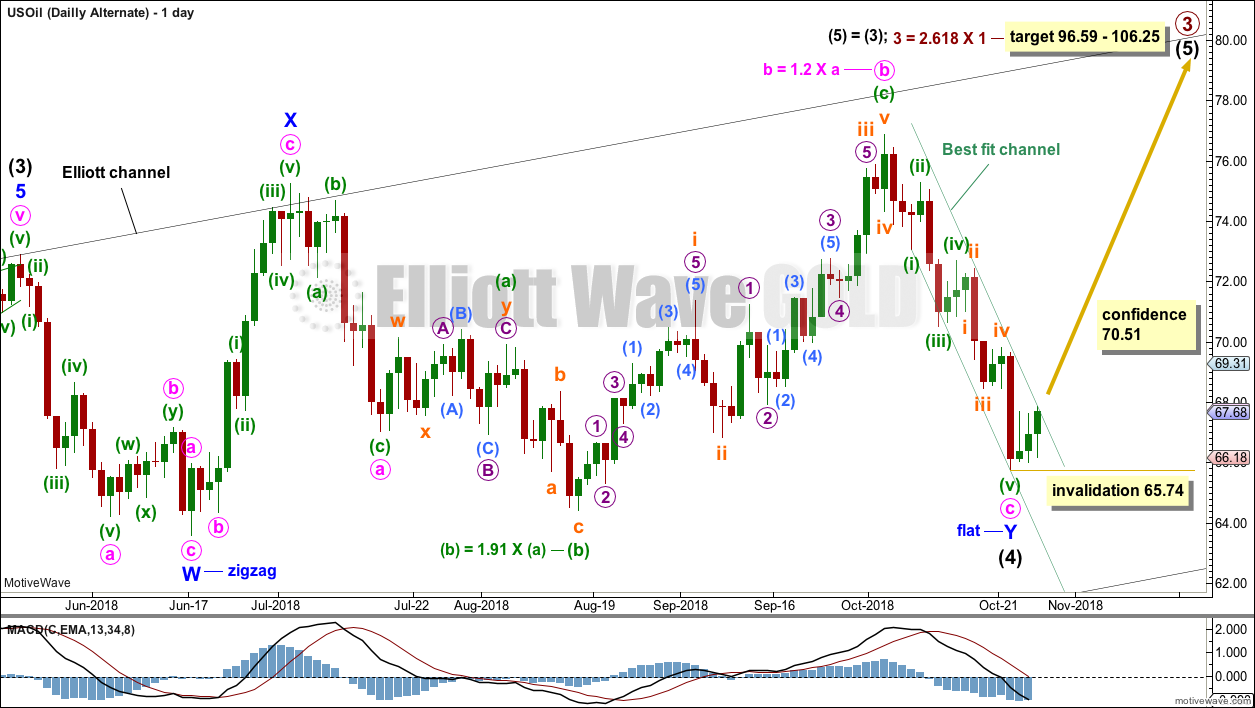
It is possible to see a double combination complete at this week’s low.
This wave count is identical to the main daily chart up to the low labelled minor wave W.
Thereafter, a flat correction for minor wave Y is labelled slightly differently.
Within minor wave Y, minute wave a may have been over earlier. Minute wave b is now labelled as an expanded flat correction. This does not have quite as good a fit nor look as the main wave count.
Within the expanded flat, minuette wave (b) at 1.91 times the length of minuette wave (a) is reasonably longer than the common range of up to 1.38. This reduces the probability of this wave count.
Minuette wave (c) for this wave count must be seen as a five wave structure. While this will fit, it does not have as good a look as the main wave count seeing this upwards wave as a three wave zigzag.
If minor wave Y is complete, then it may have ended still reasonably close to minor wave W.
Within the new upwards wave of intermediate wave (5), no second wave correction may move beyond the start of its first wave below 65.74.
TECHNICAL ANALYSIS
MONTHLY CHART
Click chart to enlarge. Chart courtesy of StockCharts.com.
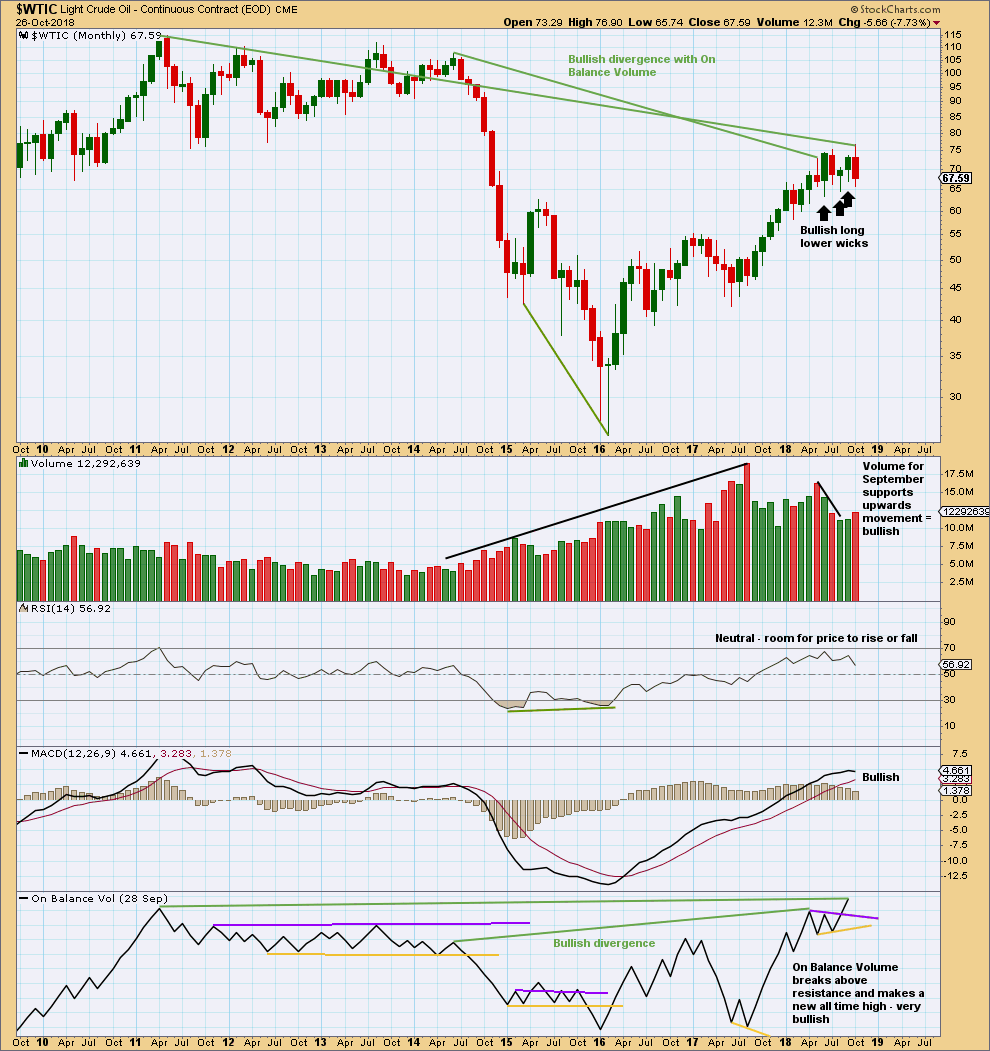
The larger trend remains upwards.
The last three months have seen price move sideways. Three long and lower monthly wicks are bullish. Now September shows support from volume for upwards movement; the short term volume profile is now bullish.
On Balance Volume gives a bullish signal, breaking above resistance. On Balance Volume has also made a new high above the prior high of May 2011. As On Balance Volume should be read as a leading indicator, price may follow through with a new high above May 2011’s high.
WEEKLY CHART
Click chart to enlarge. Chart courtesy of StockCharts.com.
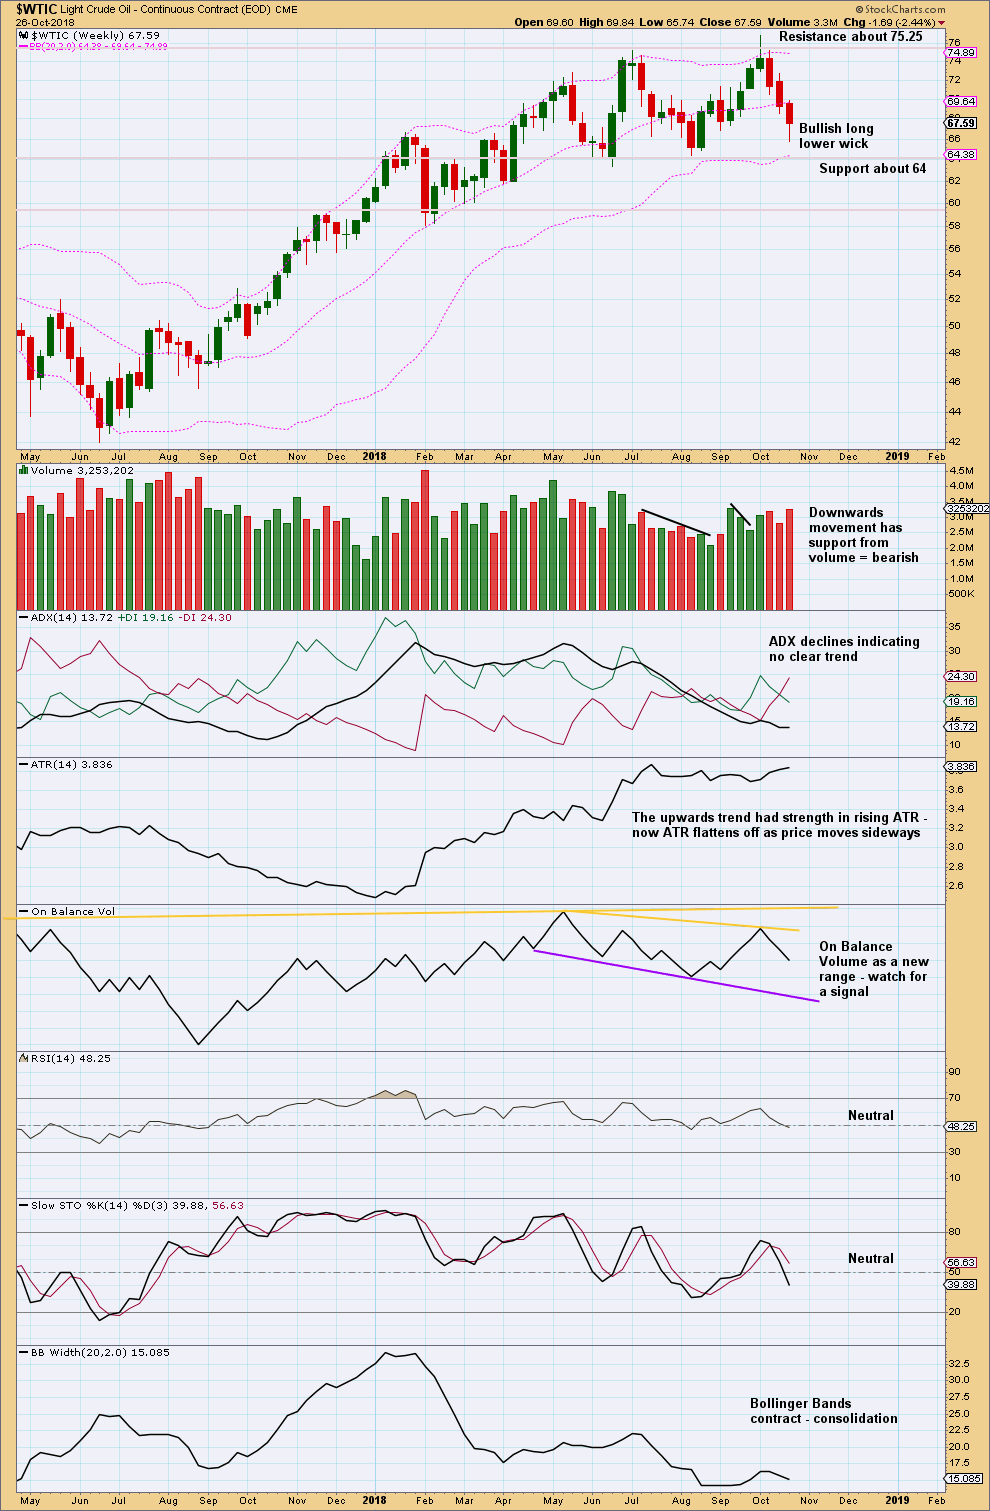
It is upwards weeks during the consolidation that have strongest support from volume. This looks like a continuation pattern. The breakout would most likely be upwards.
A downwards swing within the consolidation is not yet at support, but it is close.
It is noted that for the current bull market for Oil, which began in February 2016, pullbacks along the way up have often ended on downwards weeks which had support from volume. Support this week for downwards movement may not necessarily indicate more downwards movement next week; it is possible that a low may be in this week.
The long lower wick this week is bullish. There is at this stage no candlestick reversal pattern to indicate an end to this pullback.
DAILY CHART
Click chart to enlarge. Chart courtesy of StockCharts.com.
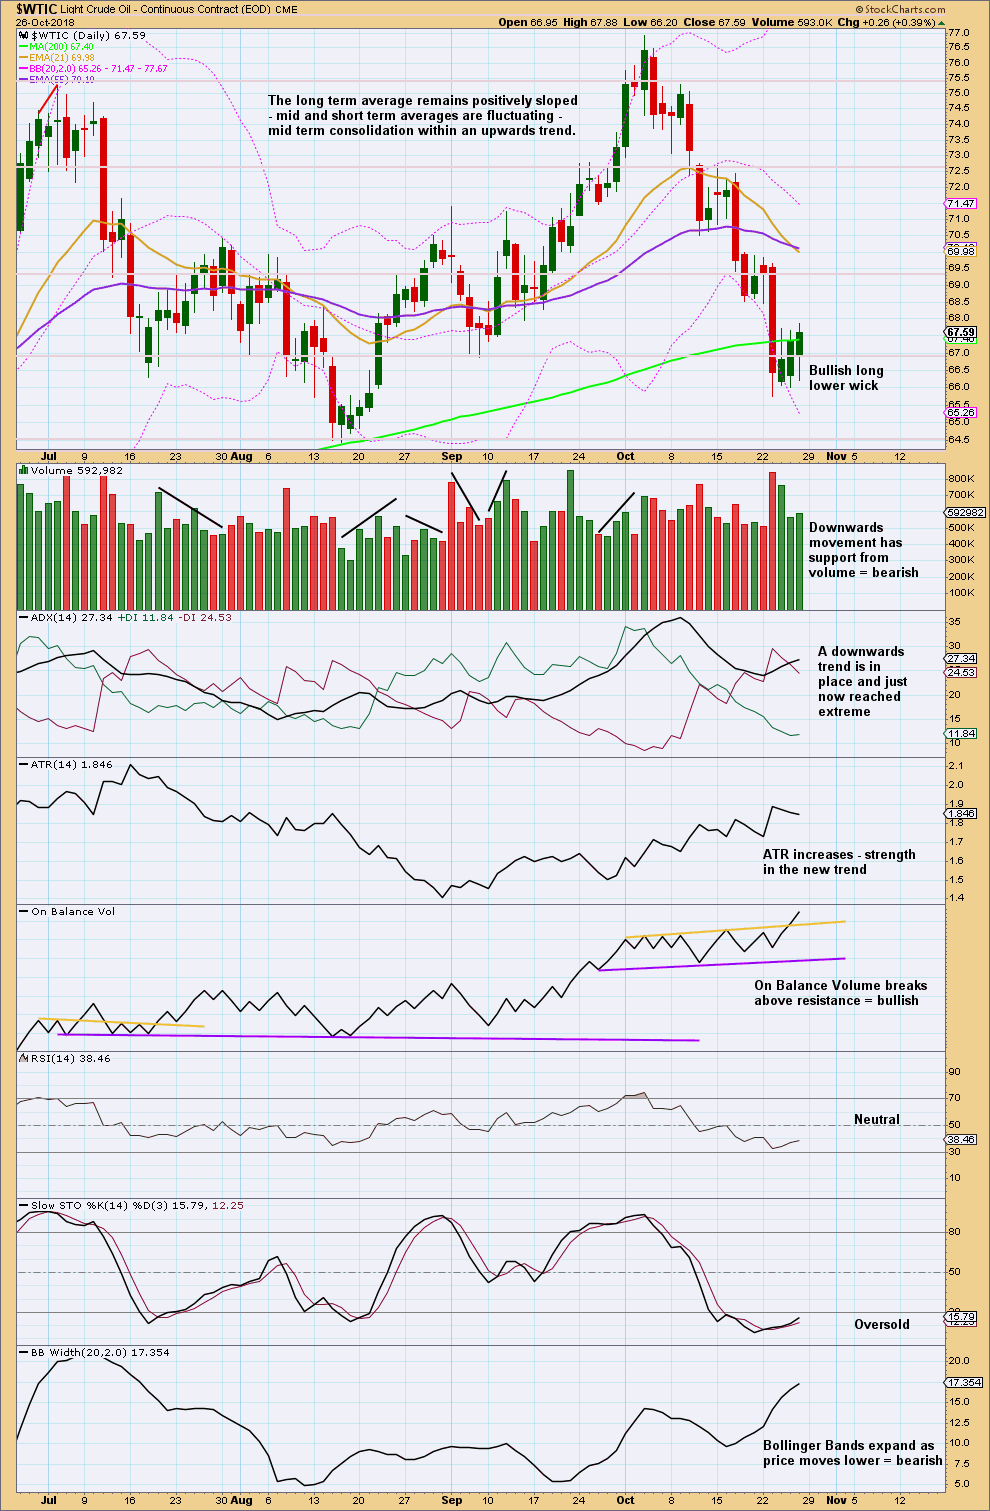
Support about the 200 day moving average has been breached. The last three sessions may be a short back test of resistance.
The short term volume profile remains bearish. Look for support close by now about 64.40.
A reasonable bullish signal this week from On Balance Volume supports the idea that price may break out of this consolidation upwards.
This downwards swing is either over here or more likely over very soon. Look for a candlestick reversal pattern at the low.
Published @ 11:37 p.m. EST.
—
Careful risk management protects your trading account(s).
Follow my two Golden Rules:
1. Always trade with stops.
2. Risk only 1-5% of equity on any one trade.
Hi Lara,
You told me, when you have a chance you would do an analysis of “xop.”. No pressure just wanted to give you a friendly reminder. I hope you had happy travels! Thank you for your excellent work!
I am so sorry Andrew, and thank you for reminding me.
I really do need reminding sometimes.
It is right on the top of my list. And I promise, it will be done in the next very few days.