
The Elliott wave count has been invalidated. Two new Elliott wave counts are considered.
Summary: Oil is in a downwards trend. A new low now below 51.67 would be another very strong bearish signal. If that happens, then the probability that Oil may continue to move reasonably below 26.06 would increase.
Classic analysis still favours a bearish Oil wave count.
New updates to this analysis are in bold.
MAIN ELLIOTT WAVE COUNT
MONTHLY CHART
Click chart to enlarge.
Classic technical analysis favours a bearish wave count for Oil at this time, and so far this is the only bearish Elliott wave count that I can see. That does not mean it is the only bearish Elliott wave count possible and if I conceive of another it will be published.
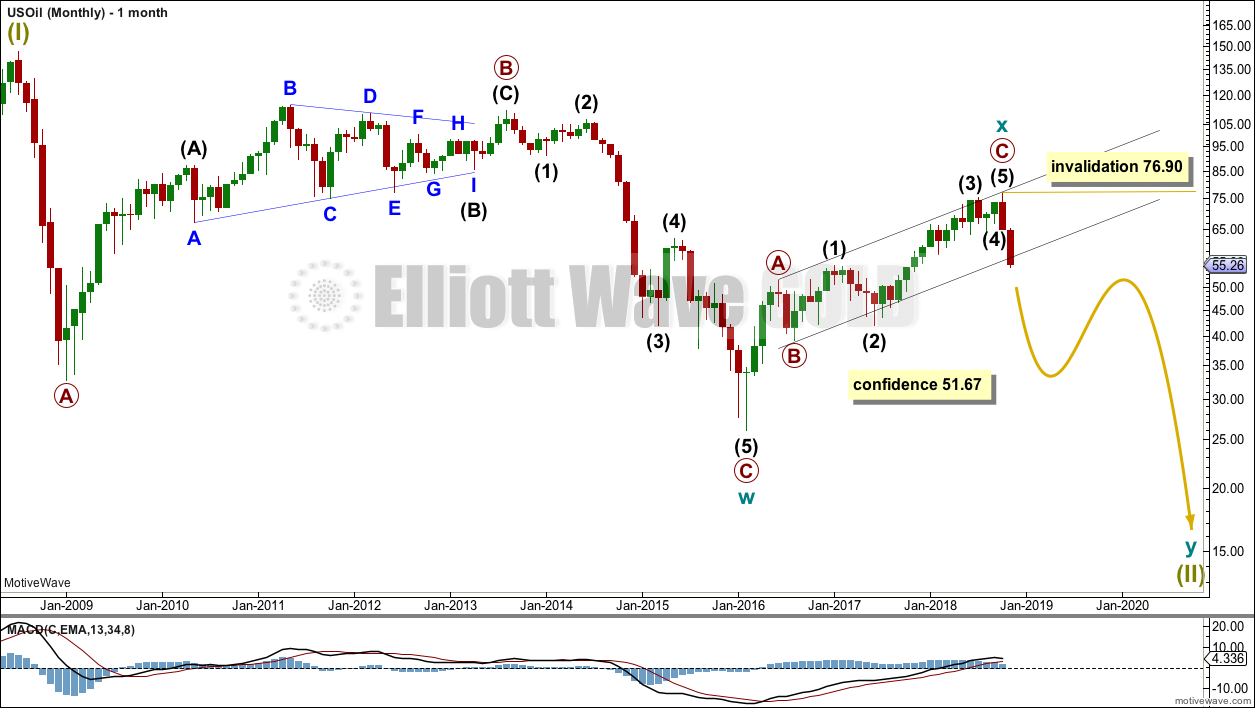
The large fall in price from the high in June 2008 to February 2016 is still seen as a complete three wave structure, but the degree of labelling is moved down one degree. This large zigzag may have been only the first zigzag in a deeper double zigzag.
The first zigzag down is labelled cycle wave w. The double is joined by a now complete three in the opposite direction, a zigzag labelled cycle wave x.
The purpose of a second zigzag in a double is to deepen the correction when the first zigzag does not move price deep enough. Cycle wave y would be expected to move reasonably below the end of cycle wave w to deepen the correction. Were cycle wave y to reach equality with cycle wave w that takes Oil into negative price territory, which makes no sense. Cycle wave y would reach 0.618 the length of cycle wave w at $2.33.
A better target calculation would be using the Fibonacci ratios between primary waves A and C within cycle wave y. This cannot be done until both primary waves A and B are complete.
Within cycle wave y, no second wave correction nor B wave may move beyond its start above 76.90.
WEEKLY CHART
Click chart to enlarge.
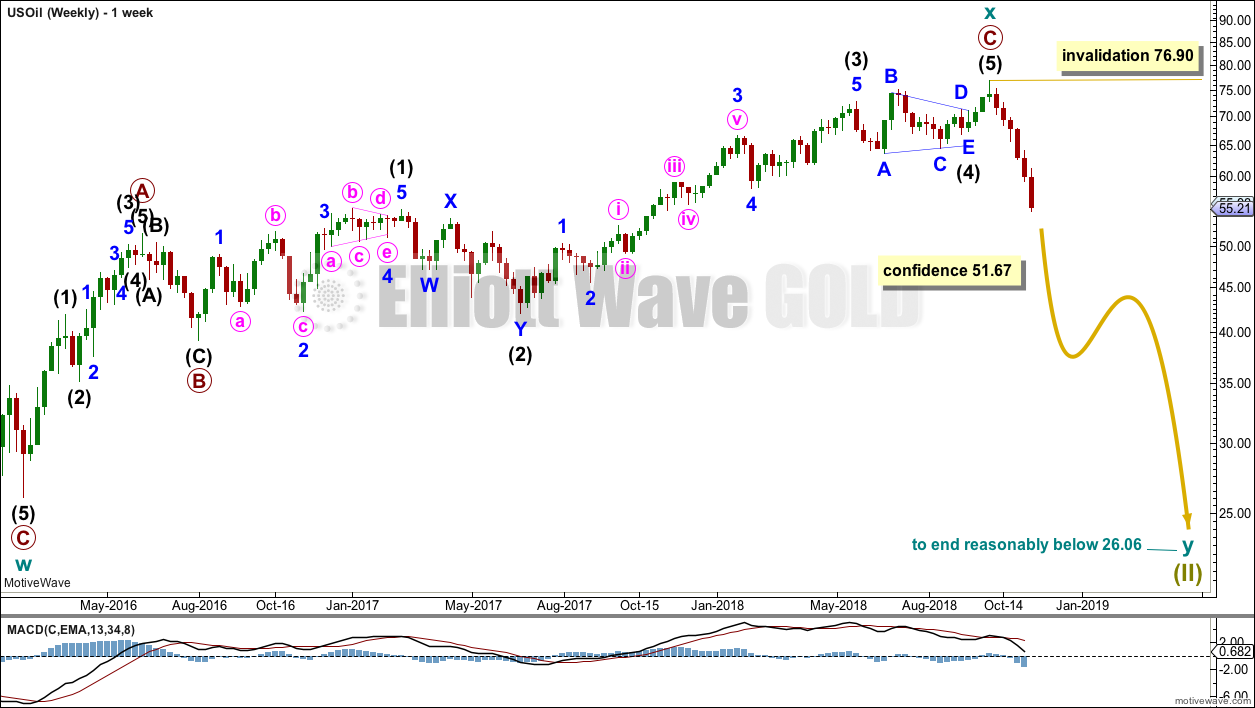
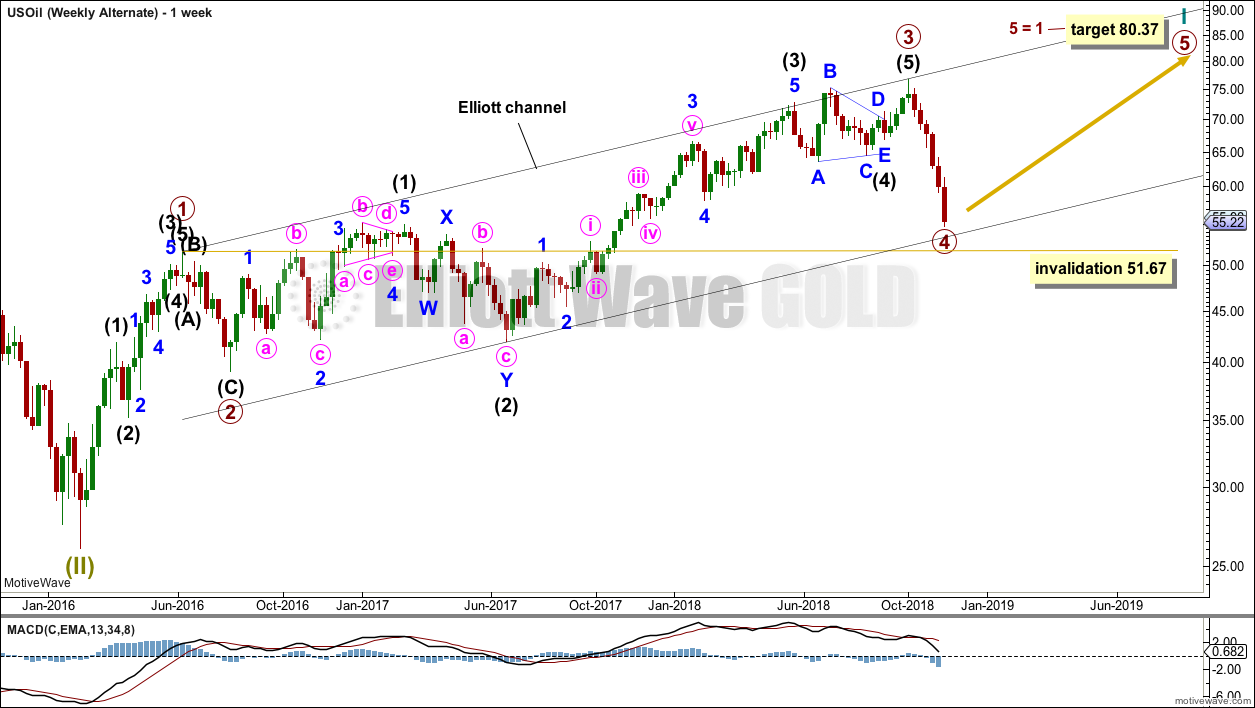
Cycle wave x is seen as a complete zigzag. Within the zigzag, primary wave C is a five wave impulse and within it intermediate wave 4 is a triangle. This part of the wave count has been published before but was discarded based upon a judgement that it looked unlikely. Price is now proving that it should be seriously considered.
A new low below 51.67 would add confidence in this bearish wave count. At that stage, the bullish alternate below would be invalidated.
DAILY CHART
Click chart to enlarge.
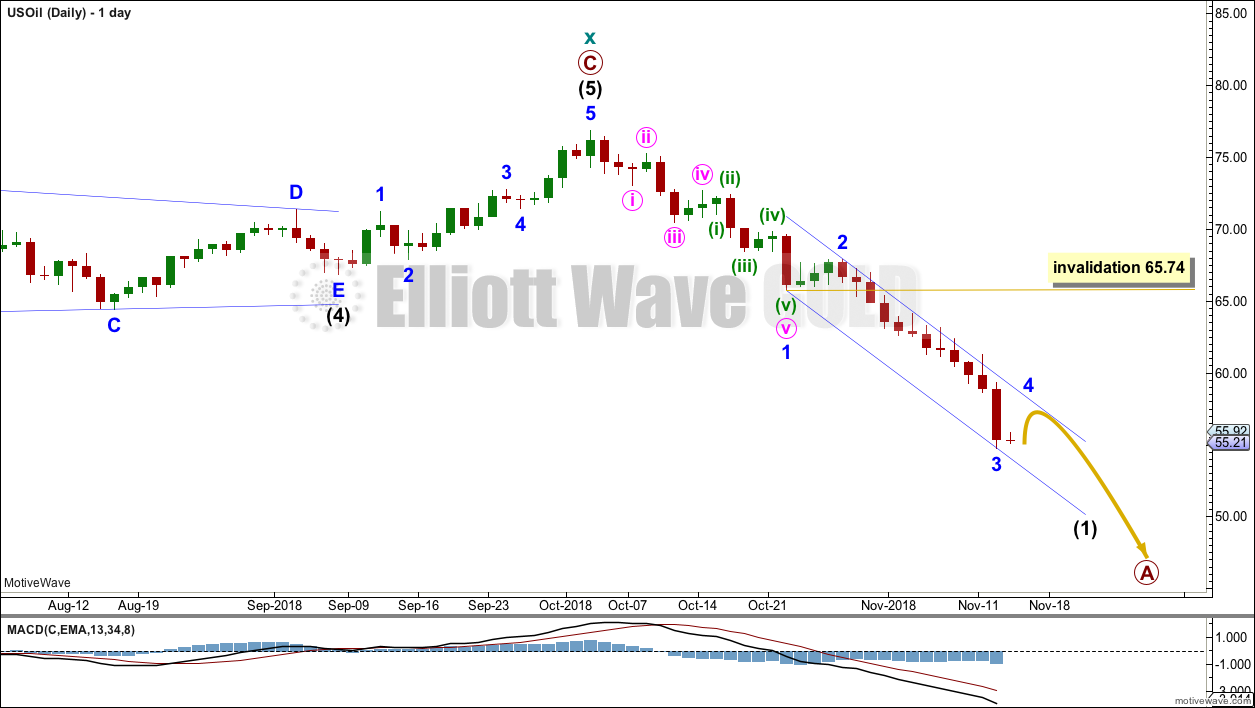
Attention now turns to the structure of downwards movement. An impulse is unfolding lower.
The selling climax today looks like a fairly typical end of a third wave for Oil. Selling climaxes (despite their name) do not tend to come right at the end of a movement for Oil but instead tend to signal the end of a third wave.
Minor wave 3 is longer than minor wave 1 and does not exhibit a Fibonacci ratio to minor wave 1.
Minor wave 4 may remain contained within the blue Elliott channel. Minor wave 4 may not move into minor wave 1 price territory above 65.74.
If price moves above 65.74 prior to making new lows, then this wave count would be changed to see intermediate wave (1) complete. The invalidation point would then move up to 76.90. Intermediate wave (2) may not move beyond the start of intermediate wave (1).
ALTERNATE ELLIOTT WAVE COUNT
MONTHLY CHART
Click chart to enlarge.
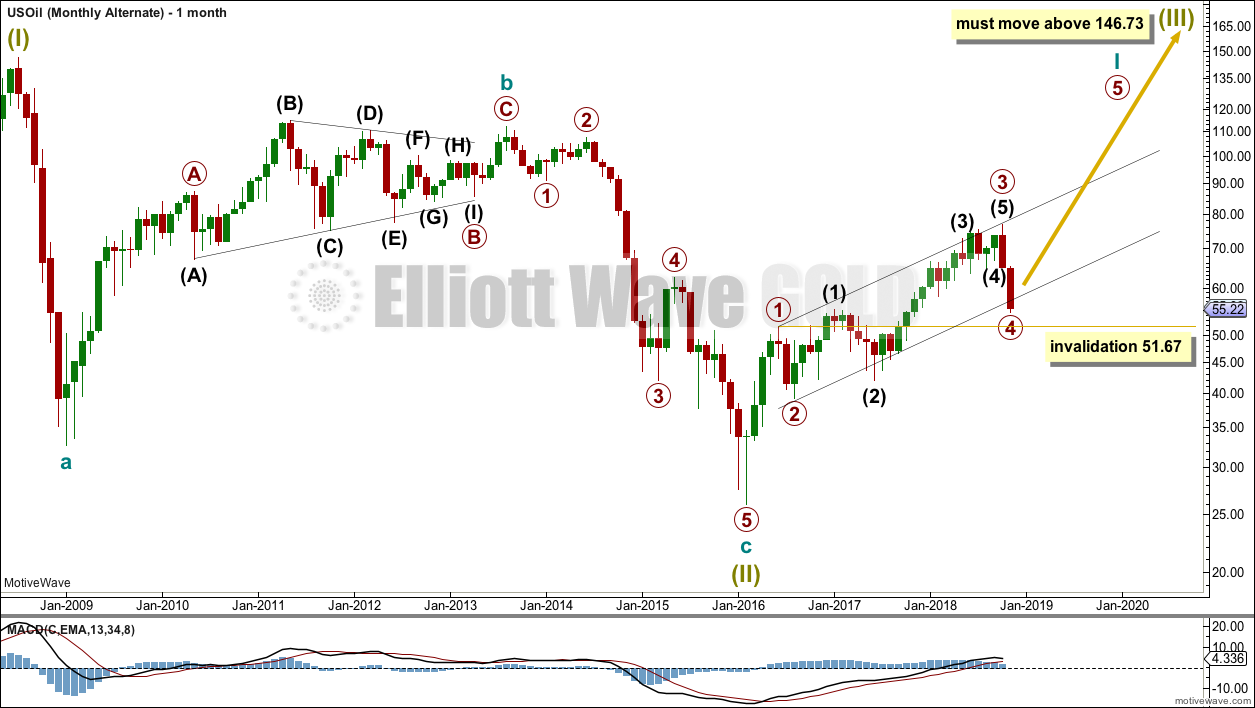
All the subdivisions for both wave counts are the same, but by changing the degree of labelling a very different wave count is seen.
If the degree of labelling for the large zigzag down to the last low is moved back up one degree, it may have been the end of a correction labelled Super Cycle wave (II). Super Cycle wave (III) may still have just begun.
Within Super Cycle wave (III), cycle wave I would still be an incomplete impulse.
Within cycle wave I, primary waves 1 through to 3 may be complete. The current strong downwards movement may be primary wave 4. Primary wave 4 may not move into primary wave 1 price territory below 51.67.
WEEKLY CHART
Click chart to enlarge.
This wave count sees the subdivisions of upwards movement from the low in February 2016 in the same way. A-B-C of a zigzag subdivides 5-3-5, exactly the same as 1-2-3 of an impulse.
Primary wave 3 may have been complete at the last high. Primary wave 4 may be unfolding as a zigzag. Zigzags can be relatively quick structures. This is possible.
However, primary wave 2 was a zigzag. There would be no alternation in structure between primary waves 2 and 4. This reduces the probability of this wave count.
DAILY CHART
Click chart to enlarge.
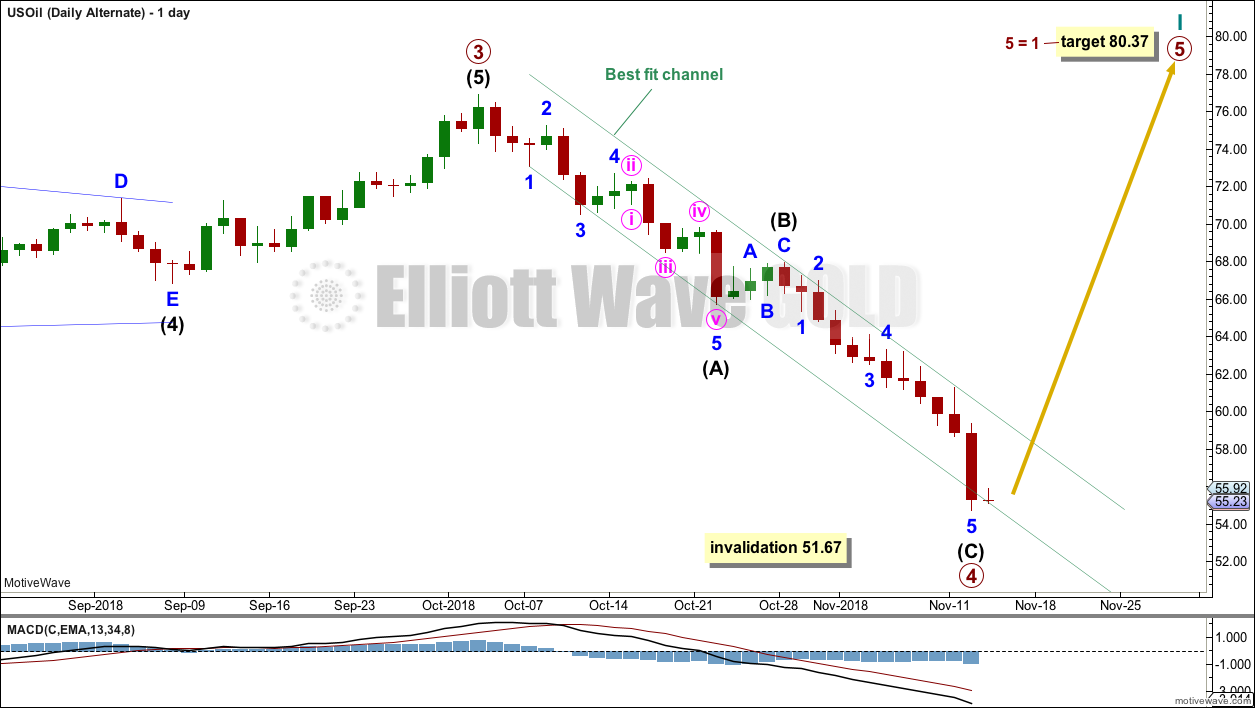
If this downwards movement in price is primary wave 4, then it should be over here or very soon. It is possible to see a zigzag complete at today’s low.
TECHNICAL ANALYSIS
MONTHLY CHART
Click chart to enlarge. Chart courtesy of StockCharts.com.
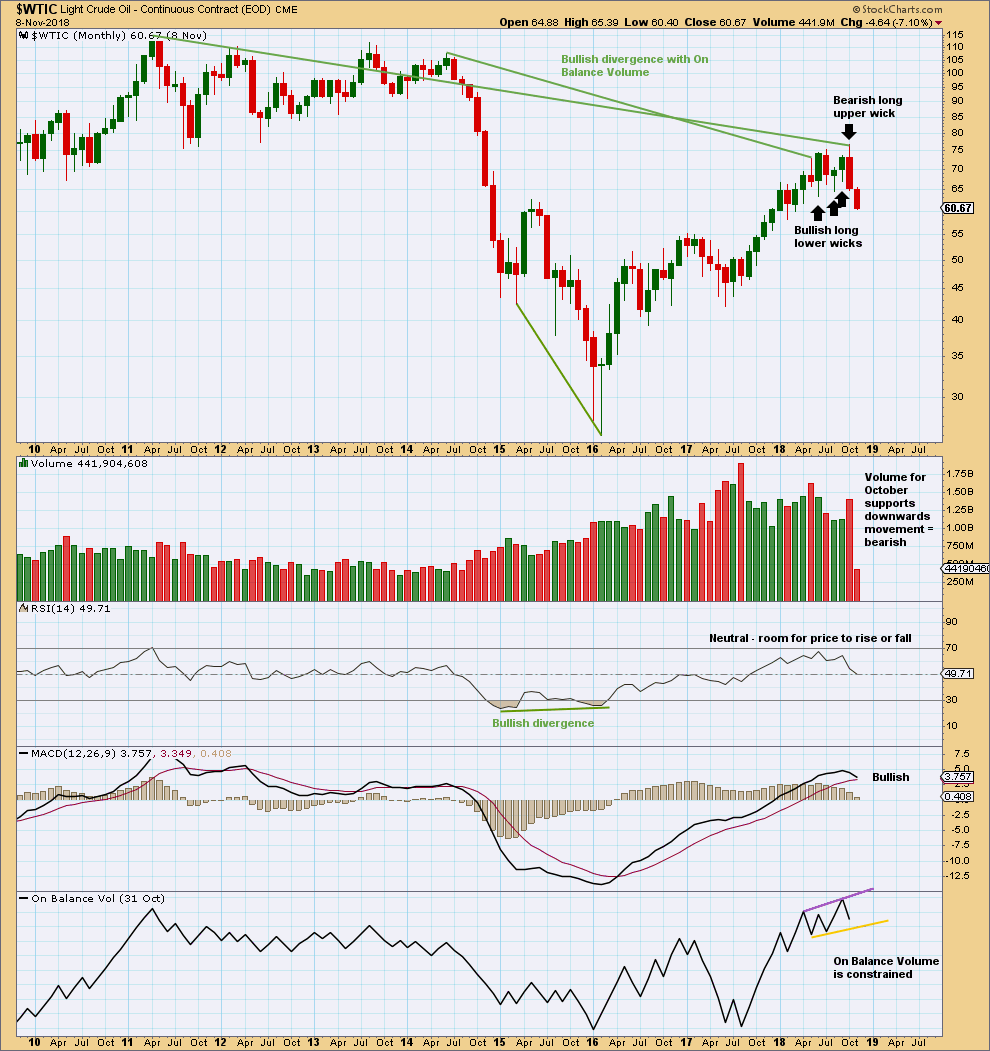
The larger trend remains upwards.
With a long upper candlestick wick and support from volume, the last completed month of October is bearish. On its own, this is not an indication of the end of the upwards trend though; it is noted that August 2017 was similar yet price continued higher.
However, the month of October also completes a Bearish Engulfing candlestick pattern. This is a strong reversal pattern. This strong reversal pattern is now being followed by more downwards movement. Now it does look like there may have been a trend change.
Bullish divergence between price and On Balance Volume remains, and is still a strong technical indicator that price may continue upwards to make new highs.
WEEKLY CHART
Click chart to enlarge. Chart courtesy of StockCharts.com.
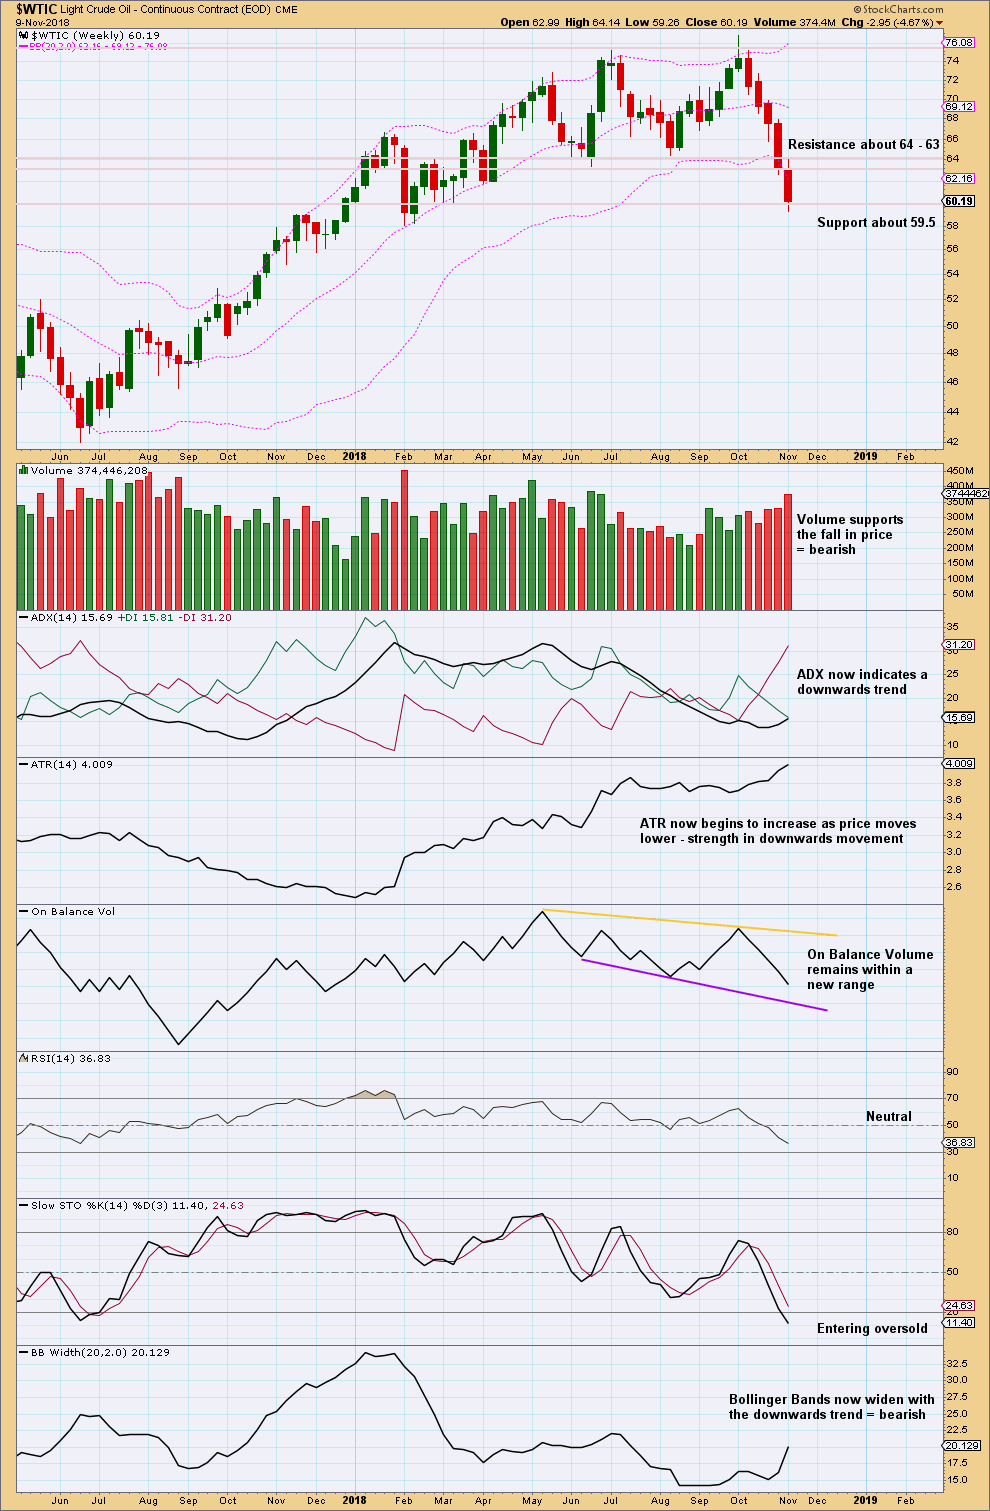
While last week may be seen as a downwards breakout from a consolidation, which had support about 63, price is still in a strong cluster of support here.
It does look at this stage like a new downwards trend may be in its early stages.
Indicators at the weekly chart time frame are not yet extreme. There is plenty of room for price to fall here. Expect this current downwards trend to continue until there is a candlestick reversal pattern.
DAILY CHART
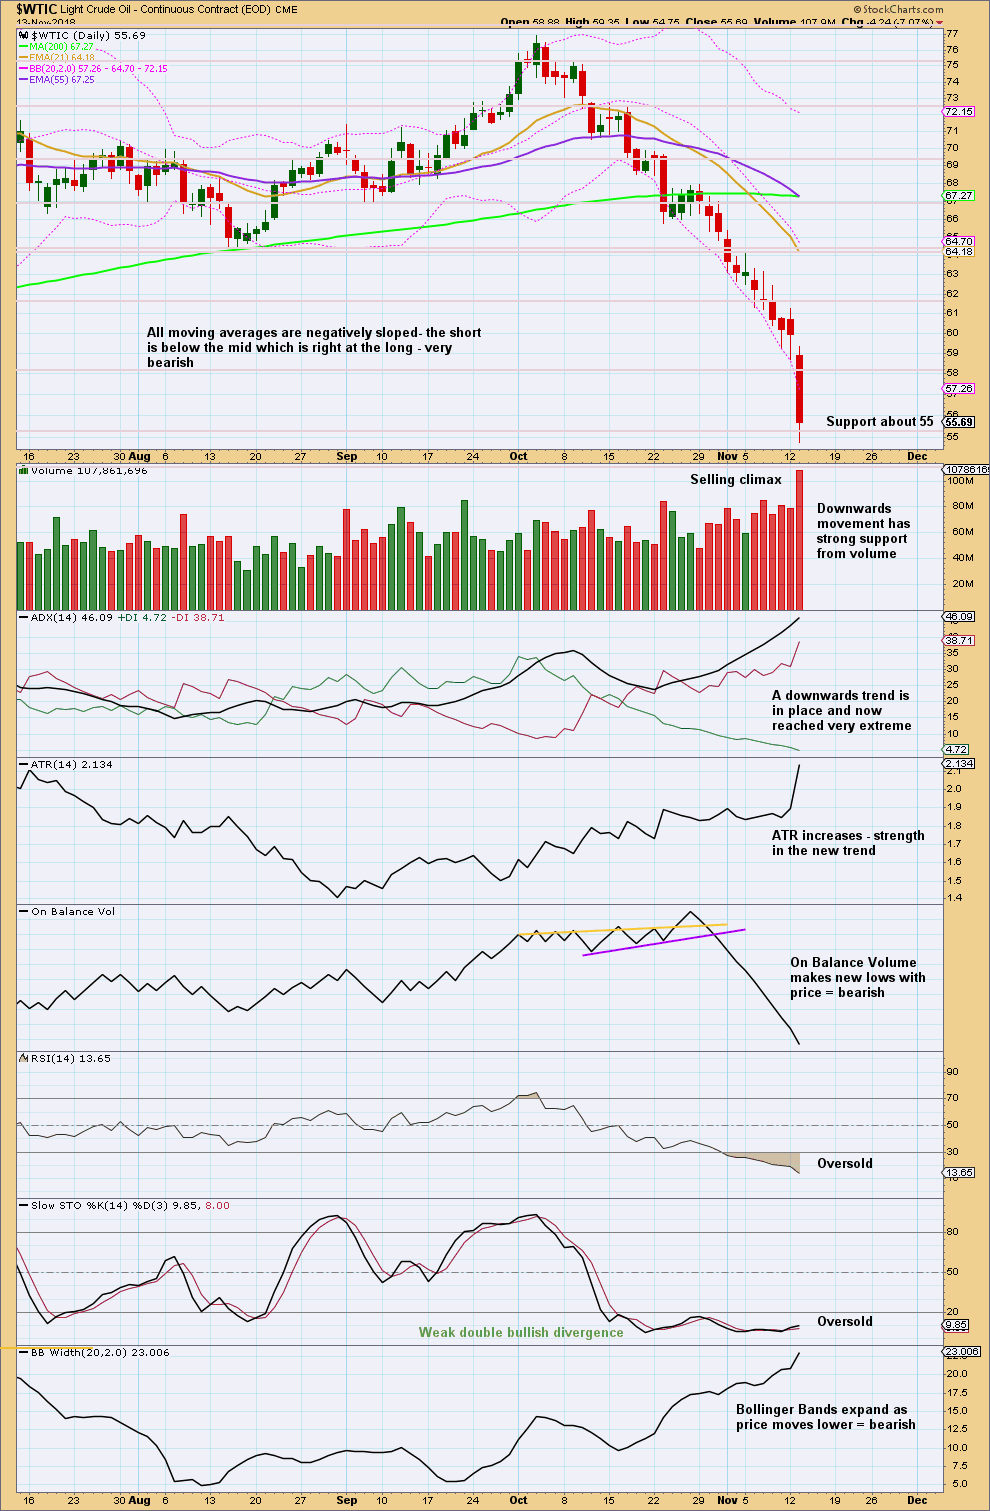
Click chart to enlarge. Chart courtesy of StockCharts.com.
I have taken some time to look back at the last strong bearish trend from Oil from about May 2014 to January 2016. I have noticed that downwards waves often end with support from volume, and sometimes do not even end with a long lower wick. Bullish reversal patterns are often but not always found at lows. RSI can reach very extreme and remain so for as long as three months when this market has a strong downwards trend. At lows Stochastics often will exhibit bullish divergence, but this can be rather weak. At lows RSI sometimes, not always, exhibits bullish divergence and can remain deeply oversold for long periods of time.
US Oil is a particularly difficult market to find lows in. It can trend strongly for very long periods of time with indicators remaining very extreme.
At this time, there is now clearly a downwards trend in place. This could continue for months yet. While price remains within the channel on the daily Elliott wave chart, expect it to continue to fall.
Expect that a low has been found only if a bullish candlestick reversal pattern appears, or the channel is clearly breached. But note that even if these occur, that any bounce may still be short lived. Only if the Fibonacci 55 day moving average is breached and price returns above it may we then have reasonable confidence in the Elliott wave count.
The selling climax today also does not mean that a low may yet be in place. Selling climaxes occur often in this market, and they may be quickly relieved by a very few days of sideways movement or a shallow bounce before price continues to fall.
Published @ 01:55 a.m. EST.
—
Careful risk management protects your trading account(s).
Follow my two Golden Rules:
1. Always trade with stops.
2. Risk only 1-5% of equity on any one trade.
Lara, thanks for the new wave count… It looks quite probable now, but can you think about any interim wave count which would allow oil price to go higher still ( up too 80-90-100 as was expected before but after that still downwards wave below the 2016 low )? Let’s say, the price does not move below 45 within this correction downwards, then reverses and goes up to 80-90-100 targets and then another leg will go downwards below 26 to finish wave II? Is it possible from Elliot wave rules perspective to see continuation of wave II up to 80-100 range and then another leg down below 26 to finish wave II? The thing is that if your new bearish count is correct and we will be moving down with oil price it may put under big doubts bullish wave counts for SP☝️🤷🏼♂️ We are not there yet but we can reasonably expect it around the corner…. Also, it is very hard indeed to wait for the USD to go down deeply ( as in your long term wave count) together with oil for long time period( for years)🤷🏼♂️🤷🏼♂️🤷🏼♂️… At the same time oils strong direction south implies that recession is coming from now on and it will probably be very tough and long-lasting….. it will come eventually- there is no doubt about that but the only question is about timing☝️☝️☝️ If it has already come or we may still have some period of time for USD to fall and all the markets( incl oil) to go higher altogether in kind of final euphoria and 5(5) of V in SP??? That is why I am asking about any interim wave counts and the possibilities of any. Thanks! Sorry for asking such questions but many things changed 180 degrees for the last couple of months…. first, too sharp drop in SP, oil stocks,now oil… time to re-evaluate longer-term timeframes, probabilities etc
Wow. Looks like the price of gas is going down. This is good news for those of us who travel with large motor homes. Mine gets about 7 miles per gallon so a dollar or two off the price of gasoline is a big savings! Unfortunately it may also mean there is a big economic recession ahead.
Thanks Lara.
I’ve just converted our petrol prices to USD per gallon.
Today our petrol costs USD $5.61 per gallon.
Hi Lara – one thing I’ve noted with Elliott is that the price territory covered by waves 2 and 4 in a sequence often tend to be very similar in percentage terms. Looking at your monthly chart can you make a case that the recent decline is a wave C of an irregular wave 4 correction (primary degree). Thanks and best wishes, Chris
Sure, fourth and second waves don’t always exhibit alternation in depth. They can be of similar %.
But to see the current fall as wave C of a flat for primary wave 4 leaves the question; where is intermediate wave (4)?
I could force such a wave count. But intermediate (4) and (2) should look reasonably in proportion, for this idea they would not.
Thank you for the update Lara much appreciated for all your hard work.
You’re welcome.