
Price has remained within the small channel all week, so no indication that a low could be in place has been given.
Summary: At this stage, the classic technical analysis no longer supports the Elliott wave count. While it is still possible that the Elliott wave count could be correct, indicators are very bearish; there is a clear downwards trend here for Oil.
Assume the trend remains the same until proven otherwise.
While price remains within the narrow channel on the daily chart, assume price will continue to fall. A fall below 55.24 would be very bearish indeed.
For confidence in the Elliott wave count the channel needs to be breached. A bullish candlestick reversal pattern would add further confidence. Finally, price moving back above the Fibonacci 55 day moving average would add reasonable confidence.
Oil will be watched closely next week. Check in with the comments section to see any updates if anything changes.
New updates to this analysis are in bold.
ELLIOTT WAVE COUNT
MONTHLY CHART
Click chart to enlarge.
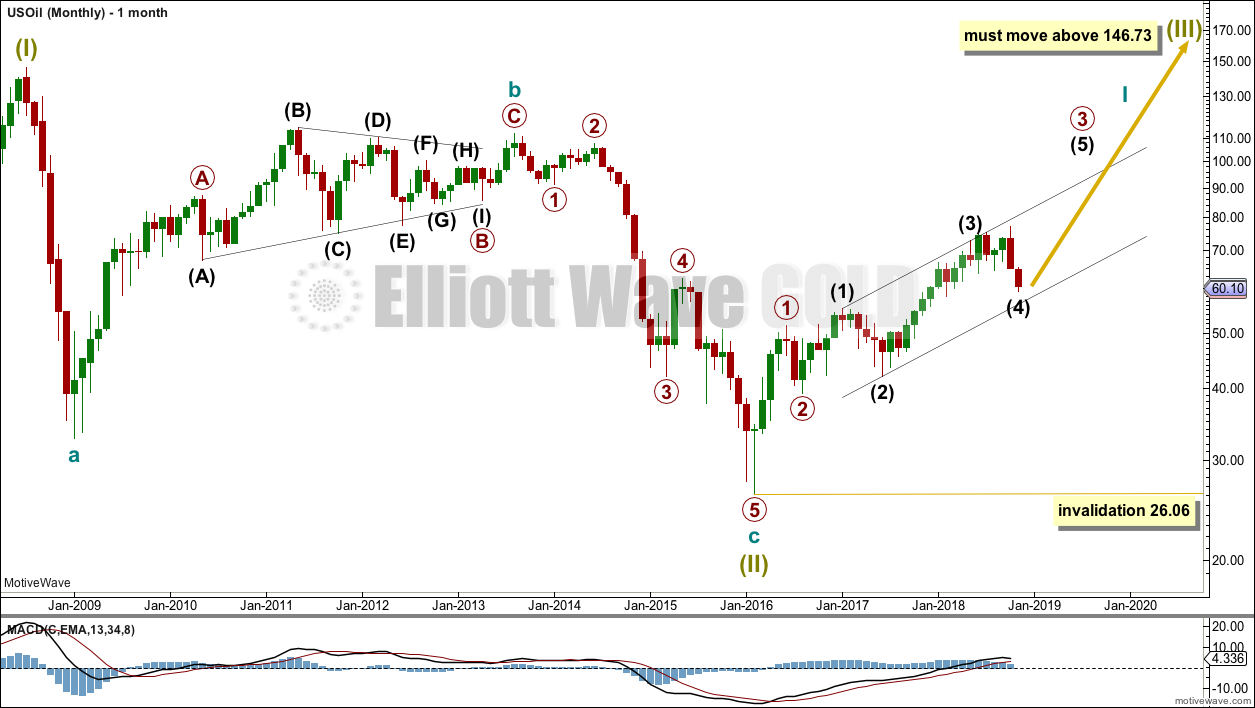
The bear market for US Oil looks to be over and a new bull market looks to be in its early stages. The prior bearish wave count has been invalidated, leaving only this very bullish wave count.
A huge zigzag down to the last low may be complete and is labelled here Super Cycle wave (II).
Cycle wave b must be seen as complete in August 2013 for this wave count to work. It cannot be seen as complete at the prior major swing high in May 2011.
Cycle wave b is seen as a zigzag, and within it primary wave B is seen as a running contracting triangle. These are fairly common structures, although nine wave triangles are uncommon. All subdivisions fit.
Primary wave C moves beyond the end of primary wave A, so it avoids a truncation. But it does not have to move above the price territory of primary wave B to avoid a truncation, which is an important distinction.
If cycle wave b begins there, then cycle wave c may be seen as a complete five wave impulse.
Super Cycle wave (III) must move beyond the end of Super Cycle wave (I). It must move far enough above that point to allow room for a subsequent Super Cycle wave (IV) to unfold and remain above Super Cycle wave (I) price territory.
Cycle wave I may be incomplete. It may be unfolding as an impulse and may have now moved through the middle portion. Commodities have a tendency to exhibit swift strong fifth waves, and this tendency is especially prevalent for third wave impulses. Intermediate wave (5) to end primary wave 3 may be very swift and strong, ending with a blow off top.
At this stage, at the monthly chart level, the current pullback labelled intermediate wave (4) now has good proportion to intermediate wave (2). This part of the wave count has the right look at this time frame; it looks like an incomplete impulse for primary wave 3.
When cycle wave I is complete, then cycle wave II may be a deep correction that may not move beyond the start of cycle wave I below 26.06.
Data from FXCM for USOil does not go back to the beginning of Super Cycle wave (I). Without an accurate known length of Super Cycle wave (I) a target cannot be calculated for Super Cycle wave (III) to end using Fibonacci ratios. The target for Super Cycle wave (III) may be calculated when cycle waves I, II, III and IV within it are complete. That cannot be done for many years.
WEEKLY CHART
Click chart to enlarge.
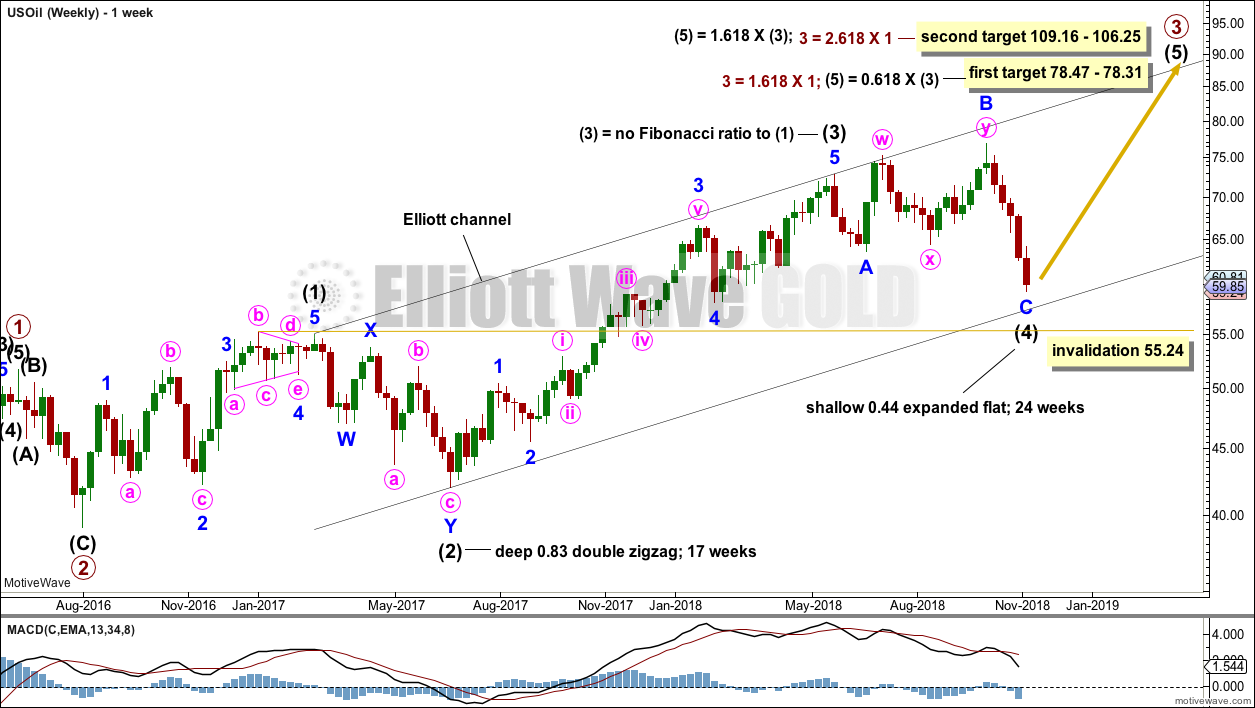
Intermediate wave (3) is now complete. There is no Fibonacci ratio between intermediate waves (1) and (3), and intermediate wave (3) is longer than 1.618 the length of intermediate wave (1).
This wave count fits with classic technical analysis at the monthly and daily chart levels.
Intermediate wave (2) was a deep double zigzag.
Intermediate wave (4) is this week relabelled as a complete expanded flat correction. Downwards movement this week is too deep for a normal looking combination (combinations are sideways movements), and this now has the normal look of wave C of an expanded flat. Expanded flats are common structures.
There would now be perfect alternation between the double zigzag of intermediate wave (2) and an expanded flat of intermediate wave (4).
The channel about primary wave 3 on this weekly chart, which is on a semi-log scale, is drawn using Elliott’s first technique. Drawn on this scale, there is still some room here for price to fall further. If price keeps falling, then look for strong support now at the lower edge of the channel.
If price falls further, then the target zones would need to be recalculated.
Intermediate wave (4) may not move into intermediate wave (1) price territory below 55.24.
I have tried to see a more bearish Elliott wave count for US Oil. At this time, I have not been able to find a good solution. That does not mean one does not exist. If I find it, it will be published in comments this week.
DAILY CHART
Click chart to enlarge.
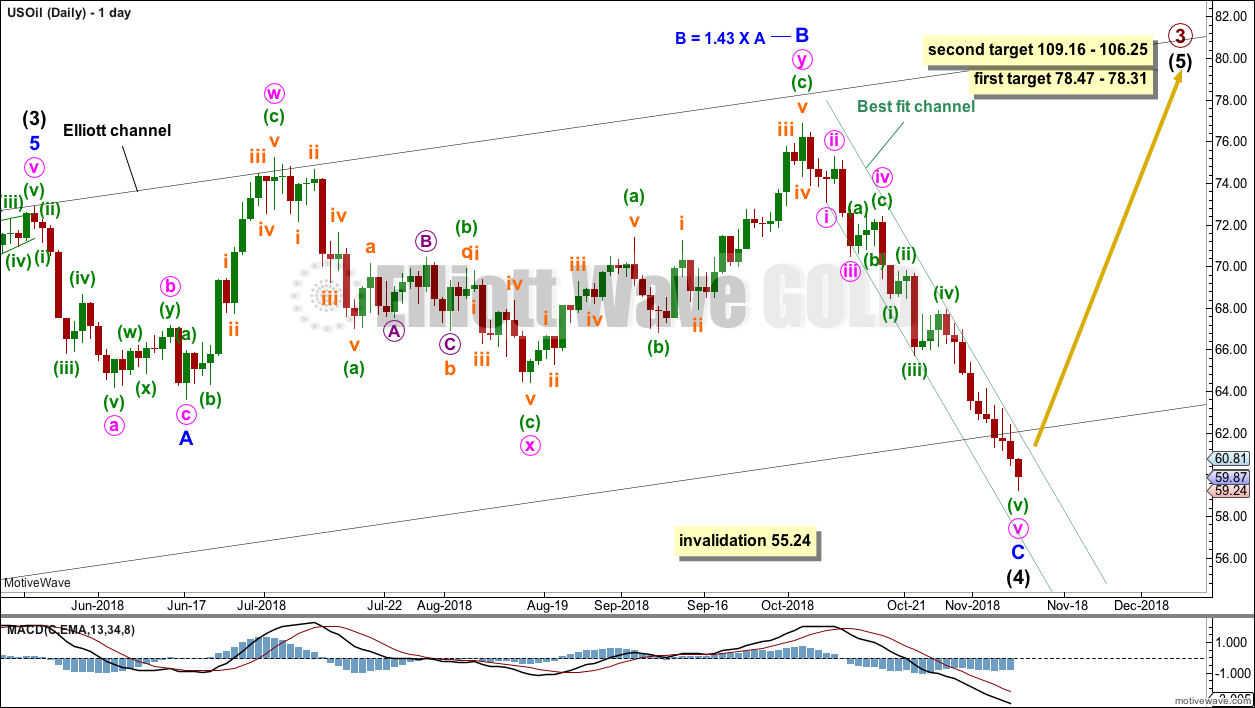
Intermediate wave (4) may be now be a complete or almost complete expanded flat correction. Minor wave B is just a little longer than the most common range of up to 1.38 times the length of minor wave A, but well within the maximum conventional allowance of up to 2 times the length of minor wave A.
There is no adequate Fibonacci ratio between minor waves A and C.
Price remains within the narrow best-fit channel. A breach of this channel is required for confidence that a low is in place. The breach should be by a full green daily candlestick above and not touching the upper edge of the channel.
If a candlestick reversal pattern appears at the low, that would also offer confidence that a low is in place.
It must be accepted that price may continue to fall while it remains within the downwards best-fit channel.
On this daily chart, which is on an arithmetic scale, the lower edge of the black Elliott channel is now overshot.
TECHNICAL ANALYSIS
MONTHLY CHART
Click chart to enlarge. Chart courtesy of StockCharts.com.
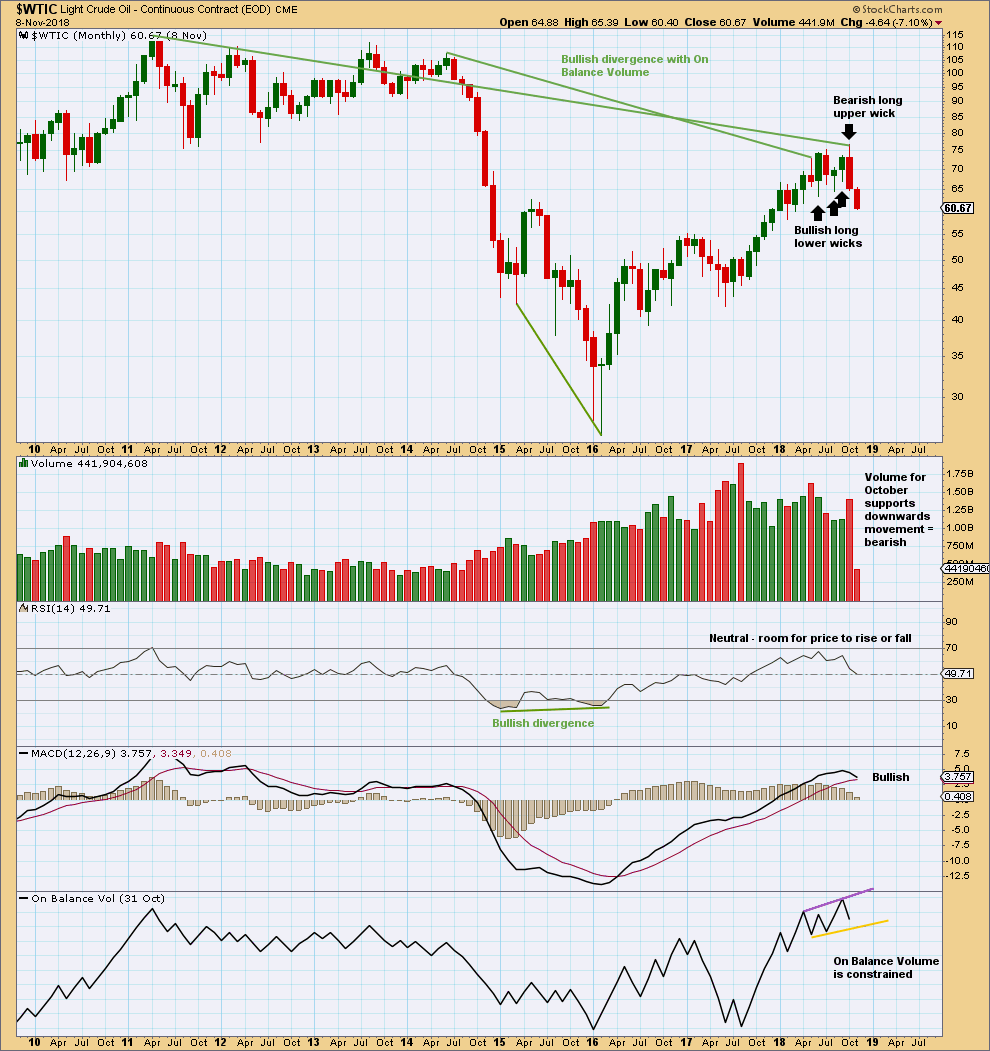
The larger trend remains upwards.
With a long upper candlestick wick and support from volume, the last completed month of October is bearish. On its own, this is not an indication of the end of the upwards trend though; it is noted that August 2017 was similar yet price continued higher.
However, the month of October also completes a Bearish Engulfing candlestick pattern. This is a strong reversal pattern. This offers a warning that the Elliott wave count may be wrong. Members are advised to carefully manage risk if expecting price may continue upwards from here.
Bullish divergence between price and On Balance Volume remains, and is still a strong technical indicator that price may continue upwards to make new highs.
WEEKLY CHART
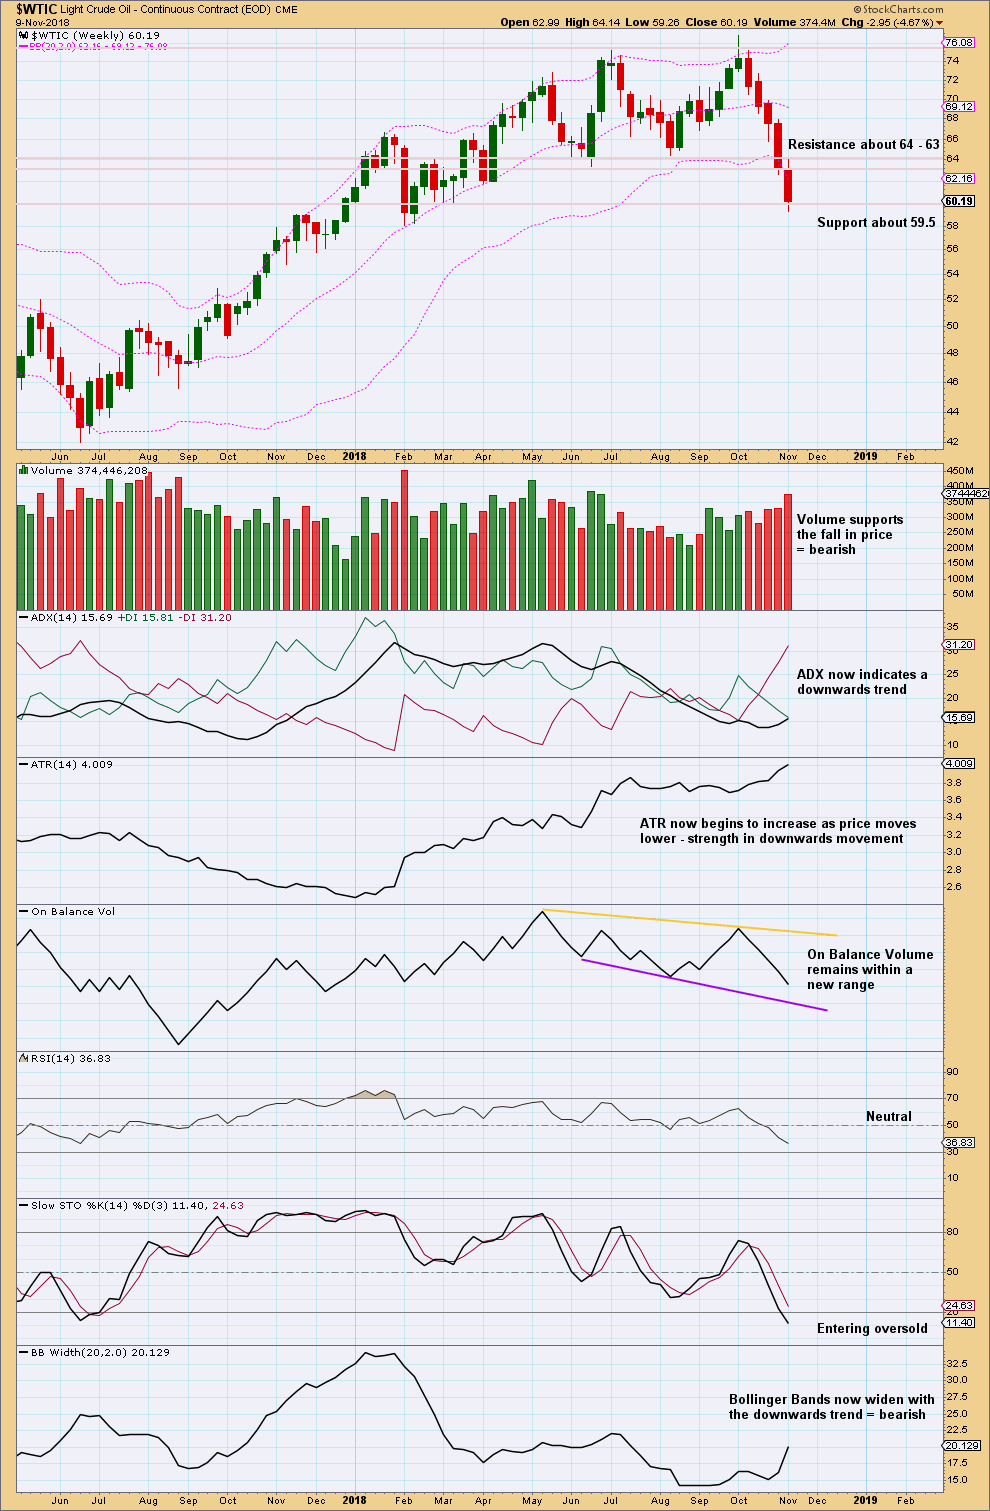
Click chart to enlarge. Chart courtesy of StockCharts.com.
While this week may be seen as a downwards breakout from a consolidation, which had support about 63, price is still in a strong cluster of support here.
It does look at this stage like a new downwards trend may be in its early stages.
Indicators at the weekly chart time frame are not yet extreme. There is plenty of room for price to fall here. Expect this current downwards trend to continue until there is a candlestick reversal pattern.
DAILY CHART
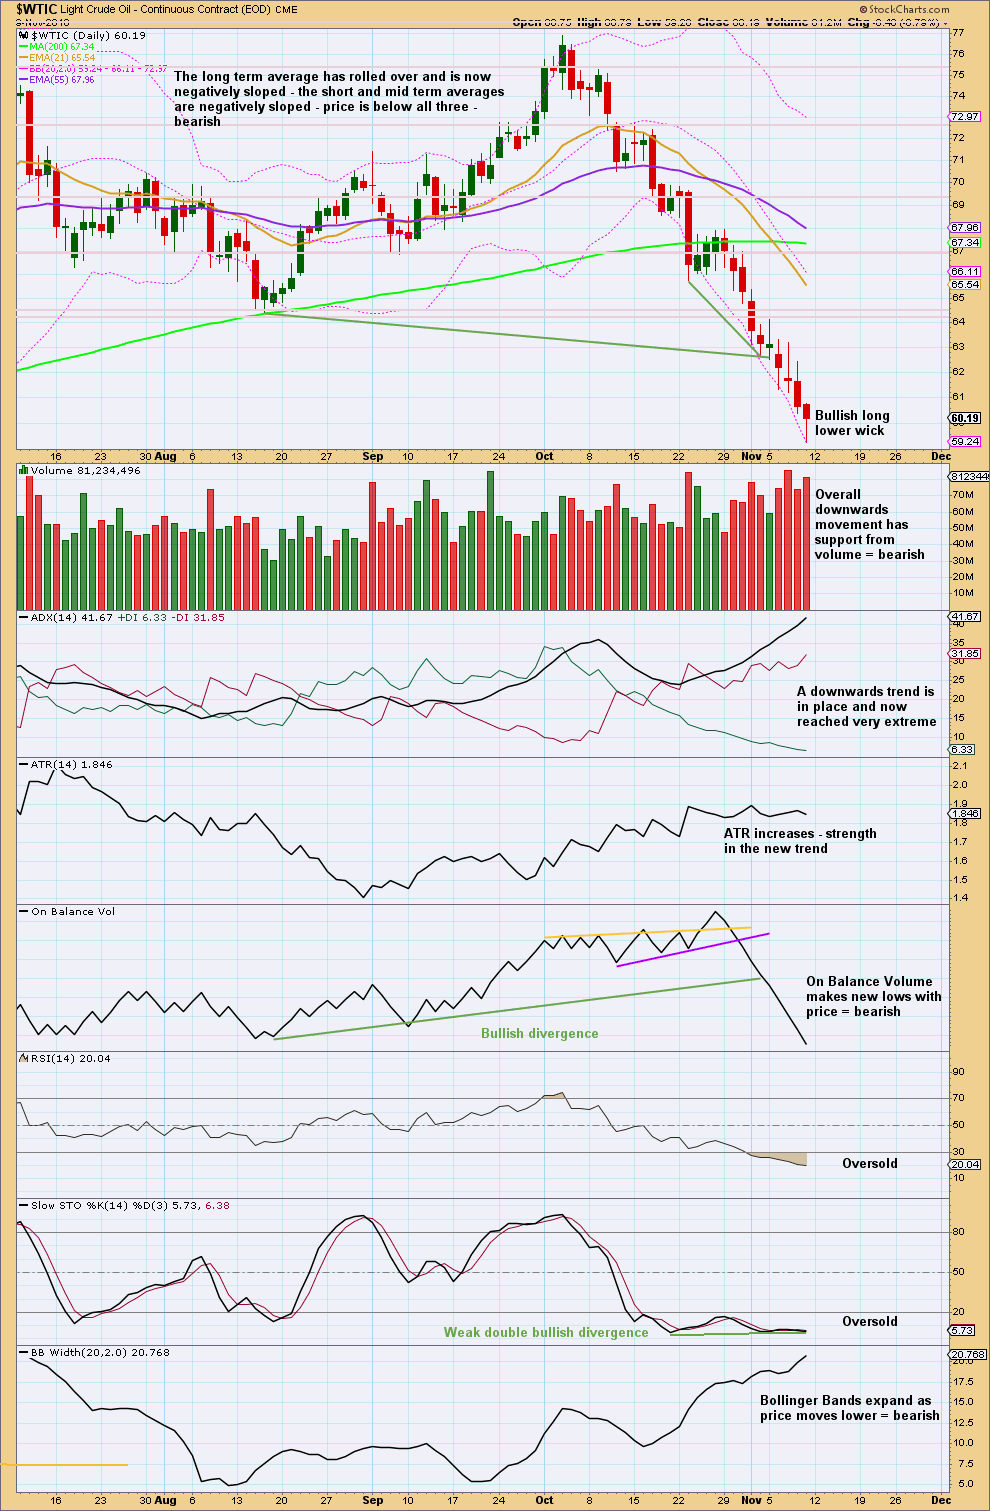
Click chart to enlarge. Chart courtesy of StockCharts.com.
I have taken some time today to look back at the last strong bearish trend from Oil from about May 2014 to January 2016. I have noticed that downwards waves often end with support from volume, and sometimes do not even end with a long lower wick. Bullish reversal patterns are often but not always found at lows. RSI can reach very extreme and remain so for as long as three months when this market has a strong downwards trend. At lows Stochastics often will exhibit bullish divergence, but this can be rather weak. At lows RSI sometimes, not always, exhibits bullish divergence and can remain deeply oversold for long periods of time.
US Oil is a particularly difficult market to find lows in. It can trend strongly for very long periods of time with indicators remaining very extreme.
At this time, there is now clearly a downwards trend in place. This could continue for months yet. While price remains within the channel on the daily Elliott wave chart, expect it to continue to fall.
Expect that a low has been found only if a bullish candlestick reversal pattern appears, or the channel is clearly breached. But note that even if these occur, that any bounce may still be short lived. Only if the Fibonacci 55 day moving average is breached and price returns above it may we then have reasonable confidence in the Elliott wave count.
Published @ 03:37 p.m. EST on November 10, 2018.
—
Careful risk management protects your trading account(s).
Follow my two Golden Rules:
1. Always trade with stops.
2. Risk only 1-5% of equity on any one trade.
A new separate US Oil analysis is prepared and will be published very shortly.
If members could leave any comments about oil on the new analysis for the rest of this week, that’d be great. Thanks, and thanks for your patience.
I have two ideas for Oil. I’ll be updating charts later today, here.
For now, the classic analysis remains the same. This is a downwards trend. Only short positions should be held. The trend can continue with strength for a reasonable time.
Lara,
Are you going to be posting updates here? Or somewhere else?
Could oil be bottoming here?
Lara,
Are you putting comment about oil anywhere? I see comment in Lara’s weekly. I don’t have access to that. I am member of daily analysis of EWgold and EWstockmarket. I saw oil breached 55.21. What does that do to your wave count? Please advice ASAP. I have a small position and want to make a decision. Thank you!