
An upwards breakout on the 12th of November was today proven false as price is back below resistance.
Summary: The bearish Elliott wave count expects a new high to 98.09 or above and then a trend change. The bullish Elliott wave count expects a trend change now.
The bottom line here is that there is an upwards trend in place since the low on the 21st of September. Only a new swing low below 95.48 would signal a trend change.
New updates to this analysis are in bold.
BEARISH ELLIOTT WAVE ANALYSIS
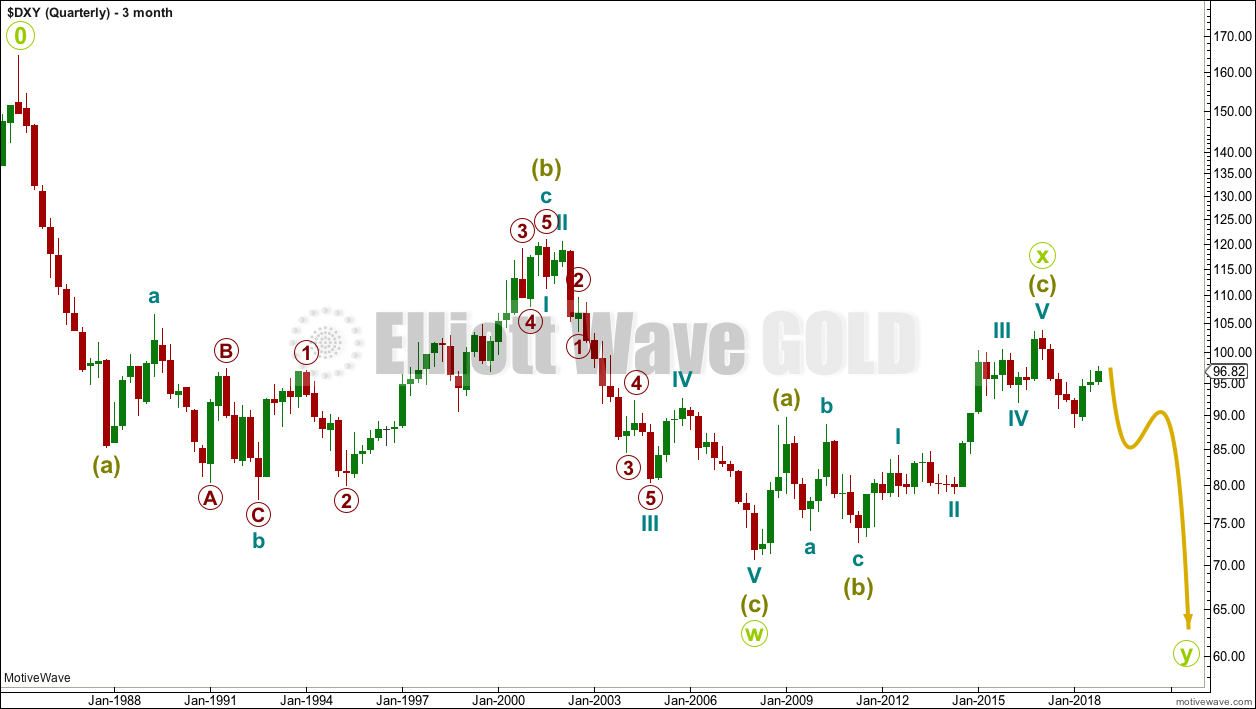
QUARTERLY CHART
Click chart to enlarge.
The wave count begins at 0.
A huge double zigzag may be continuing lower.
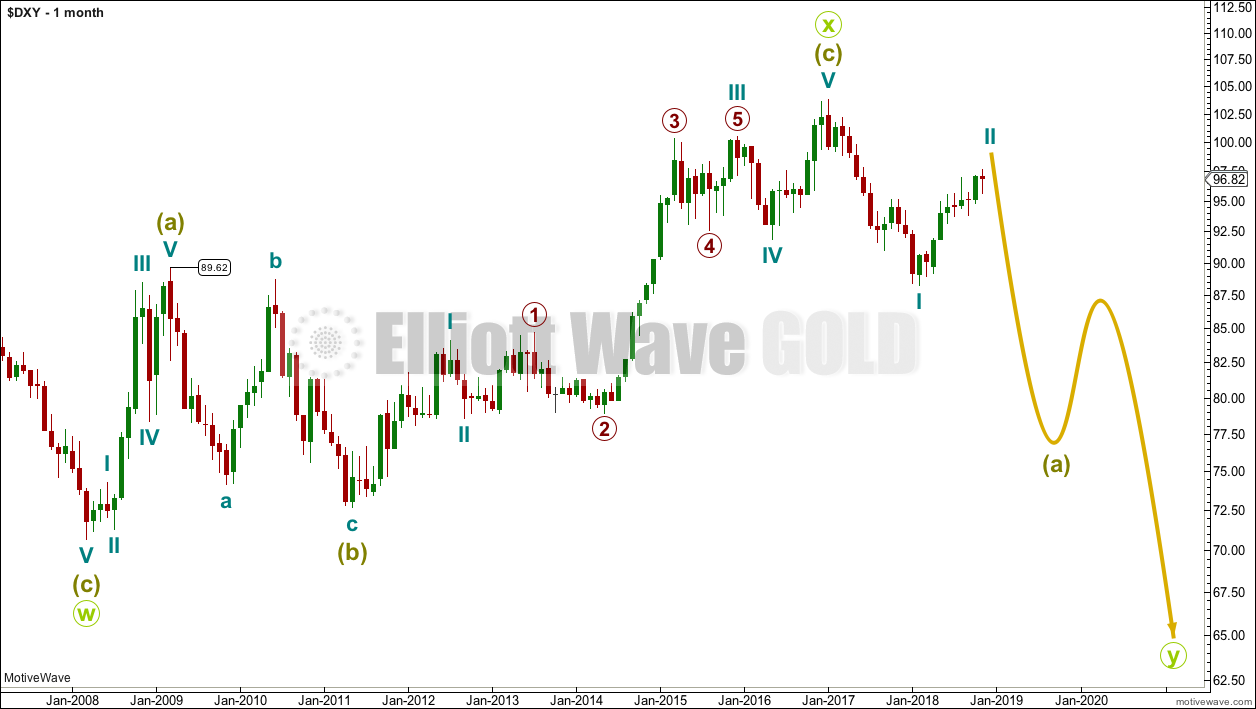
MONTHLY CHART
Click chart to enlarge.
Downwards movement from the high in January 2017 cannot be a fourth wave correction within an ongoing impulse higher because a new low below 89.62 would be back in first wave price territory.
That indicates the last big wave up may be a completed three, and for that reason this is my main wave count.
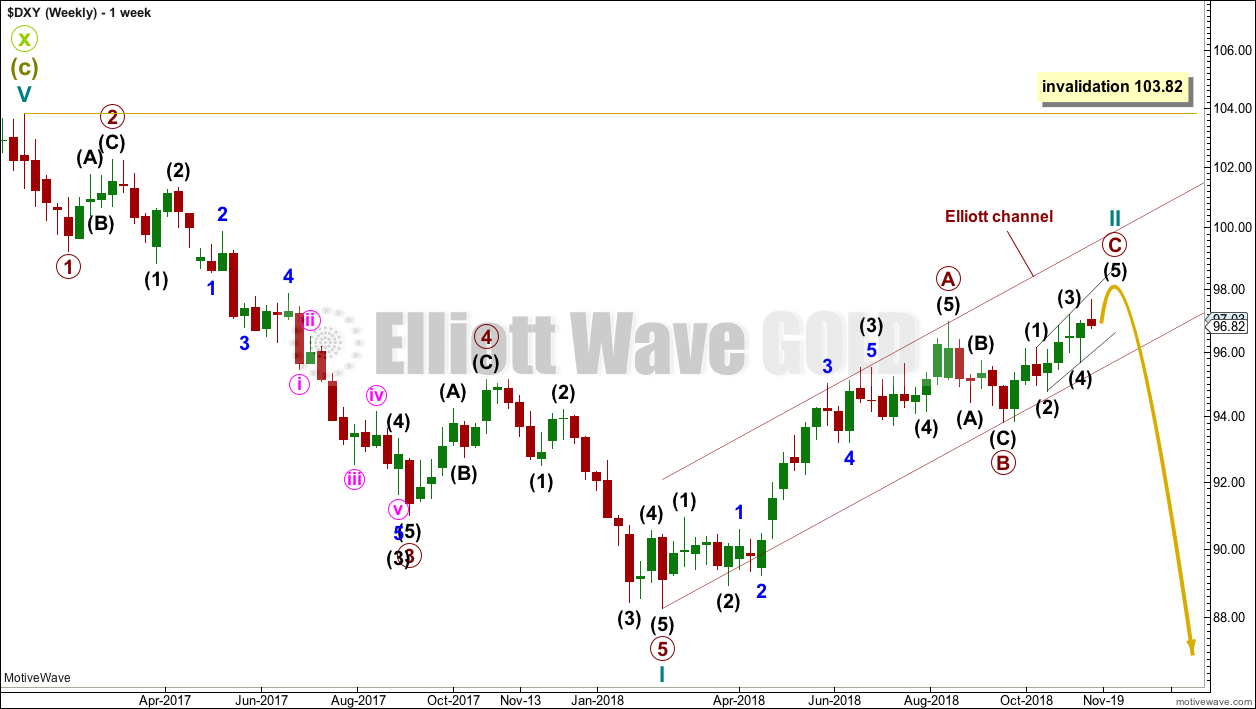
WEEKLY CHART
Click chart to enlarge.
Cycle wave I downwards fits very well as a five wave impulse. This may be reasonably expected to be followed by a three wave structure upwards.
For the USD Index, historically the first second wave correction within a new trend is usually extremely deep, about 0.80 to 0.90 of the first wave it corrects. It would be typical here to see Cycle wave II reach to 0.80 or deeper of cycle wave I.
Cycle wave II may be unfolding as a zigzag, which is the most common type of corrective structure.
Primary wave A may now be a completed five wave impulse.
Primary wave B may be complete as labelled on this weekly chart. However, it may also be labelled as incomplete as per the labelling for this movement on the alternate weekly chart below.
If primary wave B continues, then it may be as a flat, combination, double zigzag or triangle. Primary wave B may not move beyond the start of primary wave A below 88.25.
Cycle wave II may not move beyond the start of cycle wave I above 103.82.
Draw a channel about cycle wave II as shown. This is Elliott’s technique for a correction. Primary wave C may end either mid way within the channel or about the upper edge.
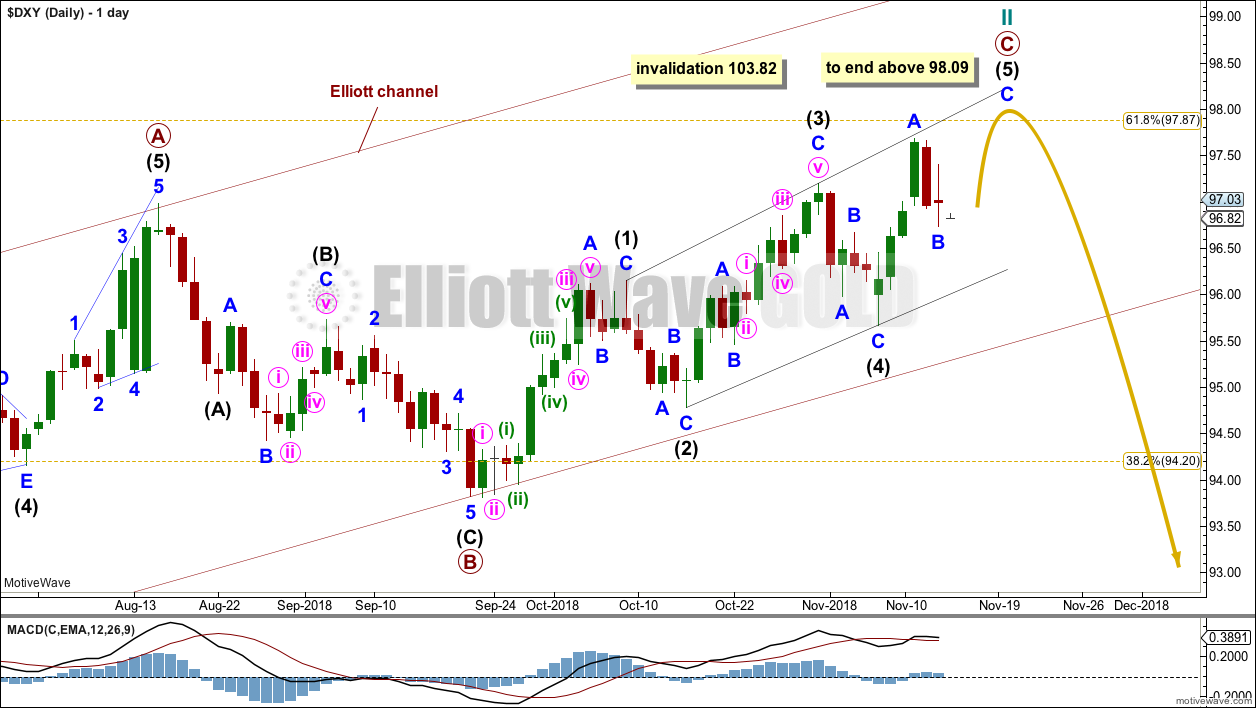
DAILY CHART
Click chart to enlarge.
If primary wave B is complete, then primary wave C should have begun. Primary wave B will fit as a brief and shallow zigzag. This is entirely possible; B waves exhibit the greatest variety in Elliott wave structure and price behaviour.
Primary wave C may be unfolding as an ending expanding diagonal. Because the diagonal is expanding intermediate wave (5) must be longer than intermediate wave (3) and must end beyond 98.09, which is where it would reach equality in length with intermediate wave (3).
Within an ending diagonal, all sub-waves must subdivide as zigzags. Within the final zigzag of intermediate wave (5), minor wave B may not move beyond the start of minor wave A below 95.67. If price breaks below 95.67 without first moving higher to 98.09 or above, then my analysis of cycle wave II is wrong; cycle wave II may have ended.
It is also possible to move the degree of labelling within primary wave B all down one degree and see it as an incomplete flat, combination or triangle.
BULLISH ELLIOTT WAVE ANALYSIS
QUARTERLY CHART
Click chart to enlarge.
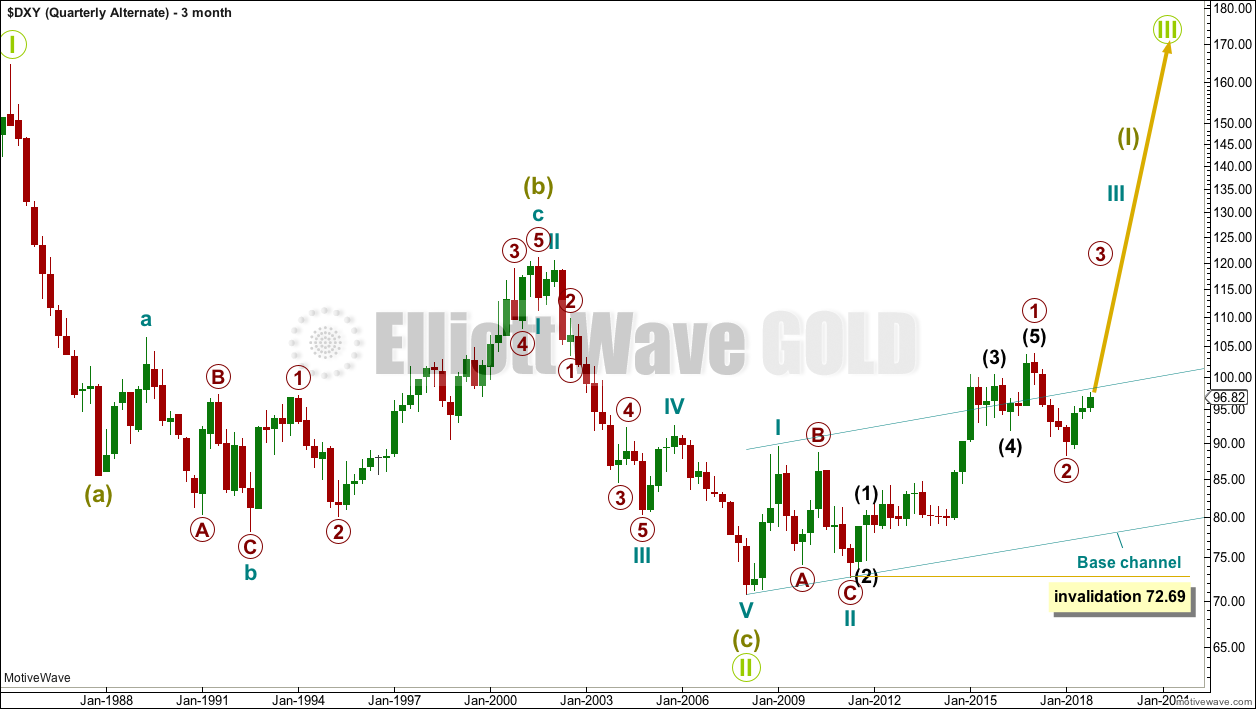
A single zigzag down to the last major low may still be complete.
A new upwards trend may continue. So far there may be two overlapping first and second waves. Primary wave 2 may not move beyond the start of primary wave 1 below 72.69.
Primary wave 2 should find strong support at the lower edge of the teal base channel if it gets down that low.
MONTHLY CHART
Click chart to enlarge.
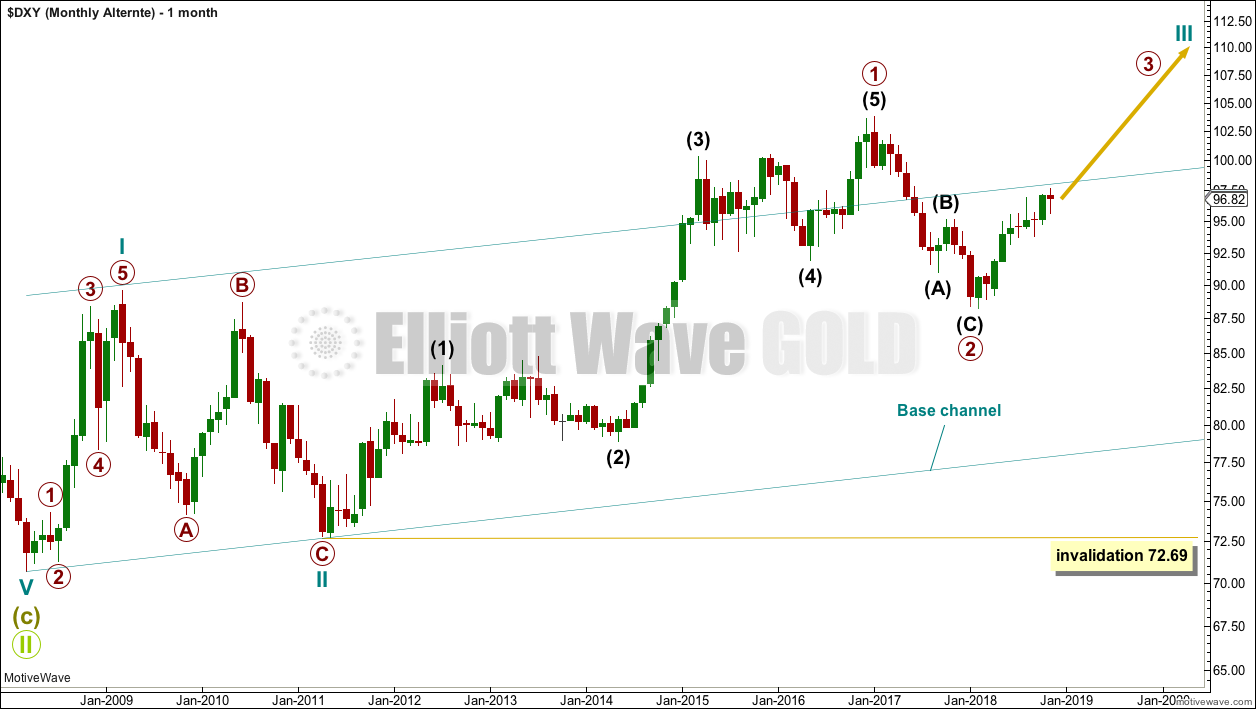
Primary wave 2 may be a complete zigzag. However, this wave down can also be seen as a five and primary wave 2 may yet continue lower.
WEEKLY CHART
Click chart to enlarge.
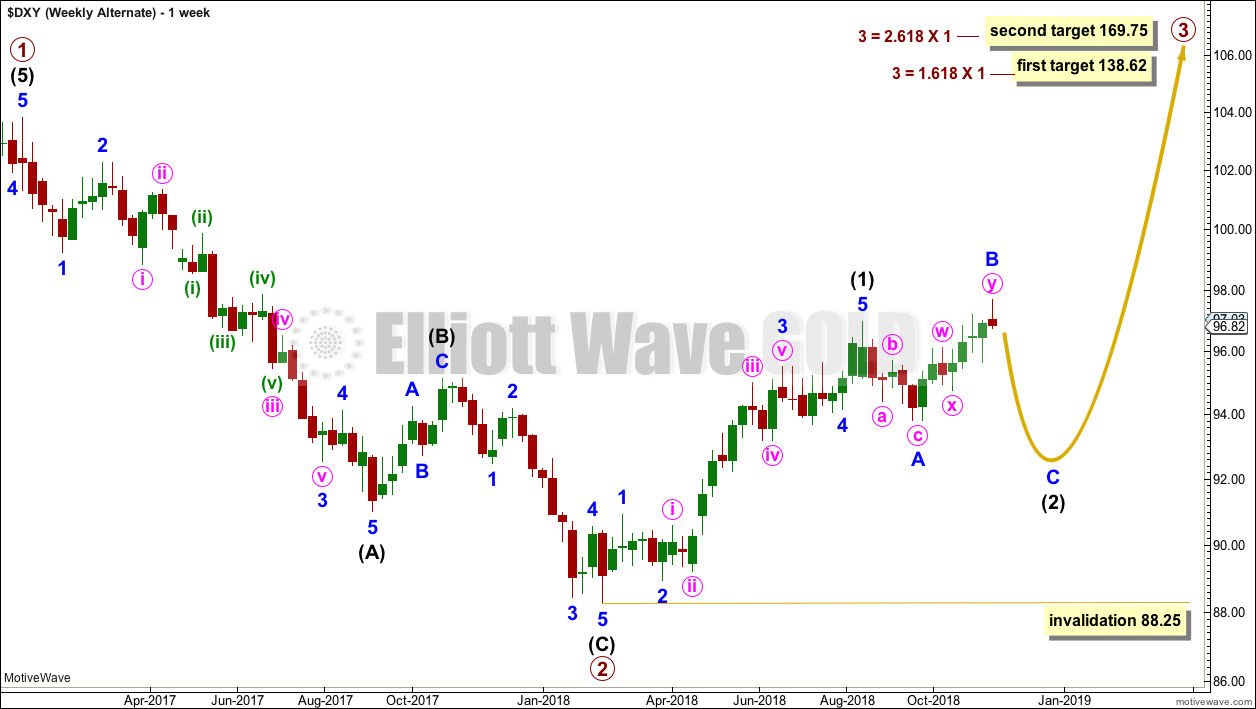
This bullish wave count sees the last wave down as a completed zigzag. If this is correct, then within primary wave 3 no second wave correction may move beyond its start below 88.25.
DAILY CHART
Click chart to enlarge.
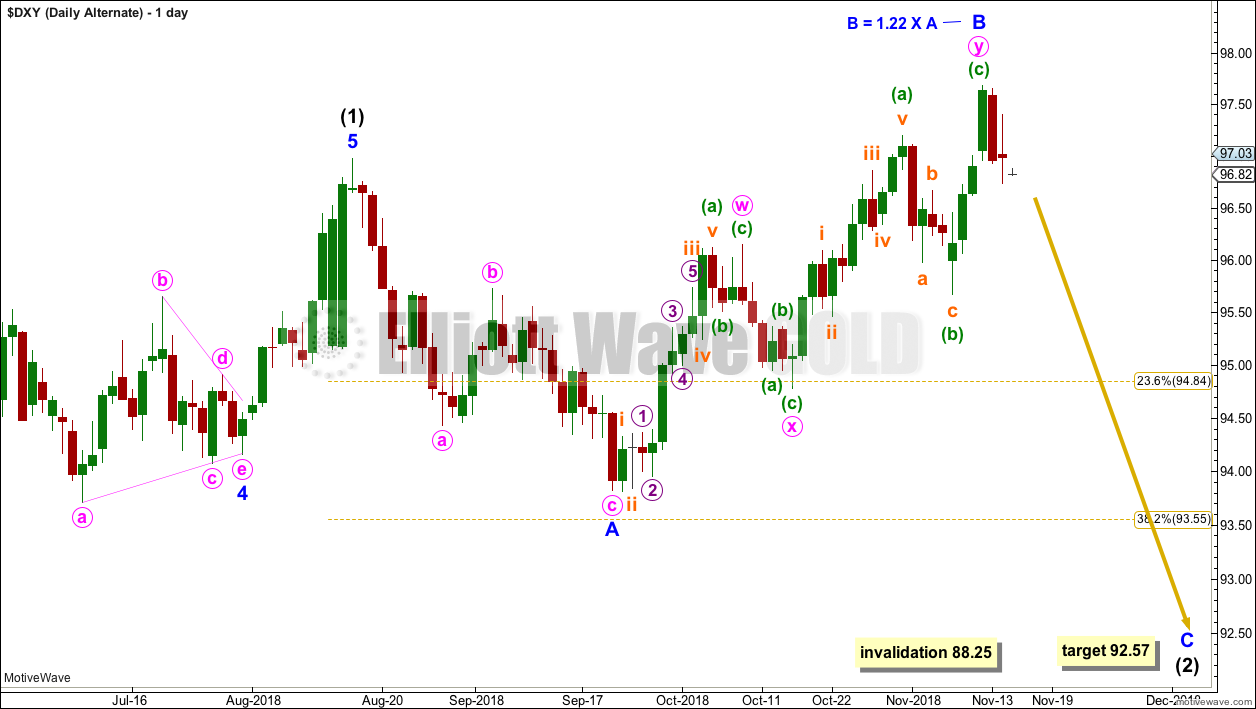
Intermediate wave (2) may be an incomplete expanded flat. The first wave down within it is labelled minor wave A, which is a complete zigzag. Minor wave B may now be complete at 1.22 the length of minor wave A, which is within the most common range for B waves of flats of 1 to 1.38 times the length of their A waves.
Minor wave C may move below the end of minor wave A at 93.81 to avoid a truncation. A target is calculated now for minor wave C to reach the most common Fibonacci ratio to minor wave A within an expanded flat correction.
TECHNICAL ANALYSIS
MONTHLY CHART
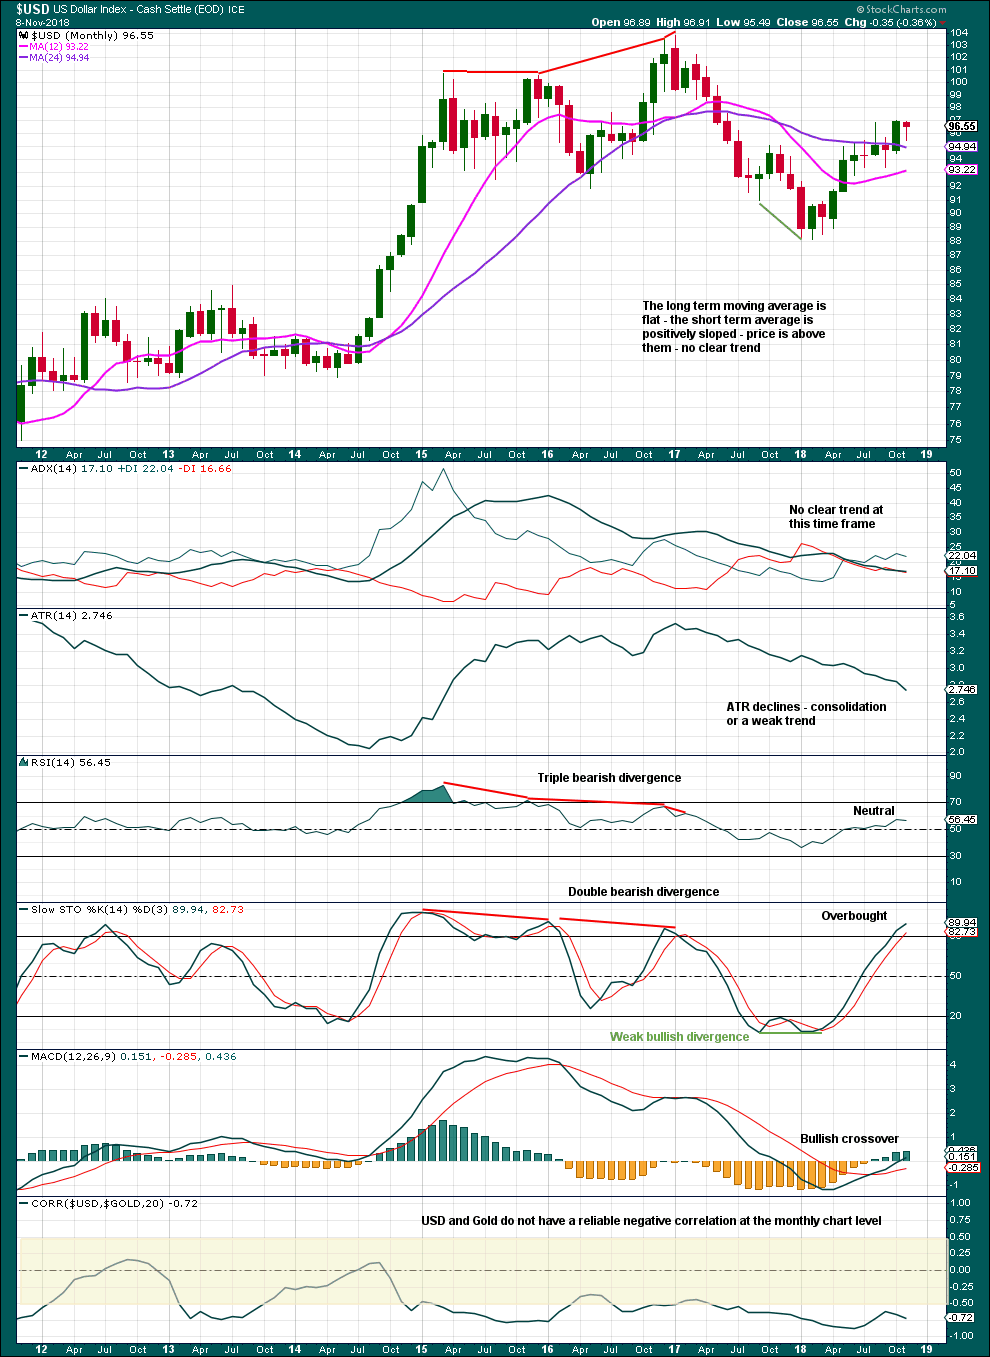
Click chart to enlarge. Chart courtesy of StockCharts.com.
October was a strong bullish month. This may be reasonably expected to be followed by more upwards movement. This supports the main Elliott wave count.
DAILY CHART
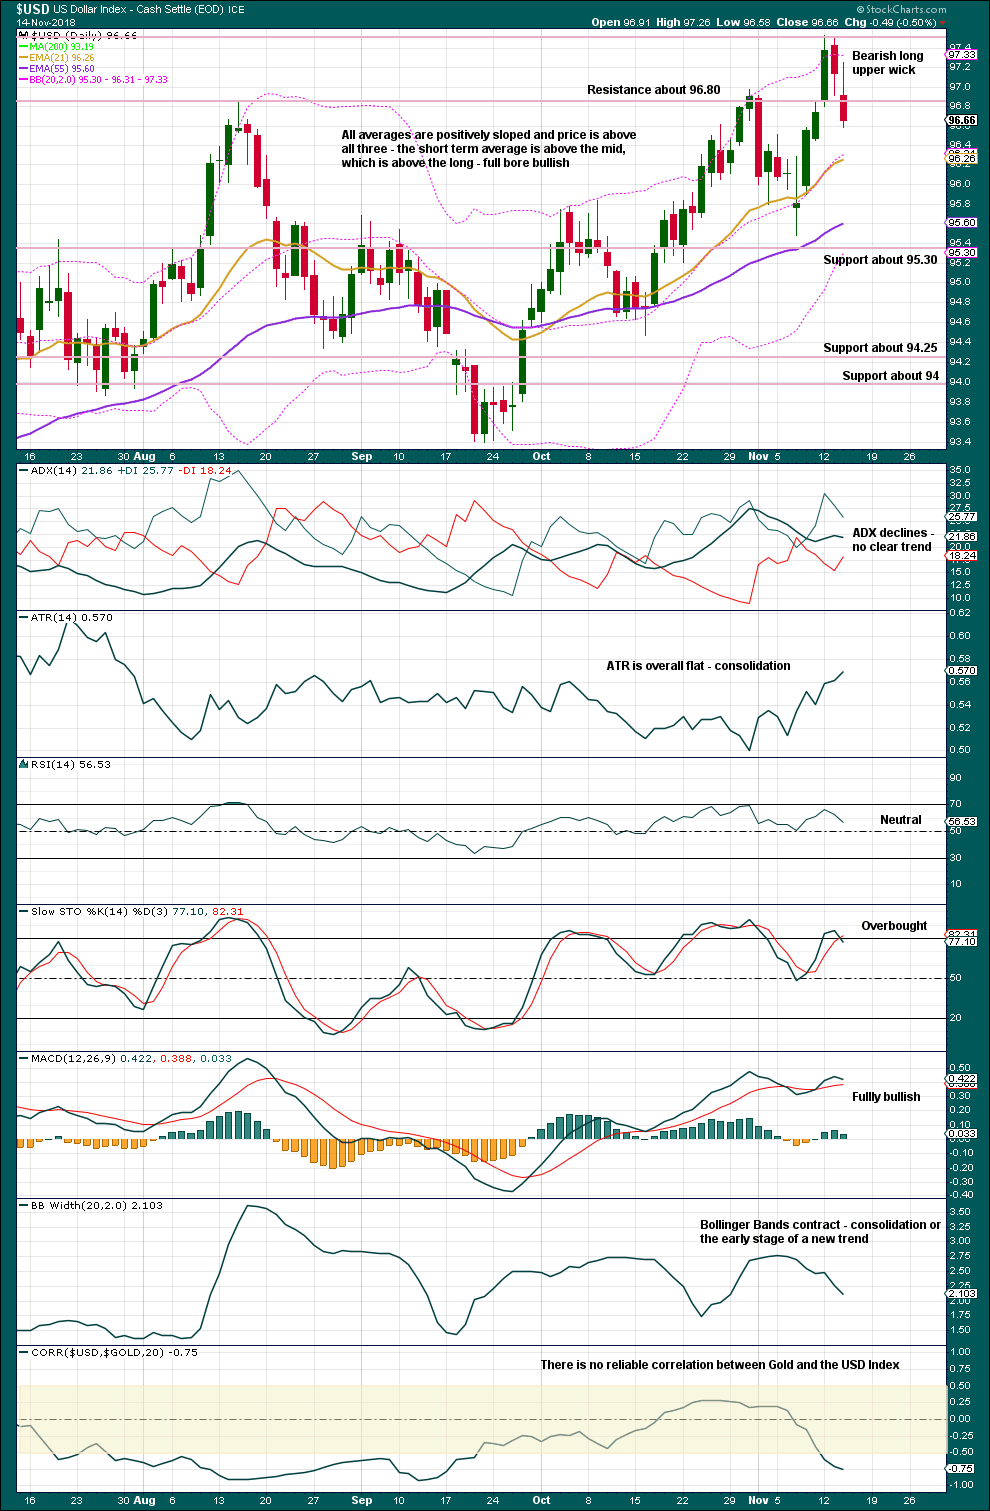
Click chart to enlarge. Chart courtesy of StockCharts.com.
The upwards breakout above resistance at 96.80 on the 12th of November is false as price has now returned back below resistance.
However, since the 21st of September there is a series of higher highs and higher lows, the definition of an upwards trend. Only a new low now below 95.48 would provide a lower low and indicate this upwards trend may be over.
Published @ 03:15 a.m. EST.