
The Elliott Wave count this week expects price to move lower in the short term, as price remains range bound. This has support from volume.
Summary: Silver has had a very long consolidation from about November 2016 to July 2017. A technical principle is the longer price consolidates the stronger and longer lasting the next trend may be.
The breakout was down. The long-term target for the current downwards trend remains at 12.08.
The larger trend remains down until proven otherwise.
For the short term, expect sideways movement for a few weeks before the downwards trend resumes.
Monthly charts were reviewed here.
New updates to this analysis are in bold.
ELLIOTT WAVE COUNTS
MAIN WAVE COUNT
WEEKLY CHART – TRIANGLE
Click chart to enlarge.
This first wave count has good support from classic technical analysis, so it will be favoured. This wave count looks likely.
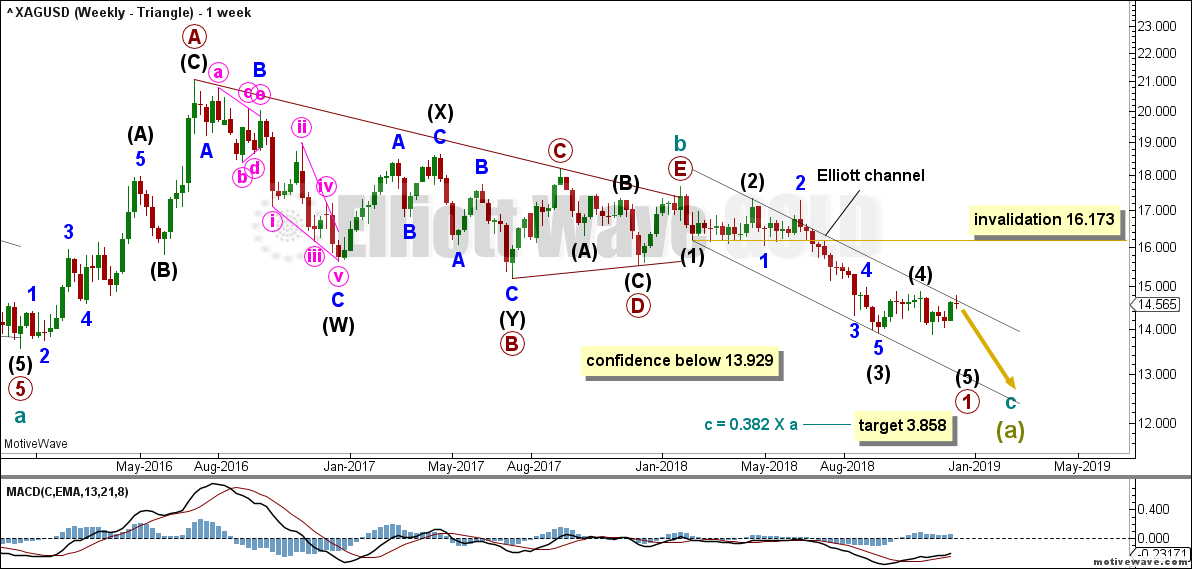
The first wave count expects that the bear market, which began from the April 2011 high, is incomplete.
Cycle wave a is seen as a five wave impulse for this main wave count.
This first weekly chart sees cycle wave b as a now possibly complete regular contracting triangle.
Primary wave E of the triangle may have ended with an overshoot of the A-C trend line.
Within cycle wave c, primary wave 1 may be an incomplete impulse. Within primary wave 1, intermediate waves (1), (2), (3) and (4) may be complete. The alternate wave count looks at the possibility that intermediate wave (4) may continue a little further sideways.
Intermediate wave (4) may not overlap into intermediate wave (1) price territory above 16.173.
Intermediate wave (2) was a deep 0.77 flat correction lasting ten weeks. Intermediate wave (4) may be a shallow combination with wave W subdividing as a zigzag and wave Y subdividing as an expanded flat, which exhibits alternation.
Cycle wave c needs to move below the end of cycle wave a in order to avoid a truncation.
The Elliott channel is drawn from the ends of intermediate degree waves.
DAILY CHART – TRIANGLE
Click chart to enlarge.
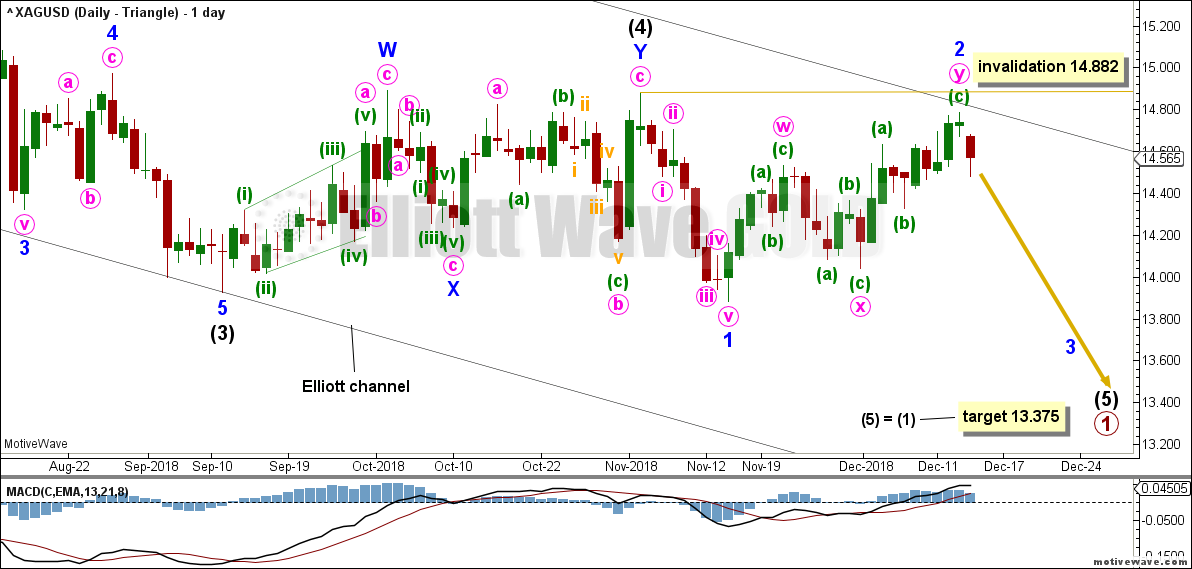
Intermediate wave (4) may be a complete double combination.
Within intermediate wave (5), minor wave 1 fits well as a complete impulse. Minor wave 2 moved higher this week. It may be complete as a possible double zigzag. Minor wave 2 remains below the invalidation point at 14.882.
Silver behaves like a typical commodity. It often exhibits swift strong fifth waves. While this tendency is especially prevalent for its fifth waves to end third wave impulses one degree higher, it can also show up for fifth waves to end first wave impulses. Look out for the possibility that intermediate wave (5) may be very swift and strong, ending with a selling climax. This is not a certainty, but the possibility exists and so we should be aware of it.
There is no adequate Fibonacci ratio between intermediate waves (3) and (1). This makes it more likely that intermediate wave (5) may exhibit a Fibonacci ratio to either of intermediate waves (3) or (1); the most common Fibonacci ratio for a fifth wave is equality in length with the first wave. A target is calculated for intermediate wave (5). At 13.375 it would reach equality with intermediate wave (1).
DAILY CHART – TRIANGLE ALTERNATE
Click chart to enlarge.
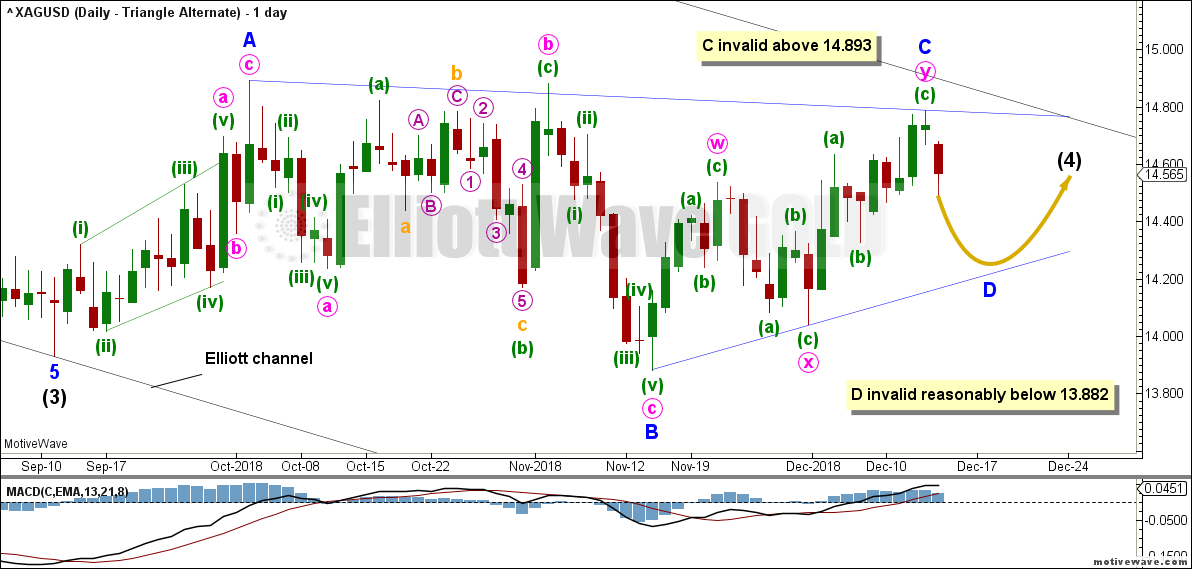
It is possible that intermediate wave (4) may be continuing sideways as a running contracting triangle.
Elliott wave triangles normally adhere very well to their trend lines, and the triangle trend lines are often tested within triangle sub-waves. The high labelled minute wave b within minor wave B may be a test of the A-C trend line, and may show where the A-C trend line may sit. This may show where minor wave C may end, at resistance at this trend line.
Because the A-C trend line has a very shallow slope the B-D trend line would most likely have a reasonable slope, so that the triangle trend lines do not look close to parallel. Elliott wave triangle trend lines normally converge at a reasonable rate. Minor wave D may end about the level shown, so that the B-D trend line has a reasonable slope and may have had a test for the low of minute wave x.
Within both a contracting and barrier triangle, minor wave C may not move beyond the end of minor wave A above 14.893.
Within a contracting triangle, minor wave D may not move beyond the end of minor wave B below 13.882.
A barrier triangle here would be very unlikely as the trend lines would look too close to parallel for a normal look.
This wave count would expect choppy overlapping sideways movement for a few more weeks.
Minor wave C subdivides as a double zigzag. Elliott Wave rules state that there may not be more than one complex subdivision within a triangle. Minor waves D and E should subdivide as zigzags in order for this wave count to be valid.
ALTERNATE WAVE COUNT
WEEKLY CHART – BULL WAVE COUNT
Click chart to enlarge.
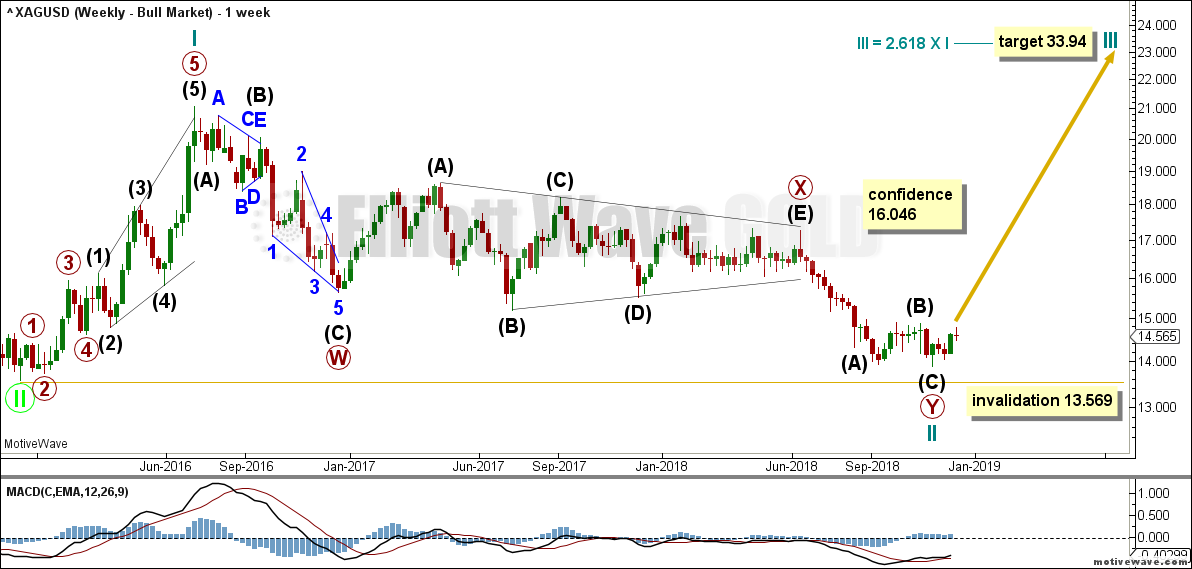
Cycle wave II may be a complete double zigzag. Cycle wave II would be very deep at 0.96 of cycle wave I. This is typical behaviour for the first second wave correction within a new trend for commodities.
The end of primary wave X has been moved. This allows primary wave Y to subdivide as a zigzag and resolves the issues stated in last week’s analysis.
If it continues any further, then cycle wave II may not move beyond the start of cycle wave I below 13.569.
DAILY CHART – BULL WAVE COUNT
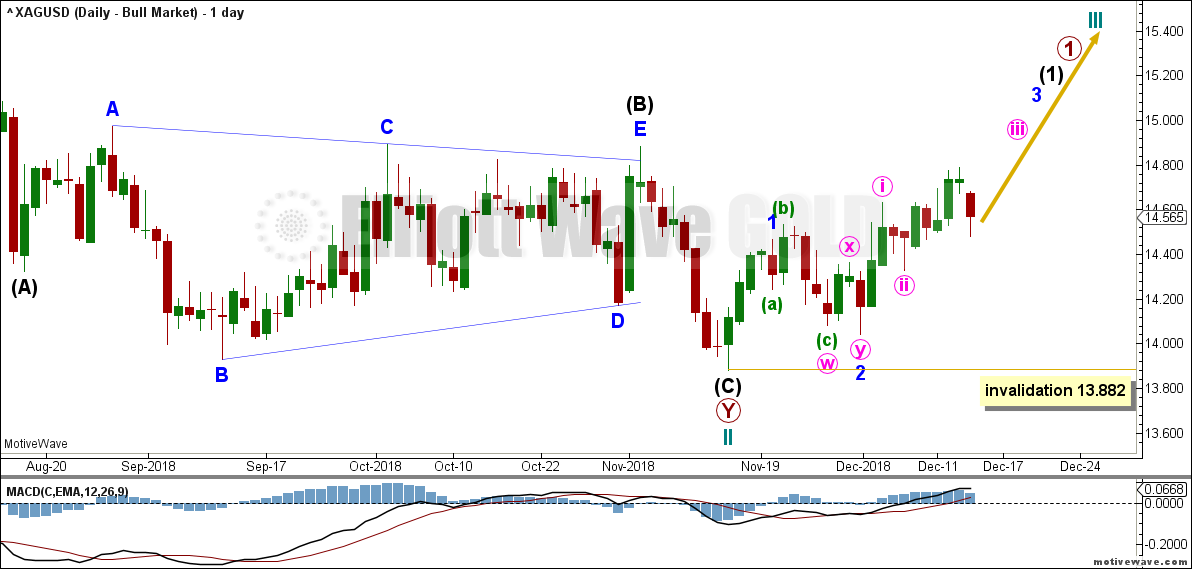
Click chart to enlarge.
If cycle wave II is over, then the new trend up for cycle wave III should begin with a five wave structure.
Cycle wave III may only subdivide as an impulse. So far primary wave 1 would be incomplete.
Within primary wave 1, intermediate wave (1) may be incomplete.
Within intermediate wave (1), minor wave 1 may be complete. Minor wave 2 may be complete as a double combination. If it continues lower then minor wave 2 may not move beyond the start of minor wave 1 below 13.882.
This wave count now expects to see a third wave at two or possibly three degrees to complete. An increase in upwards momentum is expected.
TECHNICAL ANALYSIS
WEEKLY CHART
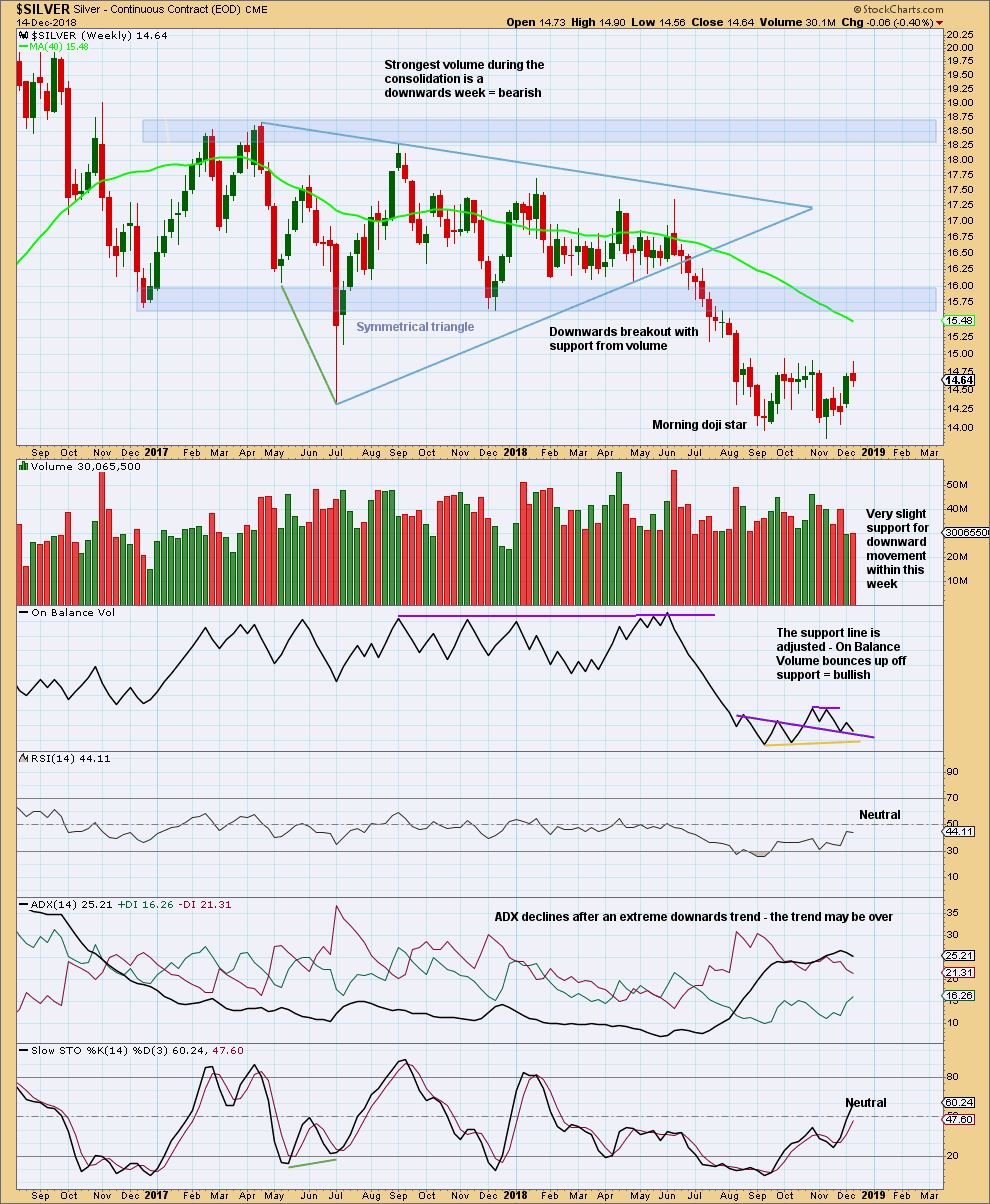
Click chart to enlarge. Chart courtesy of StockCharts.com.
Silver has seen a classic downwards breakout from the shaded support zone, which then provided resistance for a small back test.
A target from the breakout of the symmetrical triangle is about 12.08.
This week sees higher highs and higher lows for price, the basic definition of upwards movement. A red candlestick this week lacks support from volume, which is down from last week.
On Balance Volume is at support. This may assist to halt the fall in price.
DAILY CHART
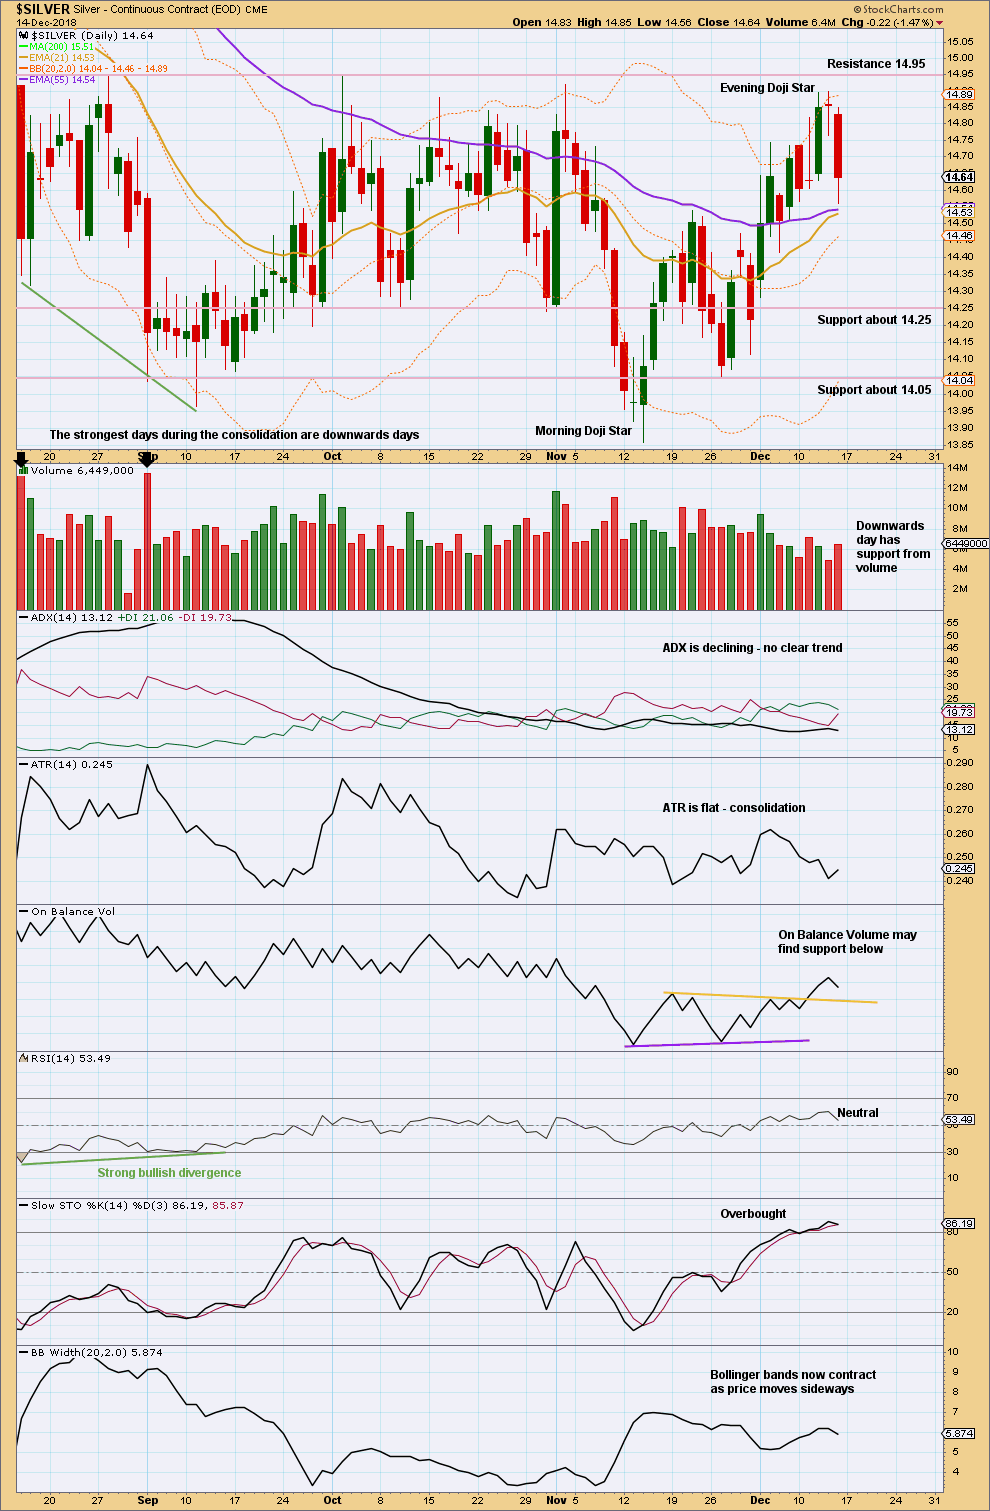
Click chart to enlarge. Chart courtesy of StockCharts.com.
Price is range bound, swinging from support about 14.05 to resistance about 14.95. An Evening Doji Star has occurred, which is a bearish reversal pattern. Friday’s downwards day has support from volume. Price may move lower for the short term, which supports the main Elliott Wave count.
Published @ 03:56 p.m. EST on December 16, 2018.
—
Careful risk management protects your trading account(s).
Follow my two Golden Rules:
1. Always trade with stops.
2. Risk only 1-5% of equity on any one trade.