
A correction for a second wave on the Elliott wave count was expected to have begun. So far this is starting out with some sideways movement, which still fits the overall expectation.
Summary: Intermediate wave (2) may last about 5 to 13 weeks and may be very deep indeed. The first target will be the 0.618 Fibonacci ratio at 66.40, but this may not be high enough.
It is also possible that intermediate wave (2) could be a relatively shallow sideways consolidation. The labelling within it on the daily chart may change as it unfolds. Focus will be on identifying when it could be complete. This week it is only in its early stages; a complete structure cannot yet be seen.
The larger picture still sees Oil in a new downwards trend to end reasonably below 26.06.
New updates to this analysis are in bold.
MAIN ELLIOTT WAVE COUNT
MONTHLY CHART
Click chart to enlarge.
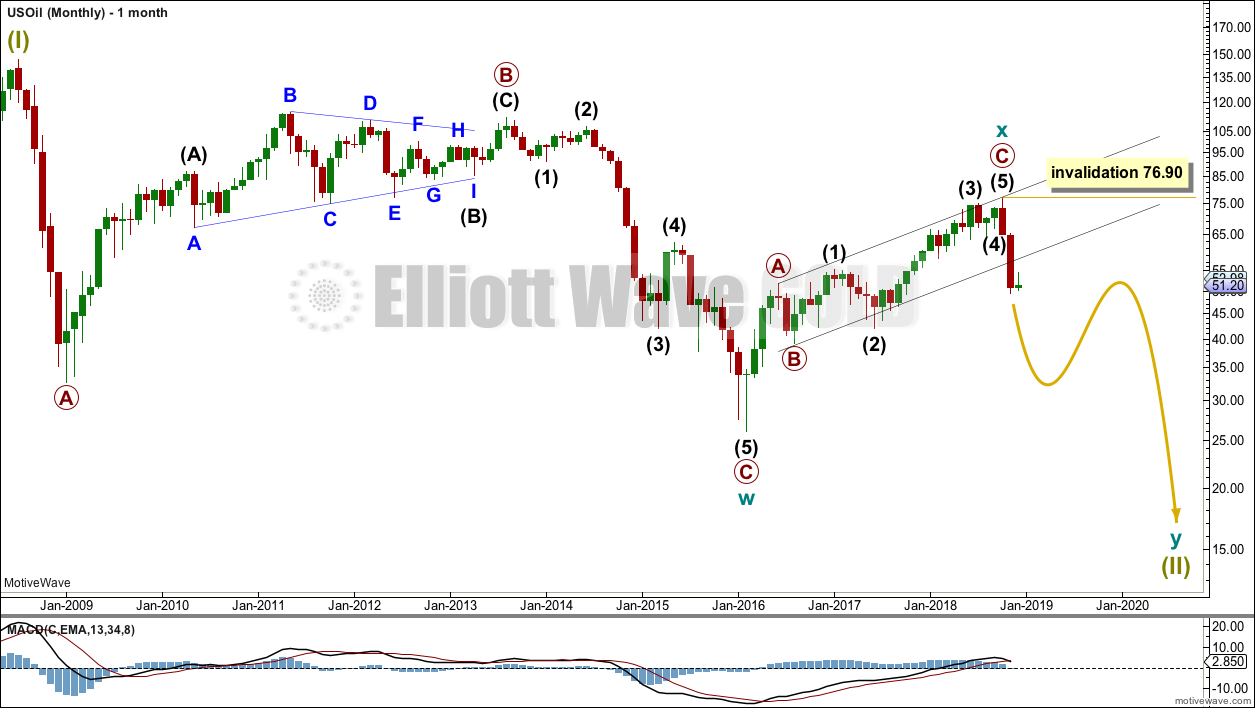
Classic technical analysis favours a bearish wave count for Oil at this time.
The large fall in price from the high in June 2008 to February 2016 is seen as a complete three wave structure. This large zigzag may have been only the first zigzag in a deeper double zigzag.
The first zigzag down is labelled cycle wave w. The double is joined by a now complete three in the opposite direction, a zigzag labelled cycle wave x.
The purpose of a second zigzag in a double is to deepen the correction when the first zigzag does not move price deep enough. Cycle wave y would be expected to move reasonably below the end of cycle wave w to deepen the correction. Were cycle wave y to reach equality with cycle wave w that takes Oil into negative price territory, which is not possible. Cycle wave y would reach 0.618 the length of cycle wave w at $2.33.
A better target calculation would be using the Fibonacci ratios between primary waves A and C within cycle wave y. This cannot be done until both primary waves A and B are complete.
Within cycle wave y, no second wave correction nor B wave may move beyond its start above 76.90.
WEEKLY CHART
Click chart to enlarge.
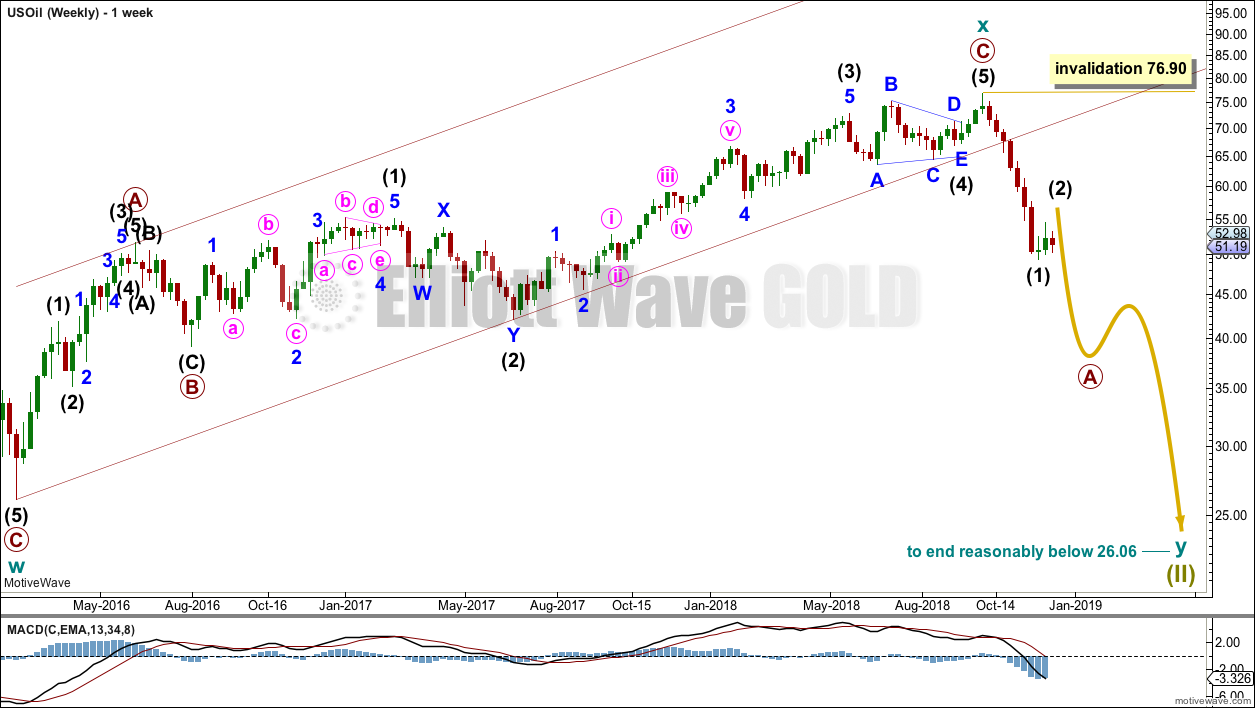
Cycle wave x is seen as a complete zigzag. Within the zigzag, primary wave C is a five wave impulse and within it intermediate wave 4 is a triangle.
A new low below 51.67 has added confidence in this bearish wave count. At that stage, the bullish alternate was invalidated.
Cycle wave y is expected to subdivide as a zigzag. A zigzag subdivides 5-3-5. Primary wave A must subdivide as a five wave structure if this wave count is correct.
Within primary wave A, intermediate wave (1) may now be complete. Intermediate wave (2) may be very deep, or it could be a sideways consolidation.
DAILY CHART
Click chart to enlarge.
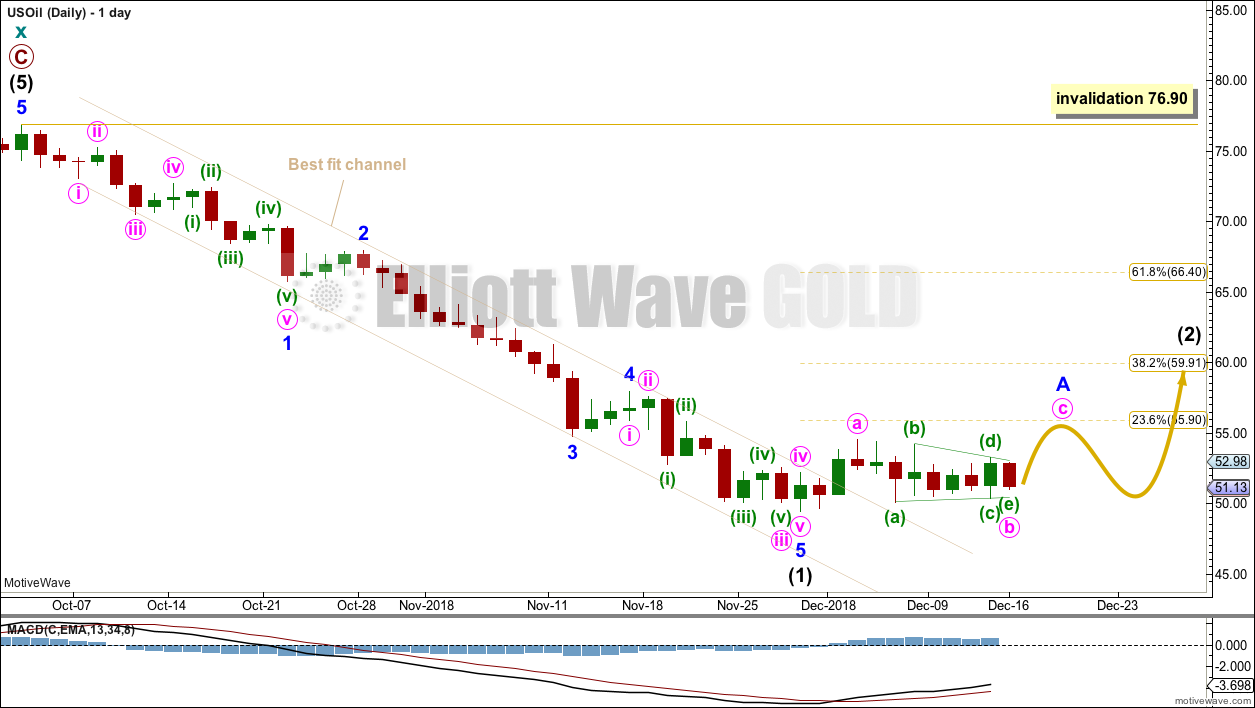
The narrow best fit channel about intermediate wave (1) was clearly breached on the 4th of December. At that stage, this analysis expected that intermediate wave (1) should be over and intermediate wave (2) should be underway.
Intermediate wave (2) may subdivide as any corrective structure except a triangle. It would most likely be a zigzag (zigzags are the most common corrective structures). It is impossible to tell which structure it may be at the start, and as it unfolds labelling within it will change.
Intermediate wave (1) lasted 7 weeks. Intermediate wave (2) may be expected to have reasonable proportion to intermediate wave (1), so that the wave count has the right look. Intermediate wave (2) may last a Fibonacci 5, 8 or even 13 weeks if it is a more time consuming correction like a combination.
Intermediate wave (2) may not move beyond the start of intermediate wave (1) above 76.90.
For Oil the first large second wave correction within a new trend can be extremely deep. This does not always happen, but it is a fairly common tendency; we should be aware of this possibility here.
It is also possible that intermediate wave (2) may not be deep; it could also be a shallow sideways consolidation. At this stage, it is incomplete, and it is still impossible to tell with any confidence what structure it may be.
TECHNICAL ANALYSIS
MONTHLY CHART
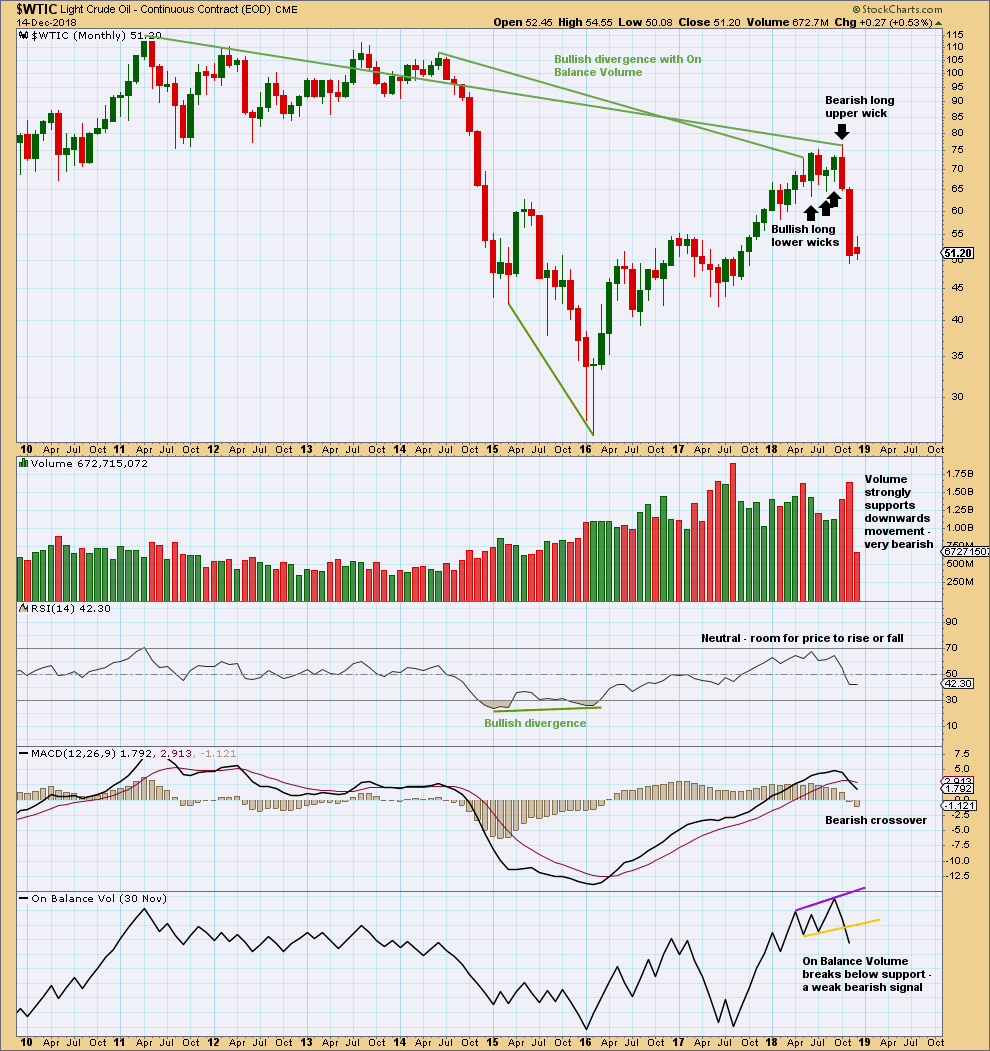
Click chart to enlarge. Chart courtesy of StockCharts.com.
The month of November has a very small lower wick. This is still fairly bearish.
The signal from On Balance Volume is weak because the trend line breached had only two anchor points and a reasonable slope. But it is still a bearish signal.
WEEKLY CHART
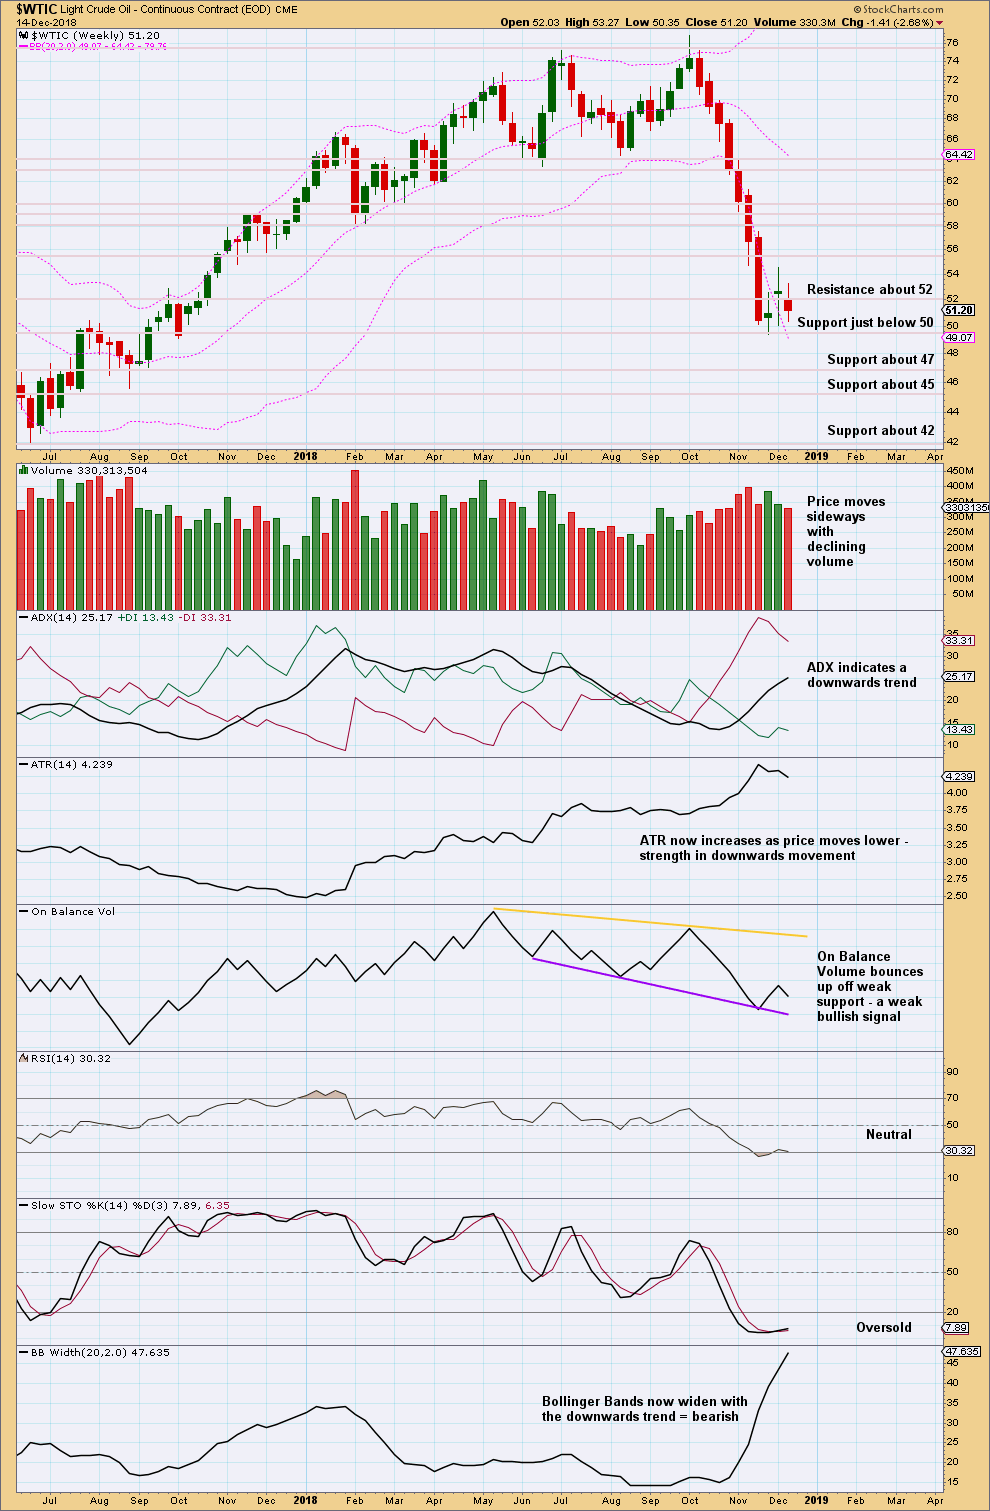
Click chart to enlarge. Chart courtesy of StockCharts.com.
The last three weekly candlesticks look like a consolidation within an ongoing downwards trend.
DAILY CHART
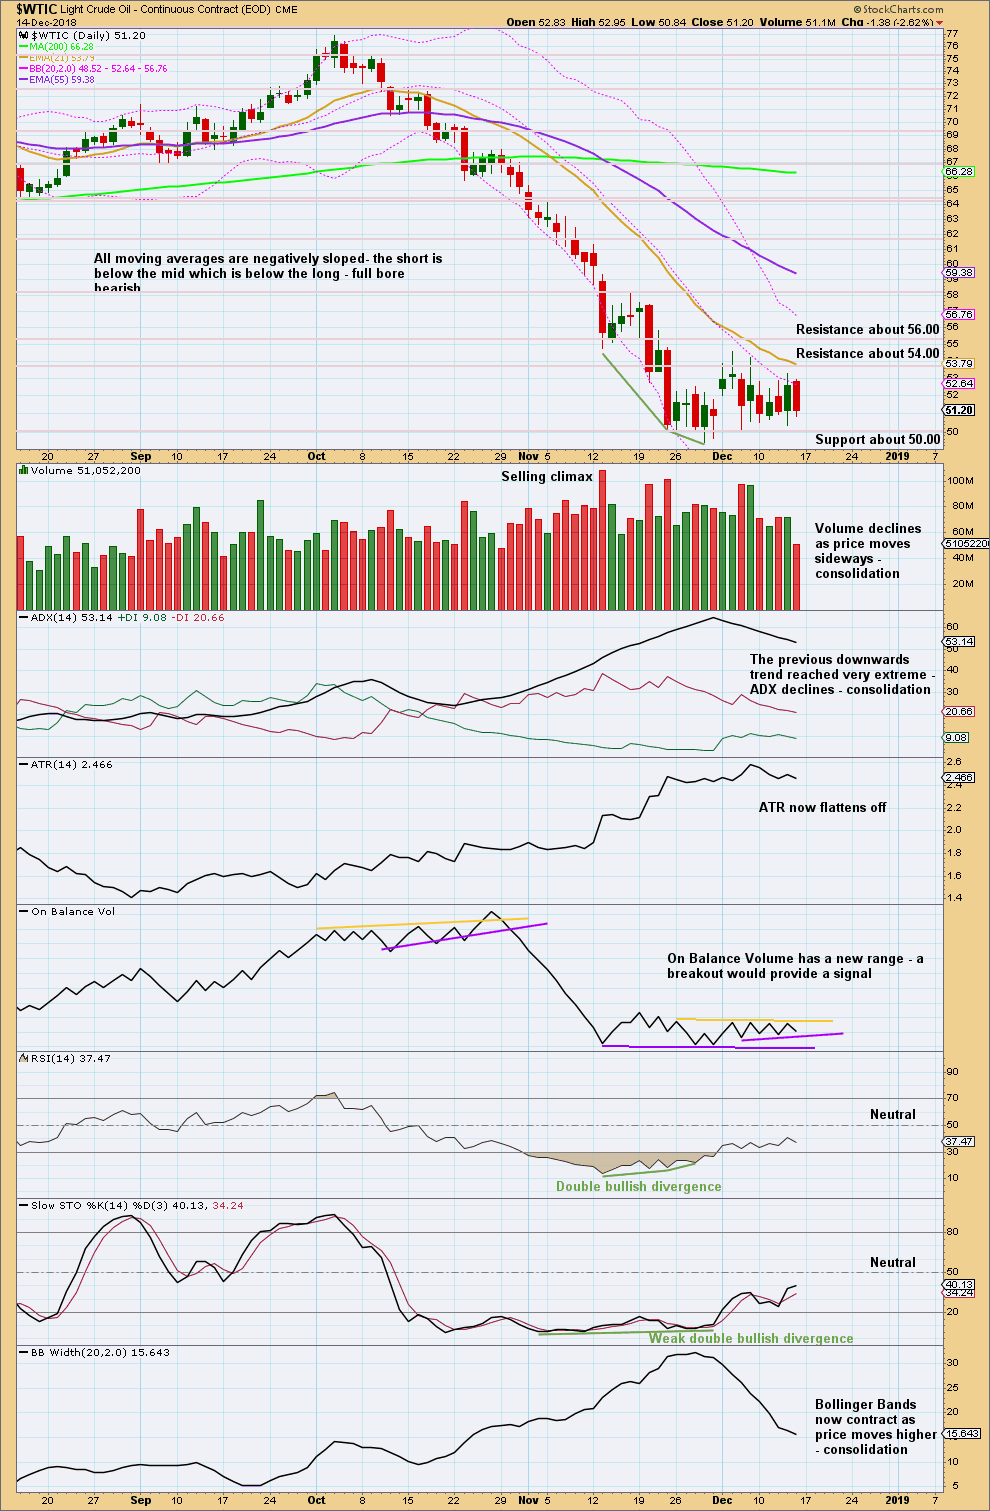
Click chart to enlarge. Chart courtesy of StockCharts.com.
This consolidation may have only just begun. At this stage, resistance may be about 56 and support about 50.
Published @ 08:22 p.m. EST.
—
Careful risk management protects your trading account(s).
Follow my two Golden Rules:
1. Always trade with stops.
2. Risk only 1-5% of equity on any one trade.
Update for US Oil:
Despite the channel breach, price has turned and moved lower. This last session is now closed and volume data shows it has good support.
This trend remains very extreme, bullish divergence between price and RSI remains. It will end and there will be a multi week bounce, but not quite yet.
A new target is calculated.
However, the best way to use this chart is with the channel. Assume the downwards trend remains intact, until the channel is breached by upwards (not sideways) movement. Be alert to a multi week bounce, but only have confidence it’s begun when the channel is breached.
This channel is not quite as steep as the last one, it’s longer held and so has slightly better technical significance.
Thank you for the update Lara, much appreciated.