
An intra-week update gave a new target for more downwards movement. Price has continued to move lower towards the target.
Summary: Intermediate wave (1) has proven to be incomplete. The new target for it to end at is 42.10.
Use the best fit channel on the daily chart. Assume more downwards movement to the target while price remains within this channel. A breach of this channel would indicate the possible end to this first wave down and the beginning of a multi-week bounce or sideways consolidation.
The other thing to look for next week is a bullish candlestick reversal pattern on the daily chart.
This trend is now very extreme and exhibits a beginning weakness. It can continue lower however for a reasonable time. Be aware a low is approaching, but not here yet.
The larger picture still sees Oil in a new downwards trend to end reasonably below 26.06.
New updates to this analysis are in bold.
MAIN ELLIOTT WAVE COUNT
MONTHLY CHART

Click chart to enlarge.
Classic technical analysis favours a bearish wave count for Oil at this time.
The large fall in price from the high in June 2008 to February 2016 is seen as a complete three wave structure. This large zigzag may have been only the first zigzag in a deeper double zigzag.
The first zigzag down is labelled cycle wave w. The double is joined by a now complete three in the opposite direction, a zigzag labelled cycle wave x.
The purpose of a second zigzag in a double is to deepen the correction when the first zigzag does not move price deep enough. Cycle wave y would be expected to move reasonably below the end of cycle wave w to deepen the correction. Were cycle wave y to reach equality with cycle wave w that takes Oil into negative price territory, which is not possible. Cycle wave y would reach 0.618 the length of cycle wave w at $2.33.
A better target calculation would be using the Fibonacci ratios between primary waves A and C within cycle wave y. This cannot be done until both primary waves A and B are complete.
Within cycle wave y, no second wave correction nor B wave may move beyond its start above 76.90.
WEEKLY CHART
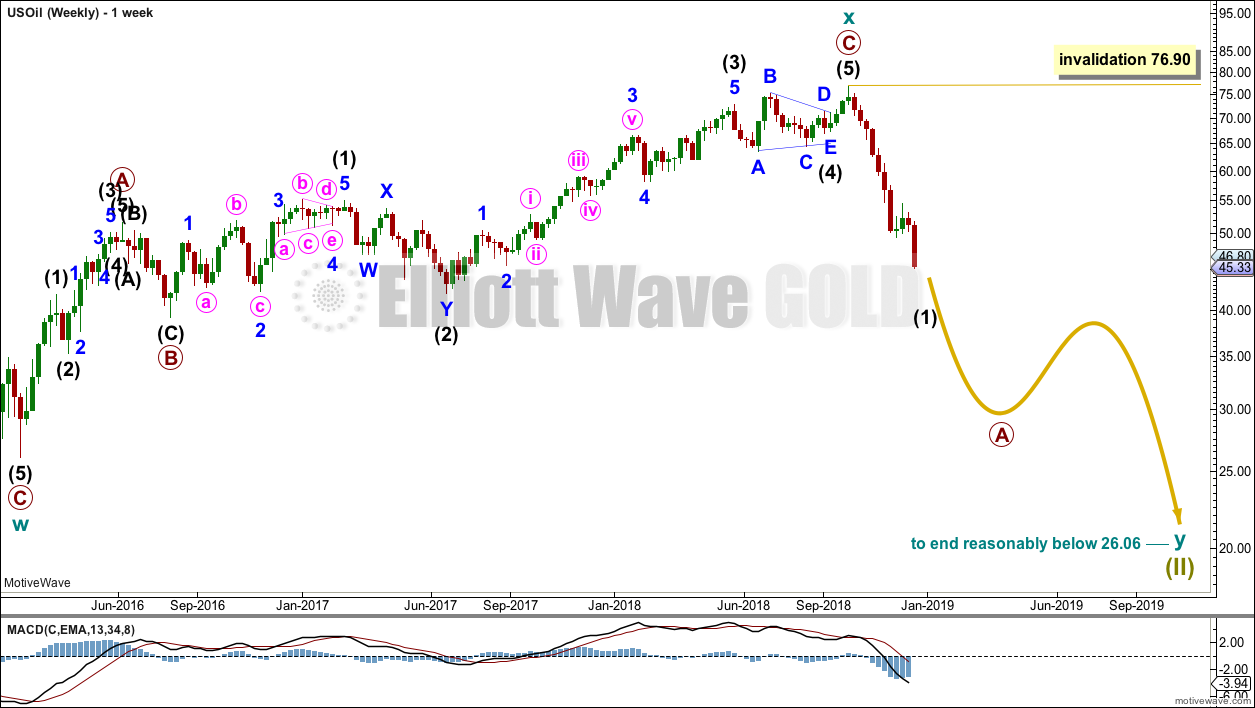
Click chart to enlarge.
Cycle wave x is seen as a complete zigzag. Within the zigzag, primary wave C is a five wave impulse and within it intermediate wave 4 is a triangle.
A new low below 51.67 has added confidence in this bearish wave count. At that stage, the bullish alternate was invalidated.
Cycle wave y is expected to subdivide as a zigzag. A zigzag subdivides 5-3-5. Primary wave A must subdivide as a five wave structure if this wave count is correct.
Within primary wave A, intermediate wave (1) may be nearing its end but does not look complete at this stage. When intermediate wave (1) is complete, then intermediate wave (2) may unfold over a few weeks as a sideways choppy consolidation, or a deep sharp bounce.
DAILY CHART
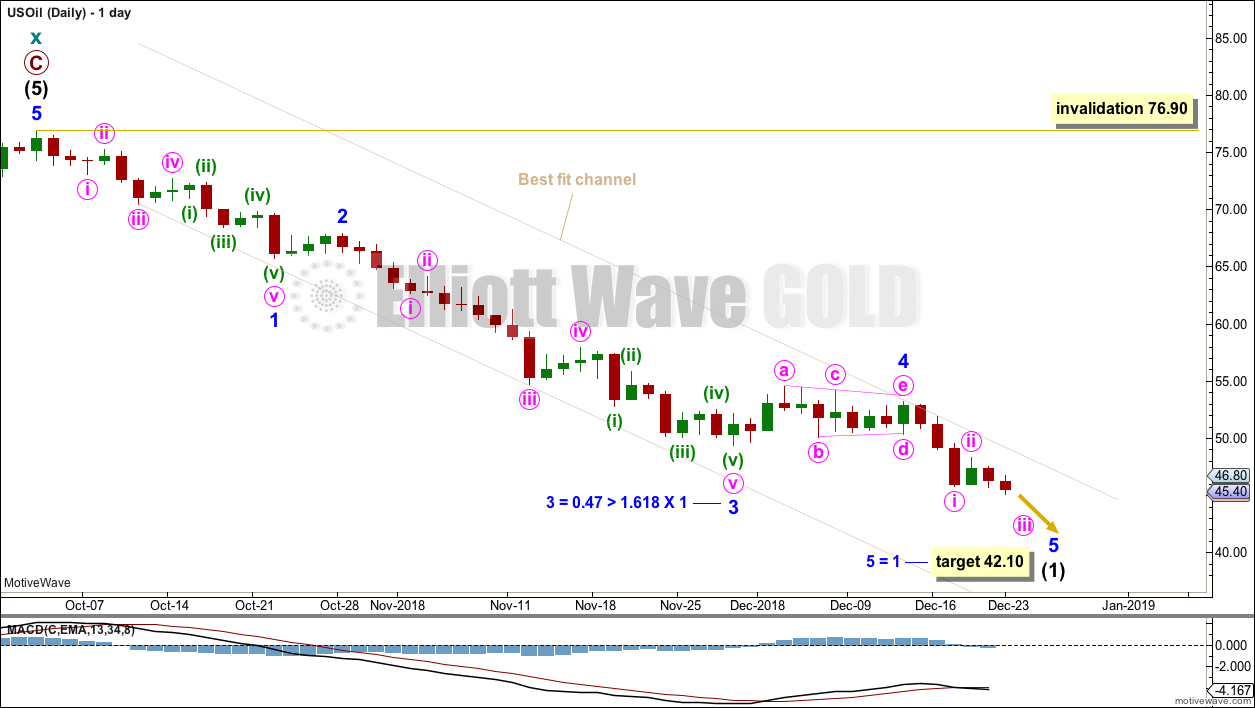
Click chart to enlarge.
Despite a breach of the narrow channel on last week’s daily chart, price has continued lower this week. The channel is redrawn.
This wave count is supported by MACD. The strongest momentum is the end of the third wave.
Minor wave 5 may exhibit an increase in momentum for a selling climax (behaviour typical of commodities). However, while fifth waves within commodities can be strong, they are not always so. This is a tendency to be aware of, not a certainty.
When the channel is breached by upwards movement, that may be an early indication that intermediate wave (1) may again be complete and intermediate wave (2) may then have begun.
Intermediate wave (2) may be very deep. It should last at least four weeks, so that it shows up on the monthly chart.
Intermediate wave (2) may not move beyond the start of intermediate wave (1) above 76.90.
TECHNICAL ANALYSIS
MONTHLY CHART
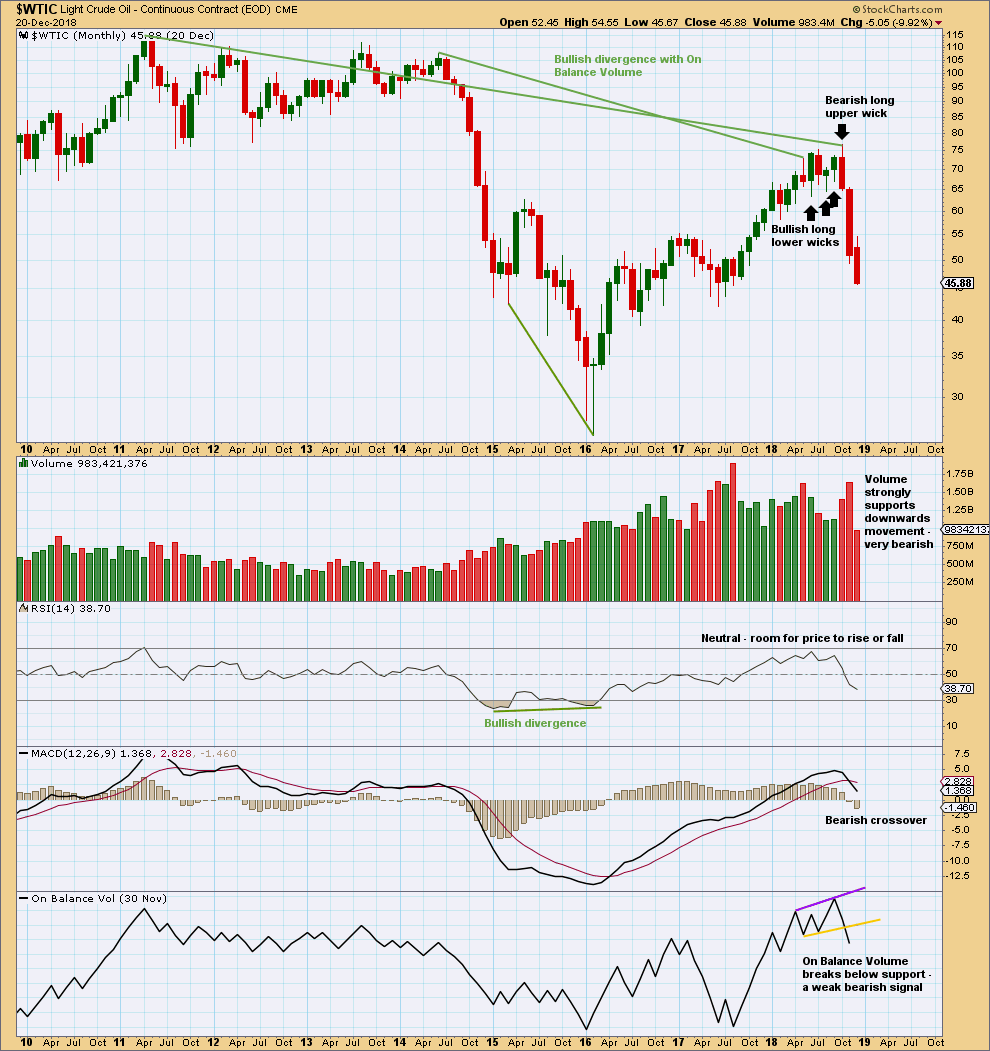
Click chart to enlarge. Chart courtesy of StockCharts.com.
The month of November has a very small lower wick. This is still fairly bearish.
The signal from On Balance Volume is weak because the trend line breached had only two anchor points and a reasonable slope. But it is still a bearish signal.
WEEKLY CHART
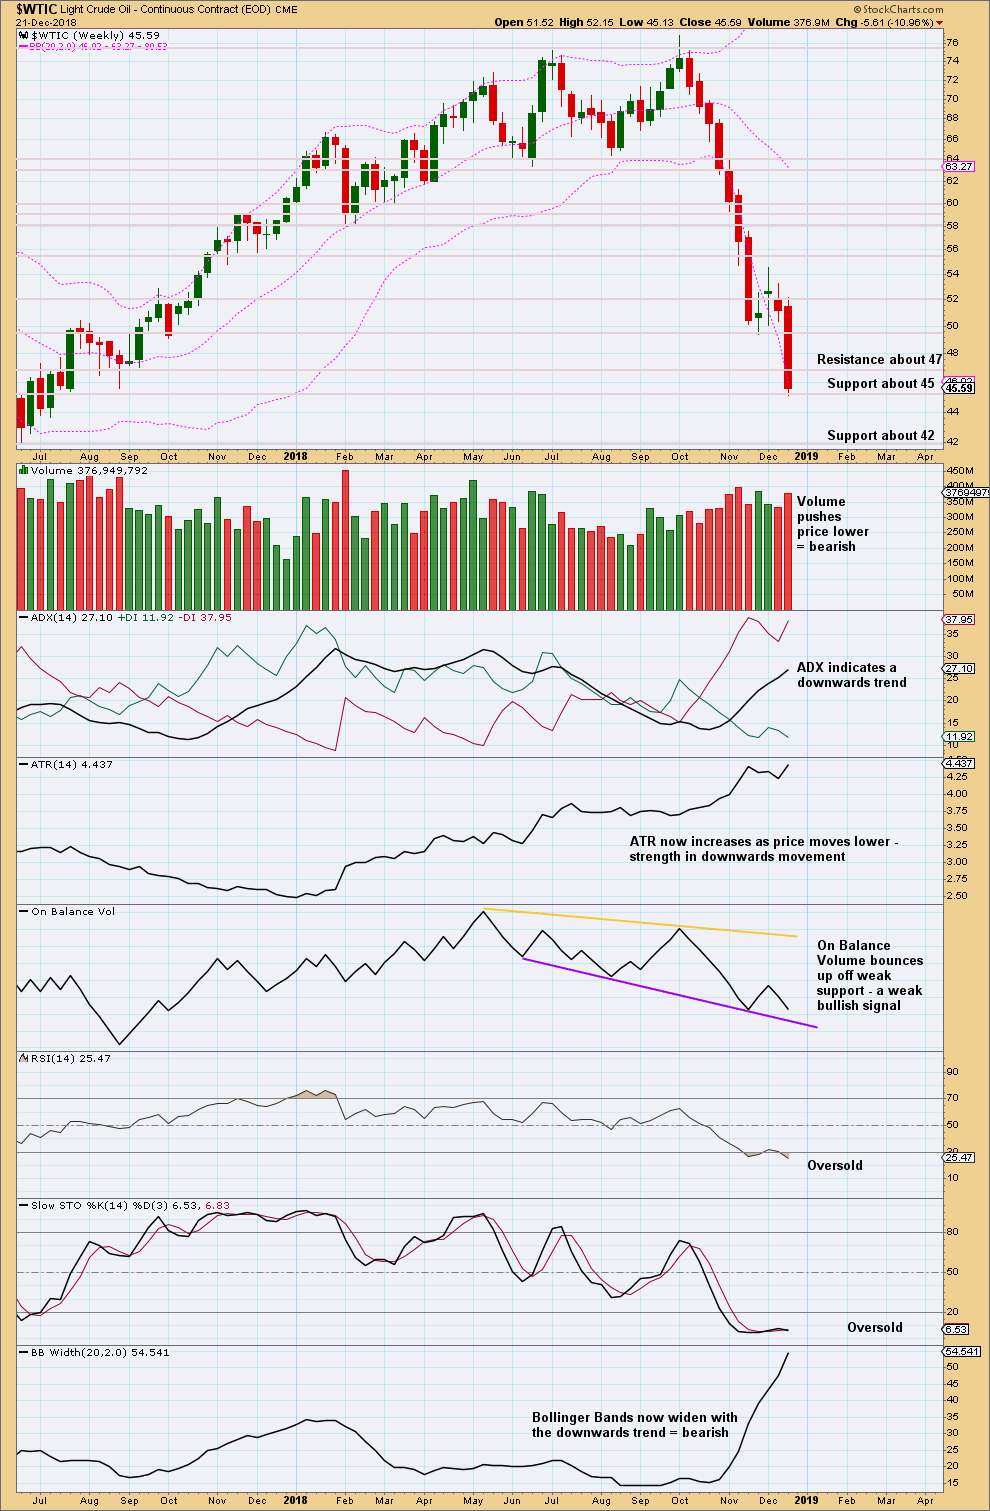
Click chart to enlarge. Chart courtesy of StockCharts.com.
This chart supports the Elliott wave count. Oil is within a bearish trend. The trend is not yet extreme.
There is no candlestick reversal pattern and no bullish divergence between price and RSI.
There is room here for price to keep falling.
DAILY CHART
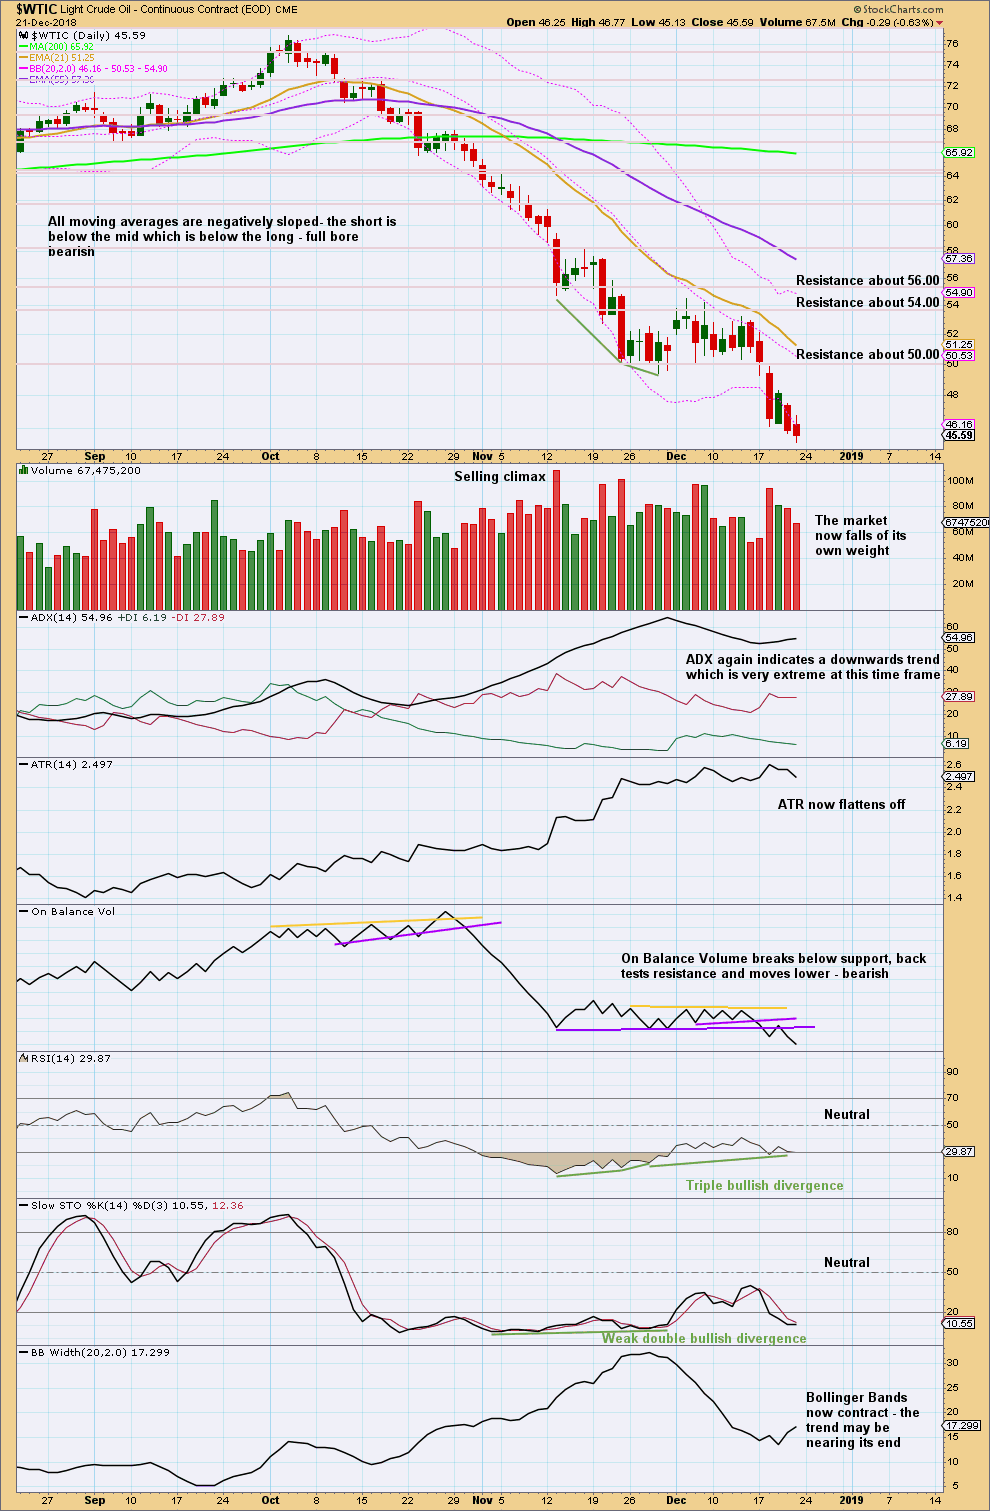
Click chart to enlarge. Chart courtesy of StockCharts.com.
The trend continues and at this time frame is very extreme. Strong and persistent bullish divergence between price and RSI indicates a low may be approaching.
Flattening ATR indicates the trend may be becoming tired.
Look for a bullish candlestick reversal pattern and / or a breach of the trend channel on the daily Elliott wave chart to indicate this trend may be over for the mid term.
Published @ 06:54 p.m. EST.
—
Careful risk management protects your trading account(s).
Follow my two Golden Rules:
1. Always trade with stops.
2. Risk only 1-5% of equity on any one trade.
It looks like US Oil has found a low for the short to intermediate term. The candlestick for the 26th is very bullish and has strong support from volume. It’s not properly a Bullish Engulfing pattern because the open is above the close of the prior session, but the close of the 26th is very bullish.
The target for intermediate (2) is the 0.618 Fibonacci ratio of intermediate (1) at 63.70
Hi Lara,
I hope you had a Merry Christmas! thank you for continuing to publish through the holidays. Could you comment on xop, the oil and exploration index. It had a very extreme reversal today above your invalidation point on your prior wave count. Do you expect xop to retest the break away gap at 38ish? Or is that too much to expect given a more bearish wave count in oil? Any insight would be much appreciated.
I don’t have a wave count for XOP.
It could retest that breakaway gap. The downwards trend reached very extreme, RSI reached deeply into oversold. I’d be expecting a sizeable time consuming consolidation or sharp bounce here to relieve extreme conditions.
Resistance lines above noted on the chart.
Lora,
Thanks for all the valuable info. A suggestion to the chart. Most of laptop/desktop today has wide screen (16:9). When clicking on the chart, it actually shows smaller in popup window than the original since it tries to fit in the whole long chart (see attachment). I think this defeats the purpose of zoom in. It is very inconvenient to always Ctrl+ to enlarge the screen manually everytime. Could you please do a survey between users and change this design accordingly?
Thanks for the consideration to make the usability better.
I know, it’s a pain. You’ll notice when I record the video I close the pop up window and then resize my screen.
It’s a StockCharts issue. When you add more indicators to a StockCharts chart they add onto the bottom (or top, you can choose), but what it does not do is squash up the price chart to fit more indicators on, it keeps price the same. The more indicators added, the longer and narrower the chart is.
There is a landscape option on StockCharts, but I’m attaching an example of that with my S&P technical analysis chart here. I can’t work with that, it squashes everything up too much.
Cesar says there is an option. We can disable the lightbox option for the technical analysis charts and have them open in a new tab. That might be better. What do you think of that idea?
That will likely be a better option for PC and Mac viewing. On a tablet or phone it is not an issue as you can just use your fingers to enlarge and zoom.
Thanks Lora for the consideration. I think either opening in a new tab or using a scrollable poping up window like we had years ago, is satisfying. See attachment.