
Last end of week analysis for US Oil expected more downwards movement towards a target at 42.10. Downwards movement continued to 42.37, just 0.27 short of the Elliott wave target.
Summary: A bounce or sideways consolidation for a few weeks is now expected. The target is about 63.71.
A breach of the best fit channel on the daily chart would add confidence to this view.
The larger picture still sees Oil in a new downwards trend to end reasonably below 26.06.
New updates to this analysis are in bold.
MAIN ELLIOTT WAVE COUNT
MONTHLY CHART
Click chart to enlarge.
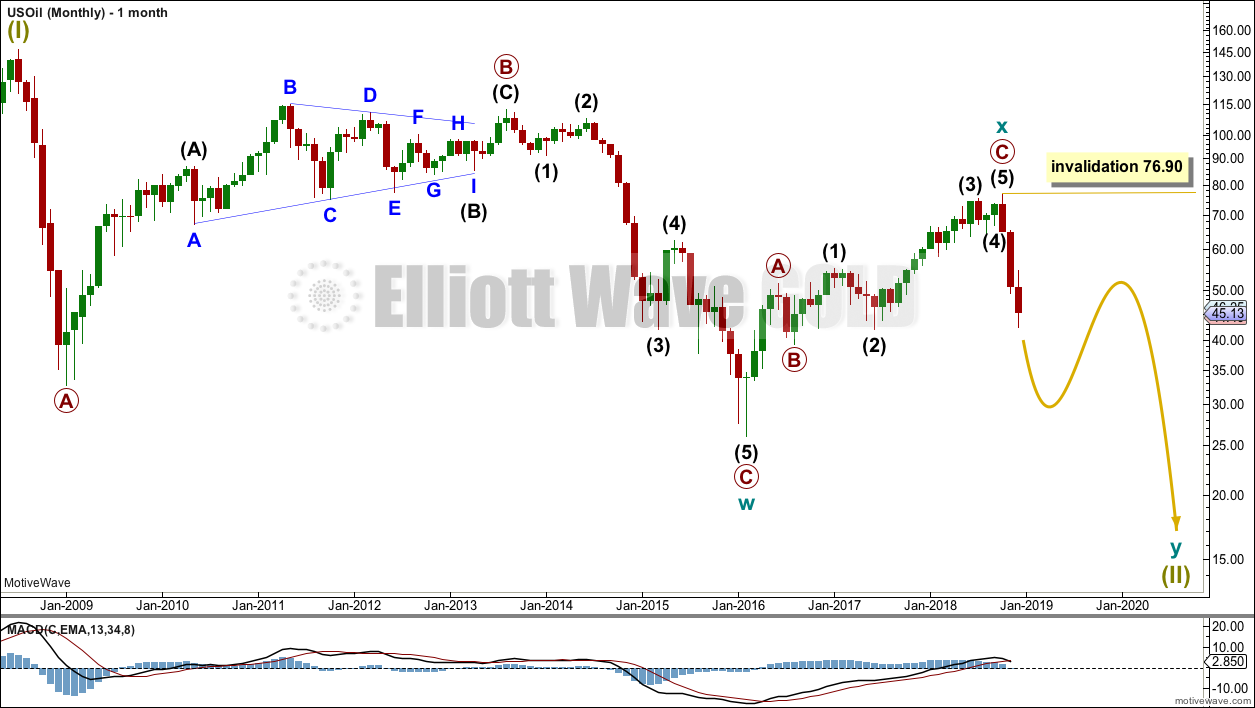
Classic technical analysis favours a bearish wave count for Oil at this time.
The large fall in price from the high in June 2008 to February 2016 is seen as a complete three wave structure. This large zigzag may have been only the first zigzag in a deeper double zigzag.
The first zigzag down is labelled cycle wave w. The double is joined by a now complete three in the opposite direction, a zigzag labelled cycle wave x.
The purpose of a second zigzag in a double is to deepen the correction when the first zigzag does not move price deep enough. Cycle wave y would be expected to move reasonably below the end of cycle wave w to deepen the correction. Were cycle wave y to reach equality with cycle wave w that takes Oil into negative price territory, which is not possible. Cycle wave y would reach 0.618 the length of cycle wave w at $2.33.
A better target calculation would be using the Fibonacci ratios between primary waves A and C within cycle wave y. This cannot be done until both primary waves A and B are complete.
Within cycle wave y, no second wave correction nor B wave may move beyond its start above 76.90.
WEEKLY CHART
Click chart to enlarge.
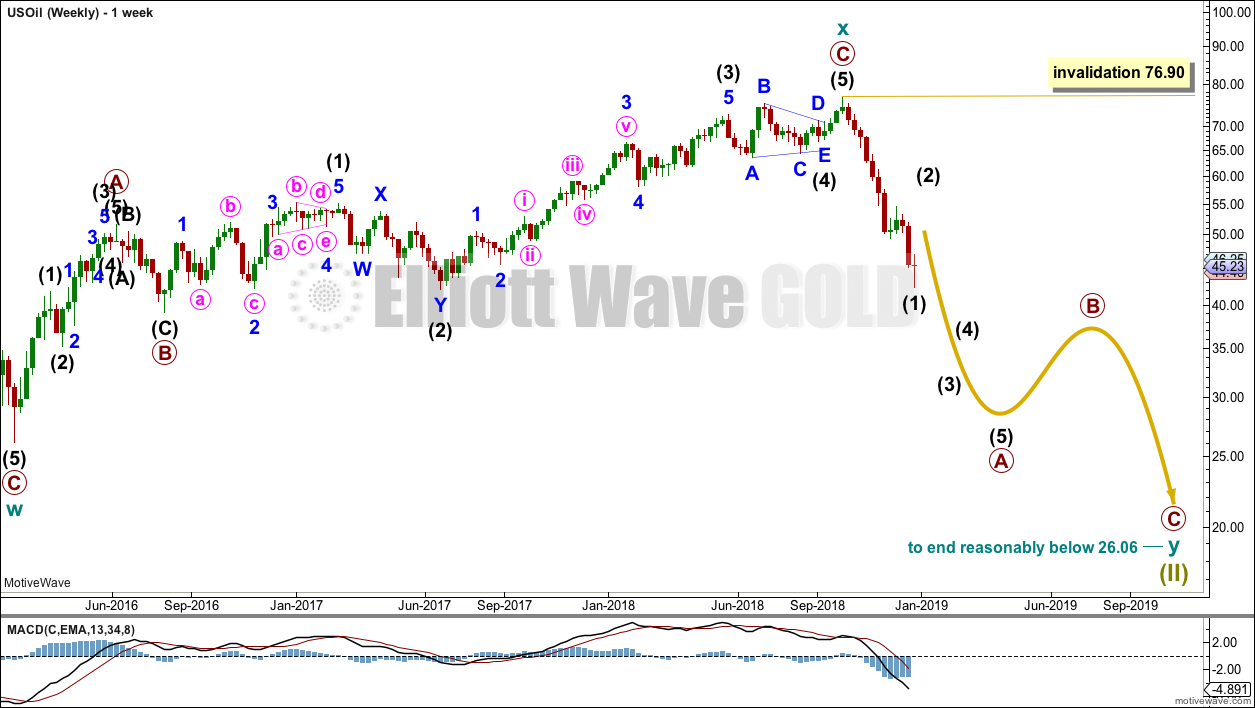
Cycle wave x is seen as a complete zigzag. Within the zigzag, primary wave C is a five wave impulse and within it intermediate wave 4 is a triangle.
A new low below 51.67 has added confidence in this bearish wave count. At that stage, the bullish alternate was invalidated.
Cycle wave y is expected to subdivide as a zigzag. A zigzag subdivides 5-3-5. Primary wave A must subdivide as a five wave structure if this wave count is correct.
Within primary wave A, intermediate wave (1) may now be complete. Intermediate wave (2) may unfold over a few weeks as a sideways choppy consolidation, or a deep sharp bounce.
DAILY CHART
Click chart to enlarge.
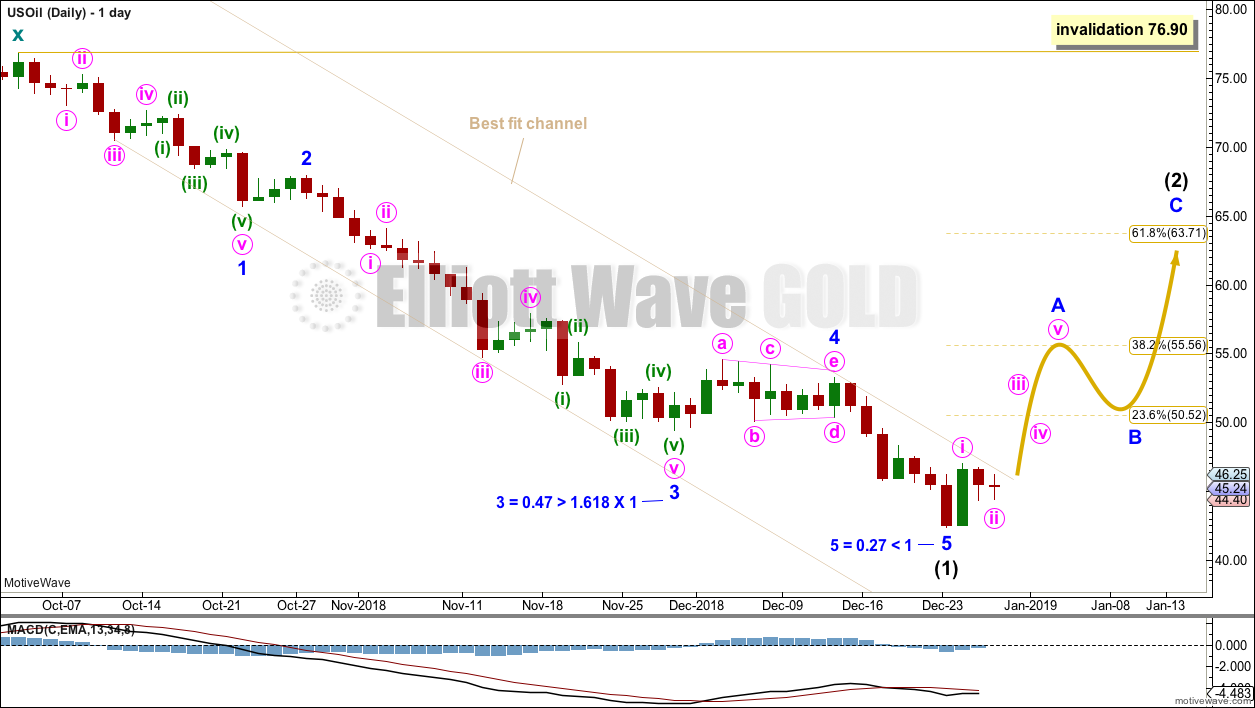
A strong candlestick reversal pattern, a Bullish Engulfing candlestick for the 26th of December, indicates a low may now be in place.
The best fit channel is not yet breached. If it is breached early next week, that shall provide further confidence that a low is in place. The risk that the wave count is wrong and intermediate wave (1) may continue lower will remain reasonable while price remains within this channel.
Intermediate wave (2) may be very deep. It should last at least four weeks, so that it shows up on the monthly chart.
Intermediate wave (2) may not move beyond the start of intermediate wave (1) above 76.90.
TECHNICAL ANALYSIS
MONTHLY CHART
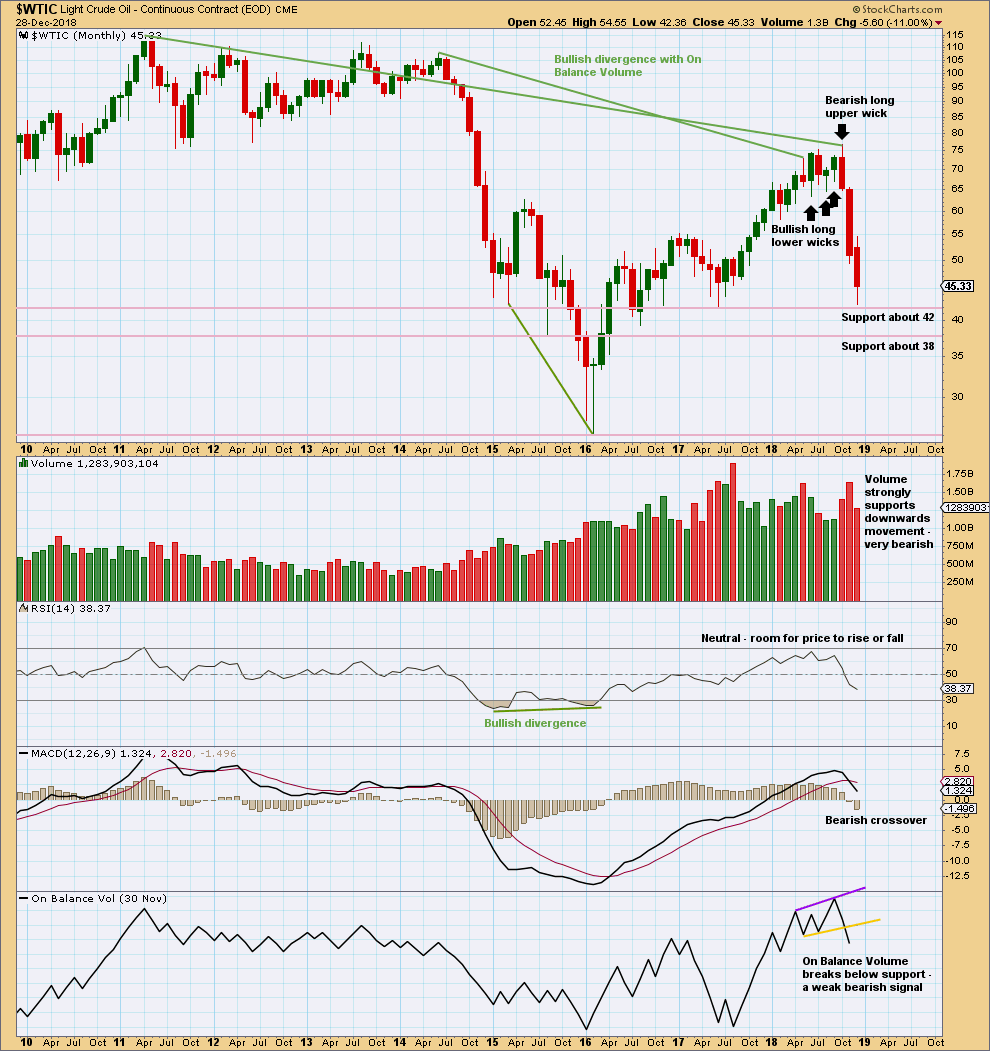
Click chart to enlarge. Chart courtesy of StockCharts.com.
The month of November has a very small lower wick. This is still fairly bearish.
The signal from On Balance Volume is weak because the trend line breached had only two anchor points and a reasonable slope. But it is still a bearish signal.
WEEKLY CHART
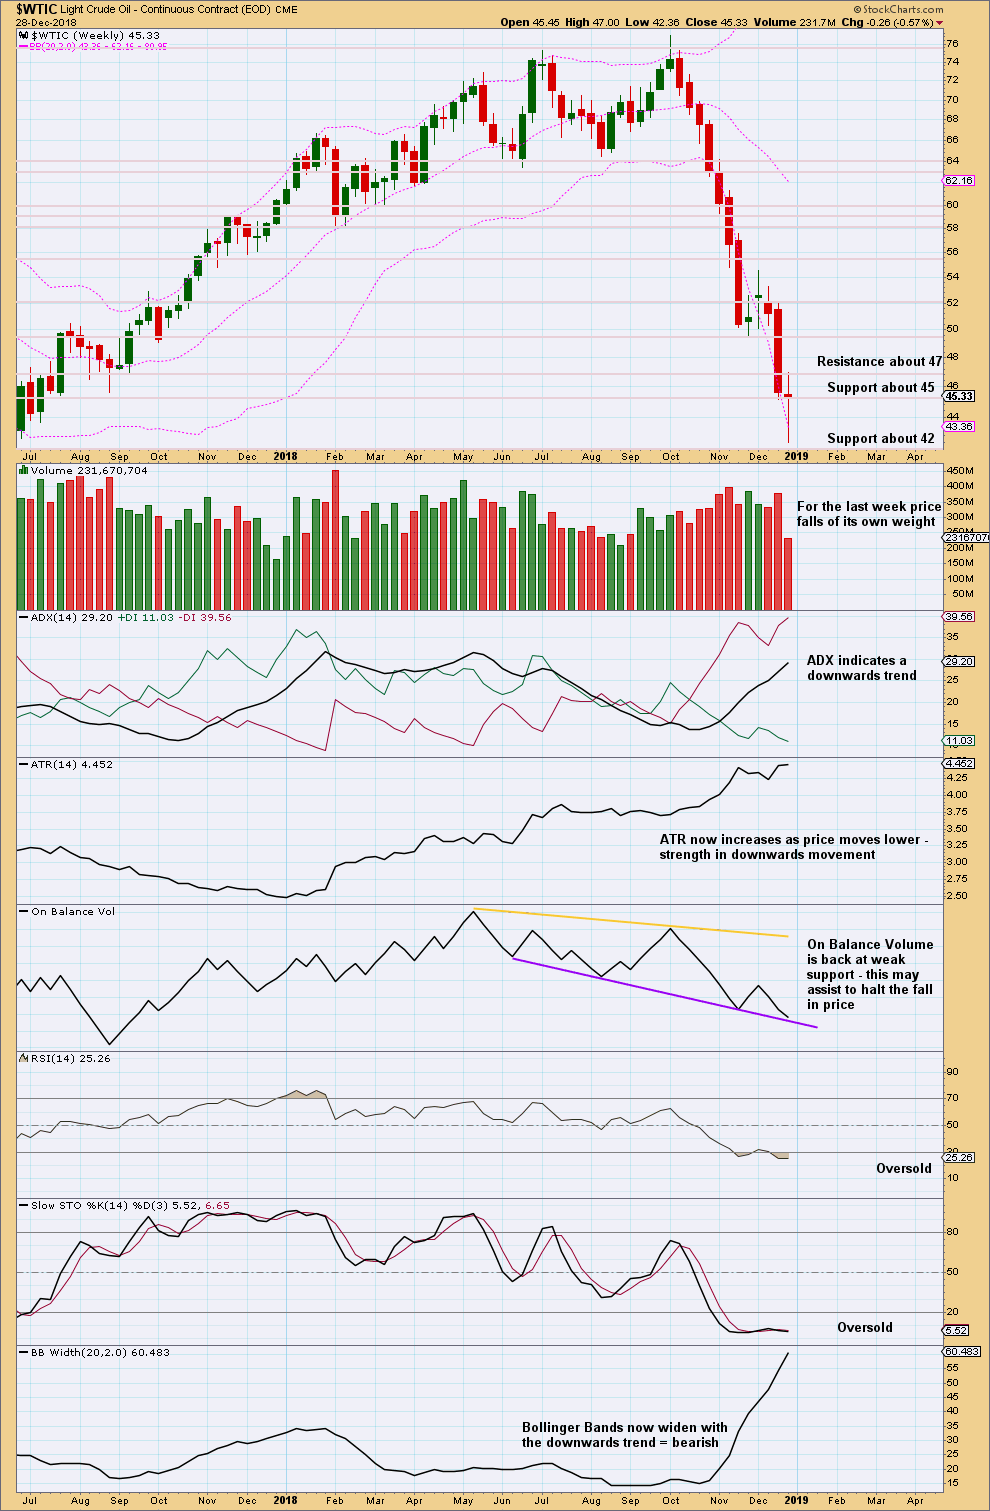
Click chart to enlarge. Chart courtesy of StockCharts.com.
The doji weekly candlestick indicates a balance of bulls and bears. This is a warning of a possible low in place, but it is not on its own a reversal pattern.
The doji candlestick, declining volume and On Balance Volume at support give a warning that a low may be in place.
DAILY CHART
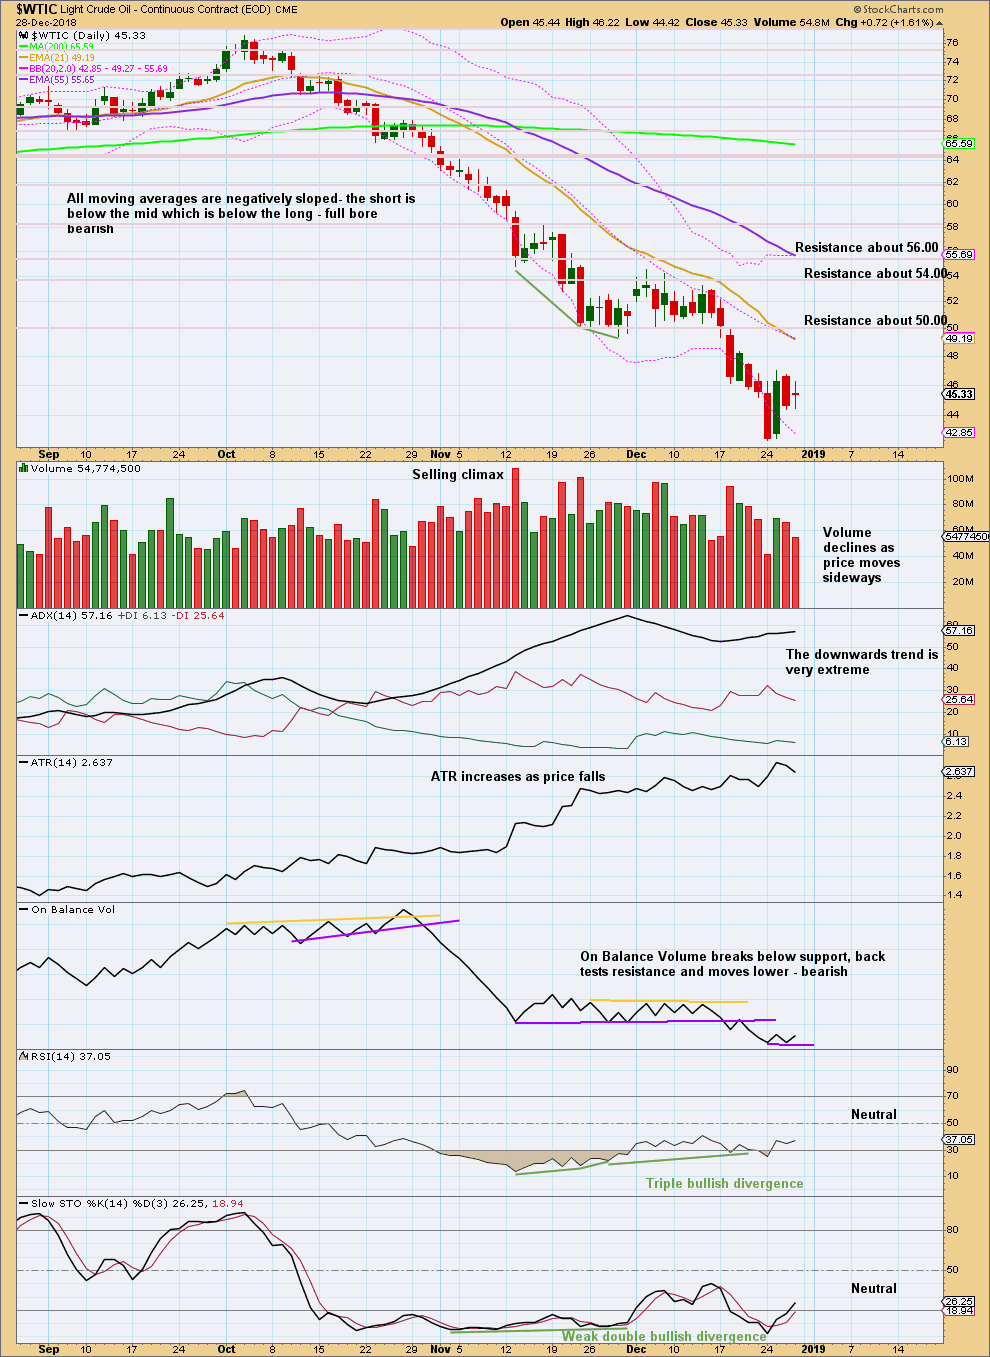
Click chart to enlarge. Chart courtesy of StockCharts.com.
The strong bullish candlestick of the 26th of December is not properly a Bullish Engulfing pattern on StockCharts data because the open is above the close of the prior session. The close of the 26th of December is very bullish though, and it has support from volume.
Published @ 08:45 p.m. EST.
—
Careful risk management protects your trading account(s).
Follow my two Golden Rules:
1. Always trade with stops.
2. Risk only 1-5% of equity on any one trade.
Oil finally broke the neckline of the inverted H & S pattern to start Minute 3 up per Lara’s count! Patience pays for the longs 😲