
Members were advised in last analysis to expect a low in place when the channel on the daily chart was breached. This happened on the 4th of December.
Summary: A breach of the narrow channel on the daily chart in last analysis indicated an end to intermediate wave (1) and the start of intermediate wave (2). This correction may last about 5 to 13 weeks and may be very deep indeed. The first target will be the 0.618 Fibonacci ratio at 66.40, but this may not be high enough.
The larger picture still sees Oil in a new downwards trend to end reasonably below 26.06.
New updates to this analysis are in bold.
MAIN ELLIOTT WAVE COUNT
MONTHLY CHART
Click chart to enlarge.
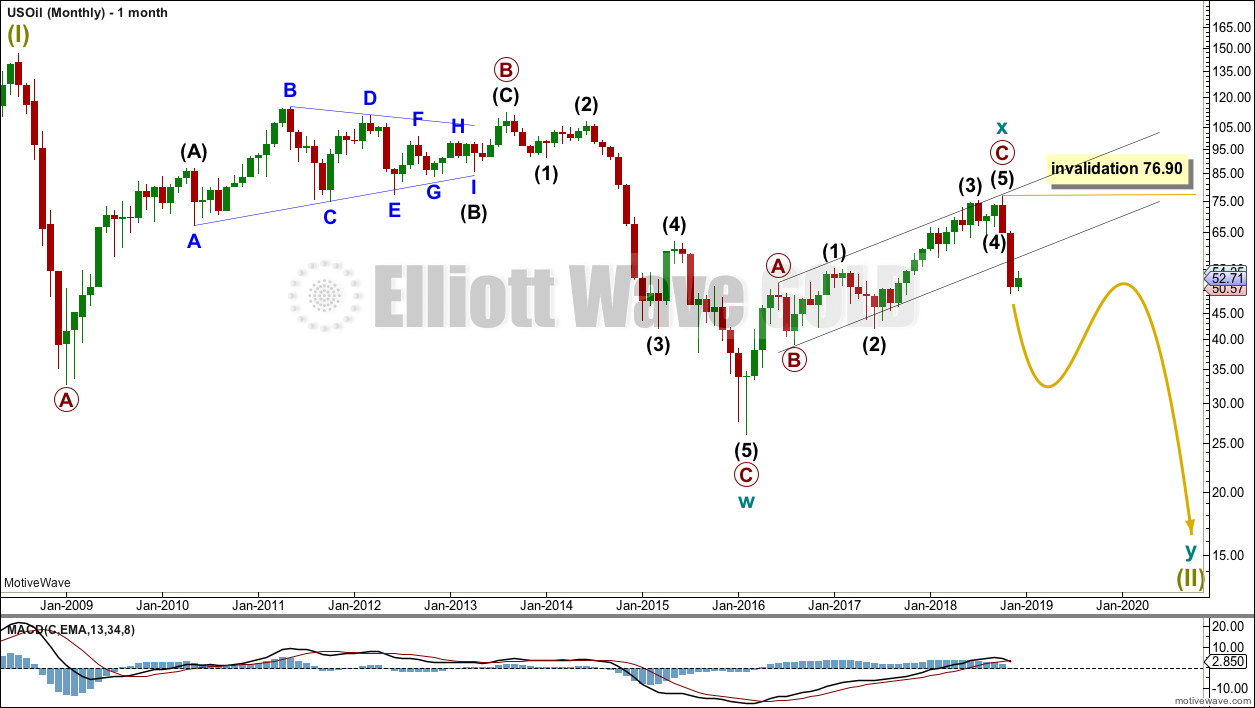
Classic technical analysis favours a bearish wave count for Oil at this time.
The large fall in price from the high in June 2008 to February 2016 is seen as a complete three wave structure. This large zigzag may have been only the first zigzag in a deeper double zigzag.
The first zigzag down is labelled cycle wave w. The double is joined by a now complete three in the opposite direction, a zigzag labelled cycle wave x.
The purpose of a second zigzag in a double is to deepen the correction when the first zigzag does not move price deep enough. Cycle wave y would be expected to move reasonably below the end of cycle wave w to deepen the correction. Were cycle wave y to reach equality with cycle wave w that takes Oil into negative price territory, which is not possible. Cycle wave y would reach 0.618 the length of cycle wave w at $2.33.
A better target calculation would be using the Fibonacci ratios between primary waves A and C within cycle wave y. This cannot be done until both primary waves A and B are complete.
Within cycle wave y, no second wave correction nor B wave may move beyond its start above 76.90.
WEEKLY CHART
Click chart to enlarge.
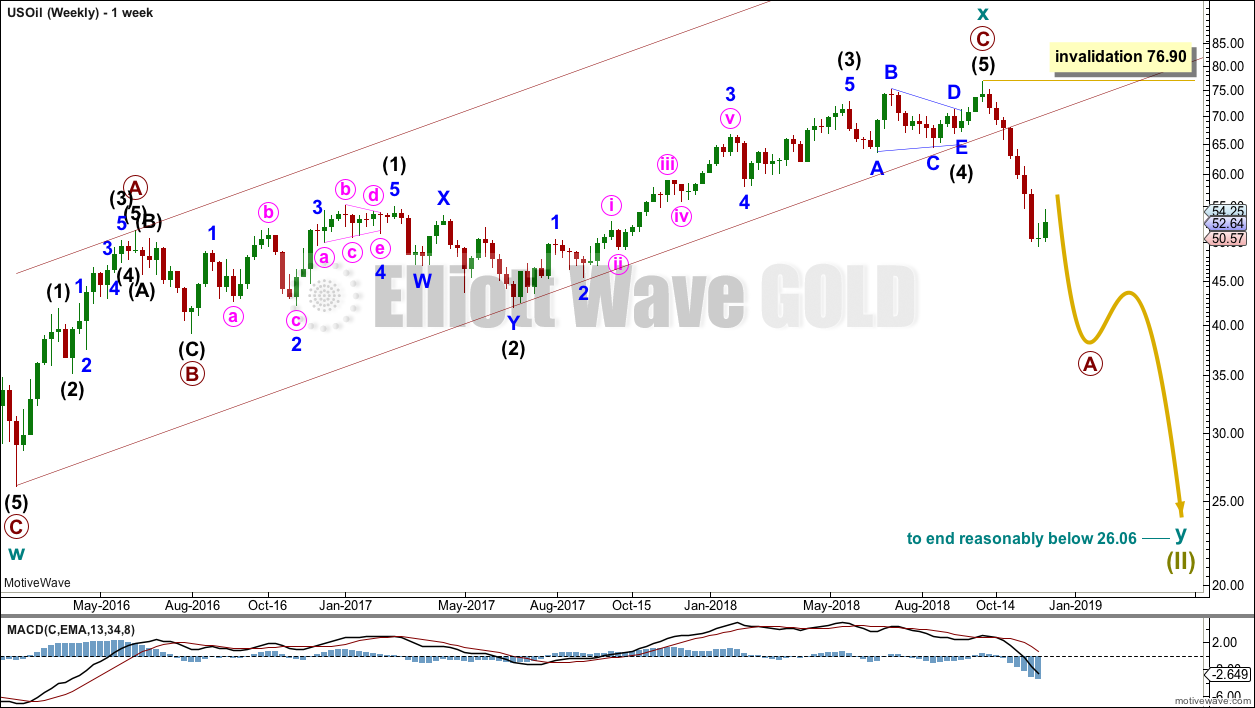
Cycle wave x is seen as a complete zigzag. Within the zigzag, primary wave C is a five wave impulse and within it intermediate wave 4 is a triangle.
A new low below 51.67 has added confidence in this bearish wave count. At that stage, the bullish alternate was invalidated.
Cycle wave y is expected to subdivide as a zigzag. A zigzag subdivides 5-3-5. Primary wave A must subdivide as a five wave structure if this wave count is correct.
Within primary wave A, intermediate wave (1) may now be complete. Intermediate wave (2) may be very deep.
DAILY CHART
Click chart to enlarge.
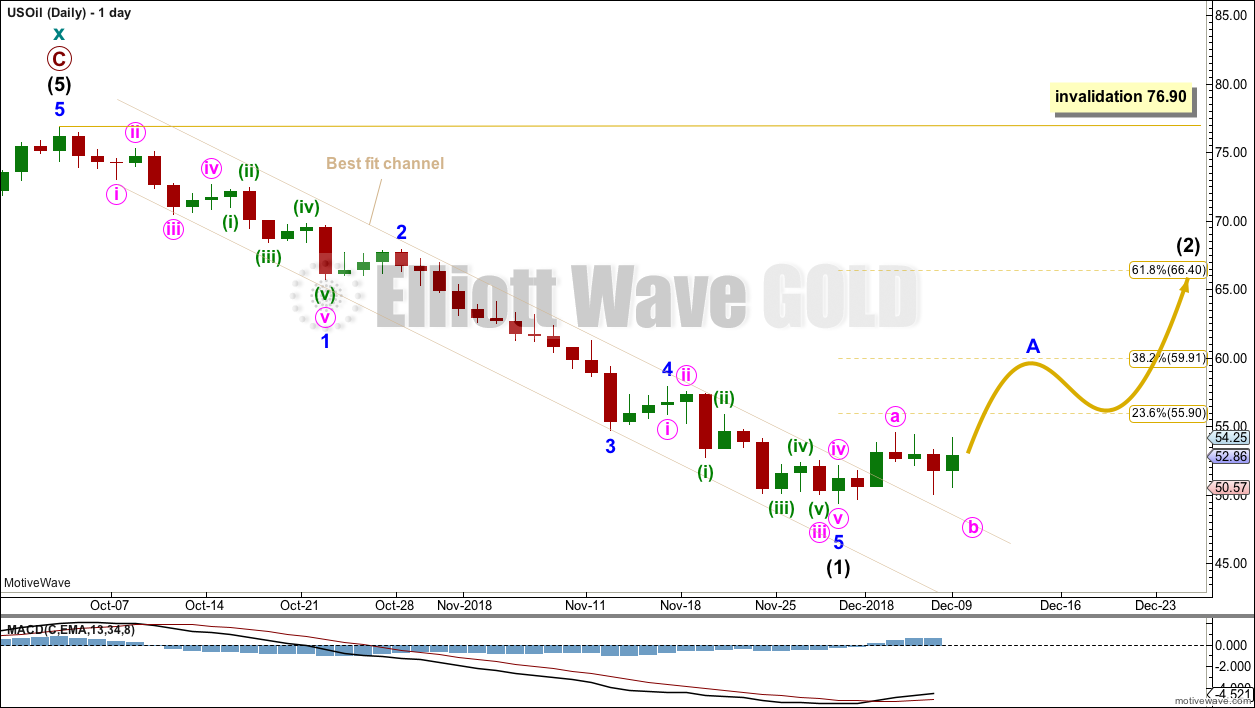
Attention now turns to the structure of downwards movement. An impulse may now be complete. This is labelled intermediate wave (1).
Within intermediate wave (1), minor wave 3 exhibits no Fibonacci ratio to minor wave 1 and minor wave 5 is 0.40 longer than 0.618 the length of minor wave 3.
The narrow best fit channel about intermediate wave (1) was clearly breached on the 4th of December. At that stage, this analysis expected that intermediate wave (1) should be over and intermediate wave (2) should be underway.
Intermediate wave (2) may subdivide as any corrective structure except a triangle. It would most likely be a zigzag (zigzags are the most common corrective structures). It is impossible to tell which structure it may be at the start, and as it unfolds labelling within it will change.
Intermediate wave (1) lasted 7 weeks. Intermediate wave (2) may be expected to have reasonable proportion to intermediate wave (1), so that the wave count has the right look. Intermediate wave (2) may last a Fibonacci 5, 8 or even 13 weeks if it is a more time consuming correction like a combination.
Intermediate wave (2) may not move beyond the start of intermediate wave (1) above 76.90.
For Oil the first large second wave correction within a new trend can be extremely deep. This does not always happen, but it is a fairly common tendency; we should be aware of this possibility here.
TECHNICAL ANALYSIS
MONTHLY CHART
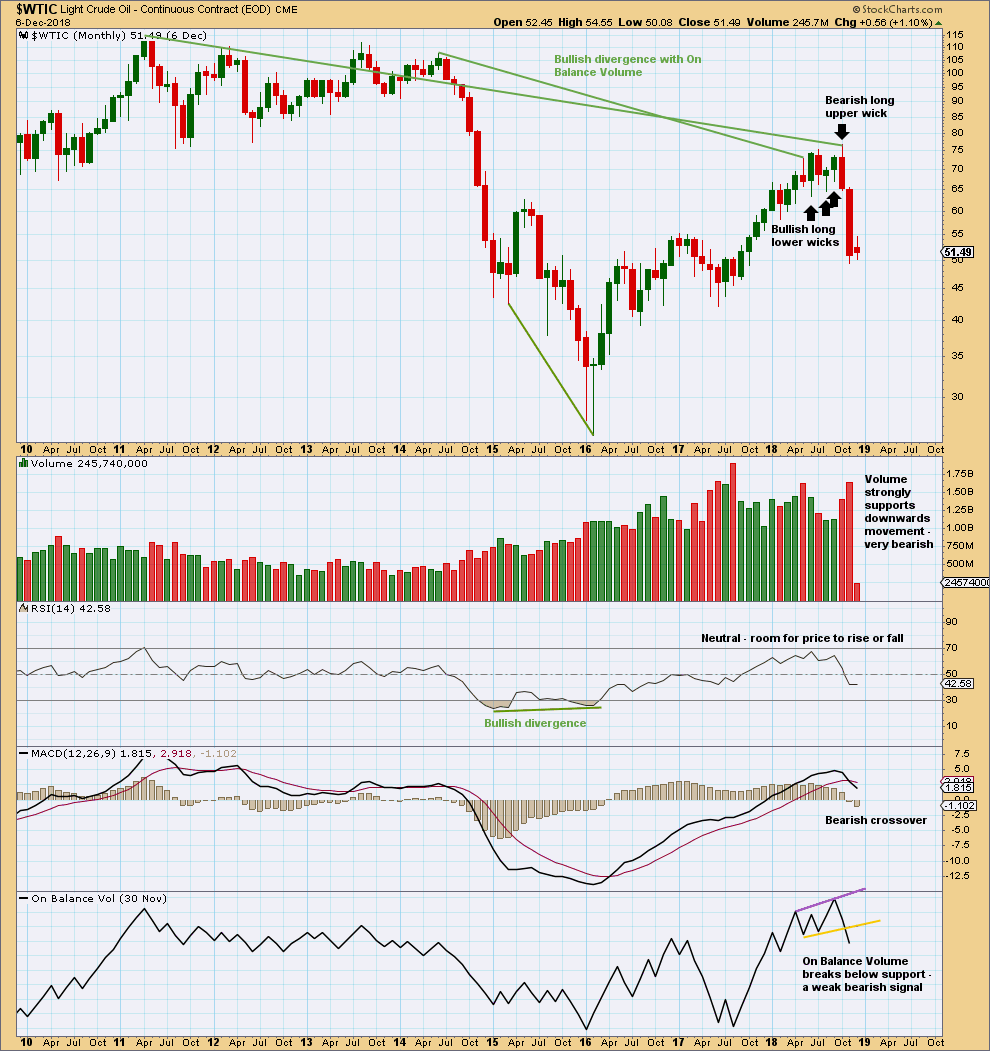
Click chart to enlarge. Chart courtesy of StockCharts.com.
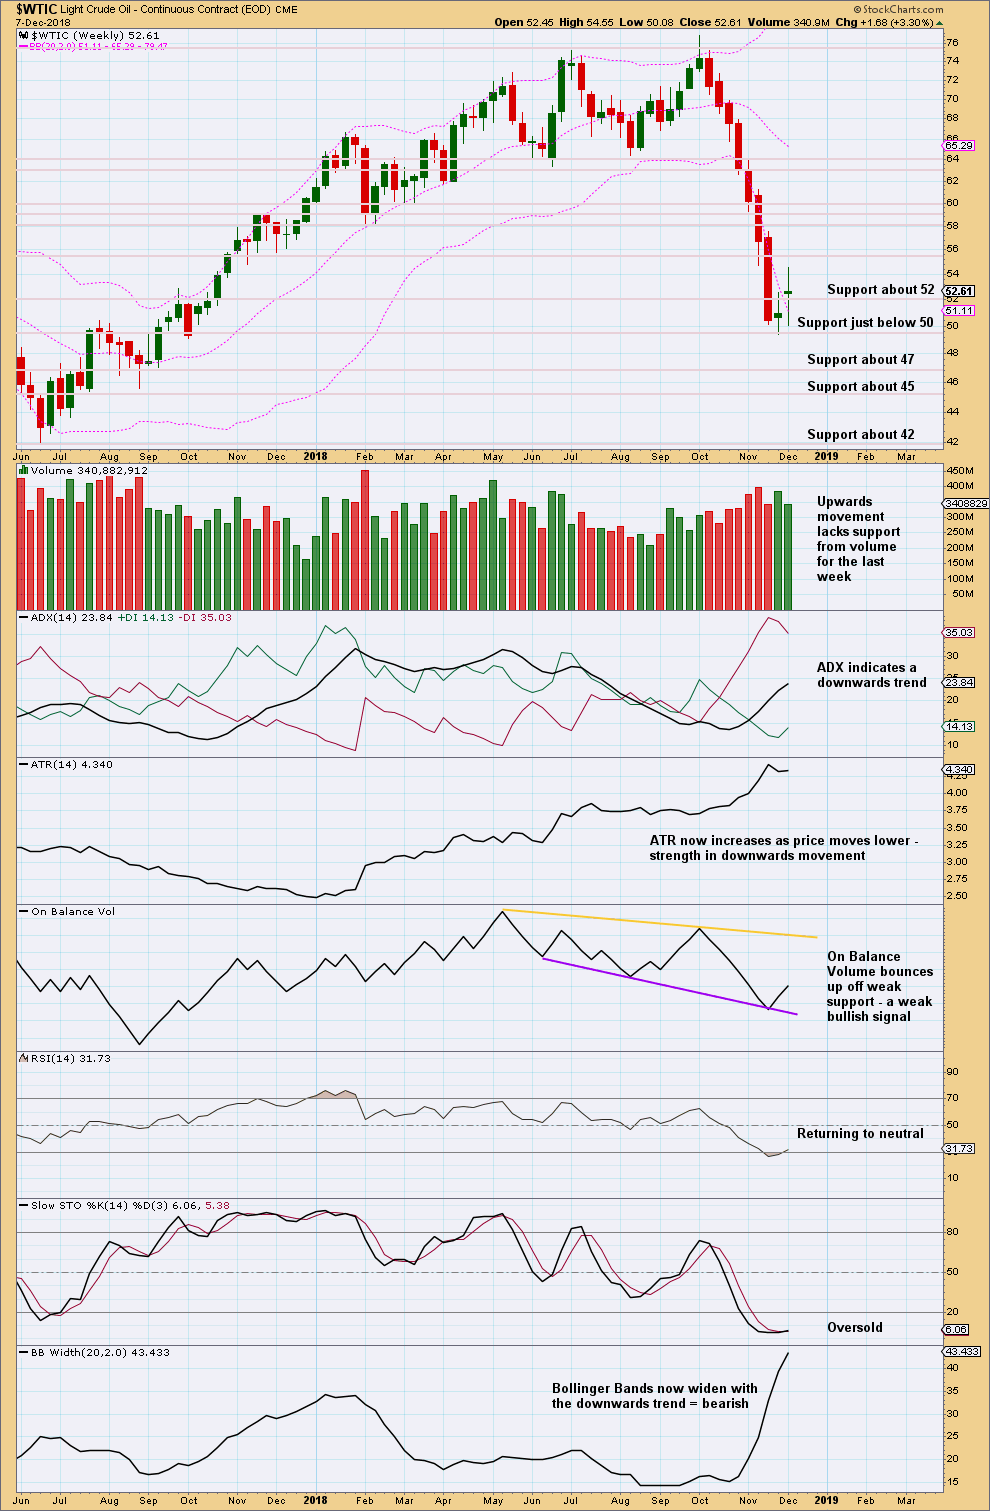
The month of November has a very small lower wick. This is still fairly bearish.
The signal from On Balance Volume is weak because the trend line breached had only two anchor points and a reasonable slope. But it is still a bearish signal.
WEEKLY CHART
Click chart to enlarge. Chart courtesy of StockCharts.com.
The doji on its own is not a candlestick reversal pattern. With last week’s real body inside the real body of last week’s real body, the candlestick cannot be part of a Morning Doji star either.
The signal last week from On Balance Volume is weak because the trend line it bounced up from had only two prior anchor points and has a reasonable slope.
The last two green weekly candlesticks do not complete a reversal pattern. The long wicks indicate some indecision. This looks like an interruption to the downwards trend and not like a new upwards trend. This supports the Elliott wave count.
DAILY CHART
Click chart to enlarge. Chart courtesy of StockCharts.com.
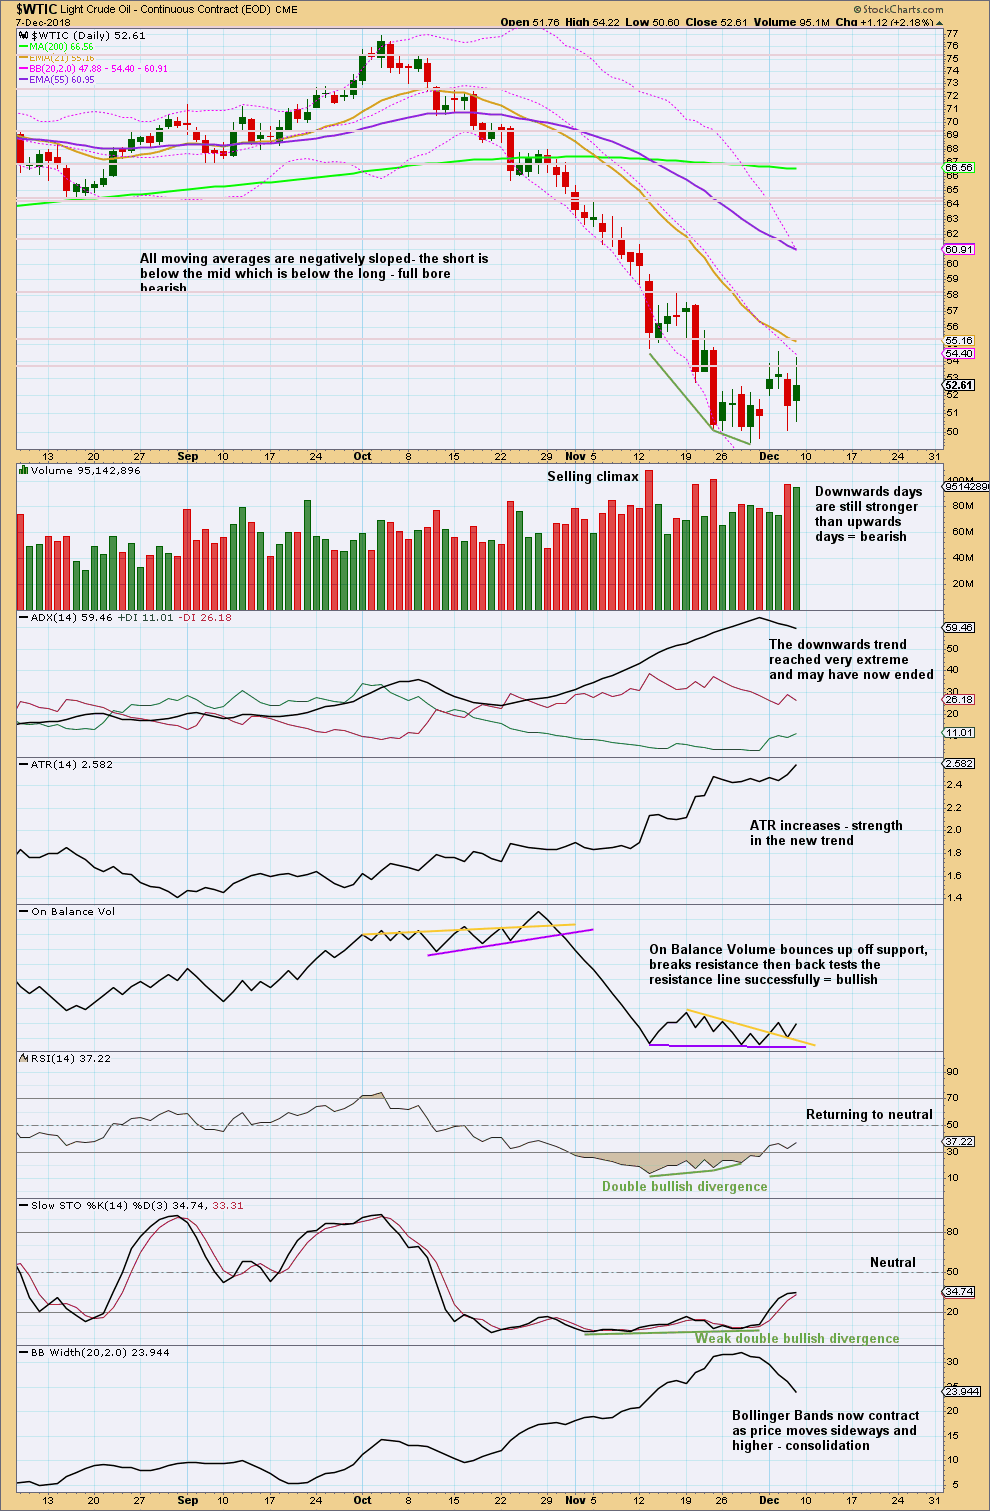
I have taken some time to look back at the last strong bearish trend from Oil from about May 2014 to January 2016. I have noticed that downwards waves often end with support from volume, and sometimes do not even end with a long lower wick. Bullish reversal patterns are often but not always found at lows. RSI can reach very extreme and remain so for as long as three months when this market has a strong downwards trend. At lows Stochastics often will exhibit bullish divergence, but this can be rather weak. At lows RSI sometimes, not always, exhibits bullish divergence and can remain deeply oversold for long periods of time.
US Oil is a particularly difficult market to find lows in. It can trend strongly for very long periods of time with indicators remaining very extreme.
At the daily chart level, there is no candlestick reversal pattern at the low. Sideways movement of this last week looks like a consolidation within a downwards trend. It may form a flag or pennant pattern.
Look for resistance just above 55 and next above that about 58.
Published @ 08:06 p.m. EST.
—
Careful risk management protects your trading account(s).
Follow my two Golden Rules:
1. Always trade with stops.
2. Risk only 1-5% of equity on any one trade.
Great analysis, thanks Lara.
I look forward to trading this Intermediate 2.
Thank you very much Nick.
Yes, it should be a decent opportunity. Look out for the B wave in the middle of it though!