
End of week analysis last week expected for the short term to see a sideways consolidation unfold to last a few days. A small range inside week exactly fits this expectation.
Summary: For the short term, a sideways consolidation may end very soon and be followed by another short upwards thrust to a target zone at 16.14 to 16.23.
However, a classic technical analysis target may be calculated about 17.09. This looks too optimistic; there is strong resistance ahead.
This bounce may be viewed as the first primary degree correction within an ongoing downwards trend as long as price does not make a new high above 17.680. At its end, it may offer an opportunity to short silver.
Monthly charts were reviewed here.
New updates to this analysis are in bold.
ELLIOTT WAVE COUNTS
MAIN WAVE COUNT
WEEKLY CHART – TRIANGLE
Click chart to enlarge.
This first wave count has good support from classic technical analysis, so it will be favoured. This wave count looks likely.
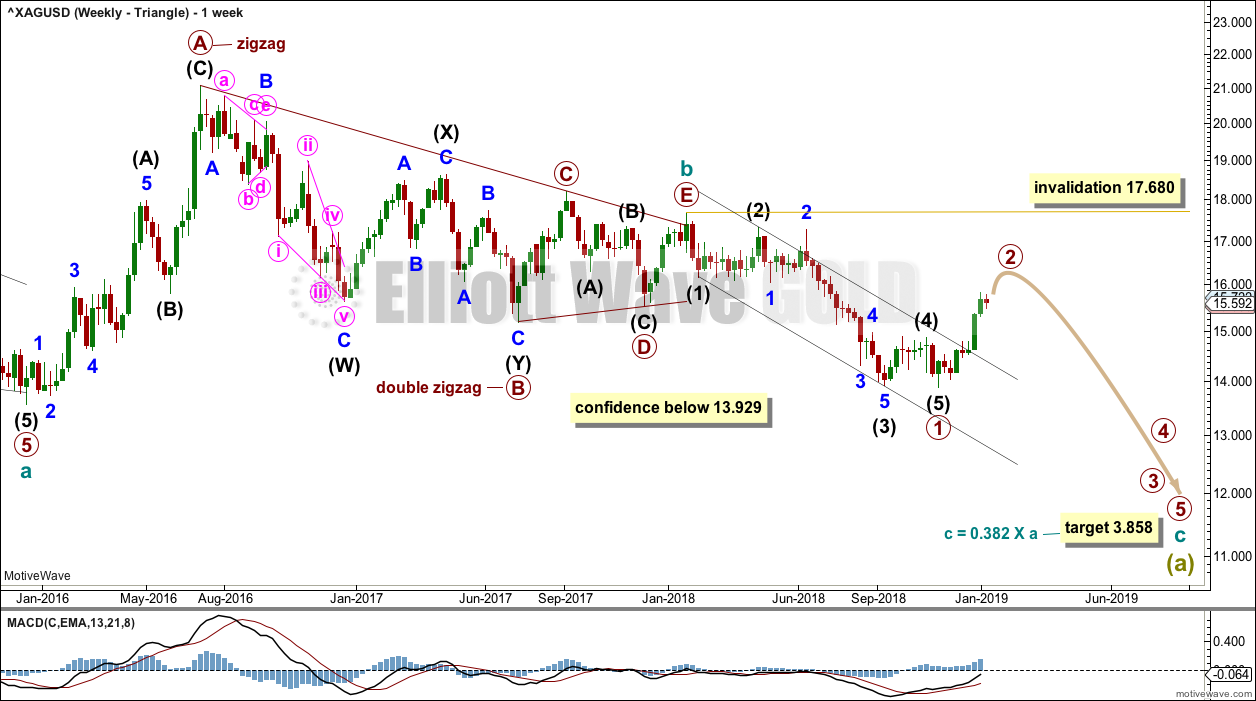
The first wave count expects that the bear market, which began from the April 2011 high, is incomplete.
Cycle wave a is seen as a five wave impulse for this main wave count.
This first weekly chart sees cycle wave b as a now possibly complete regular contracting triangle.
Primary wave E of the triangle may have ended with an overshoot of the A-C trend line.
Within cycle wave c, primary wave 1 may be a complete impulse. A breach of the black Elliott channel about primary wave 1 indicates primary wave 1 should be over and now primary wave 2 should be underway.
Primary wave 2 may not move beyond the start of primary wave 1 above 17.680.
Cycle wave c needs to move below the end of cycle wave a in order to avoid a truncation.
DAILY CHART – TRIANGLE
Click chart to enlarge.
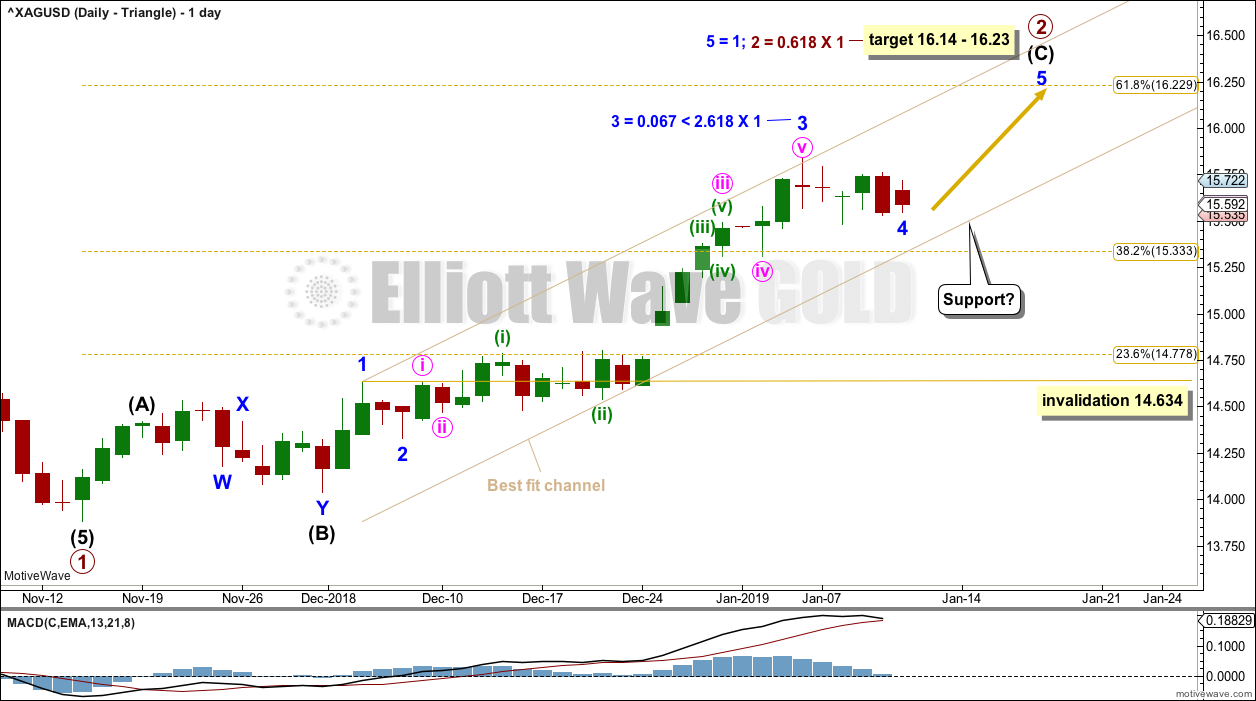
Primary wave 2 may subdivide as any corrective structure except a triangle. It would most likely subdivide as a zigzag as zigzags are the most common corrective structures.
So far it looks like primary wave 2 may be subdividing as a zigzag. The most likely target for it to end would be about the 0.618 Fibonacci ratio of primary wave 1.
A best fit channel is drawn about primary wave 2. If the upper edge of the channel is breached, then the channel may need to be redrawn.
Intermediate wave (C) is unfolding as an impulse. Within intermediate wave (C), minor wave 4 may not move into minor wave 1 price territory below 14.634.
Minor wave 4 may possibly be over. If it continues sideways or lower, then the lower edge of the target zone may be recalculated.
ALTERNATE WAVE COUNT
WEEKLY CHART – BULL WAVE COUNT
Click chart to enlarge.
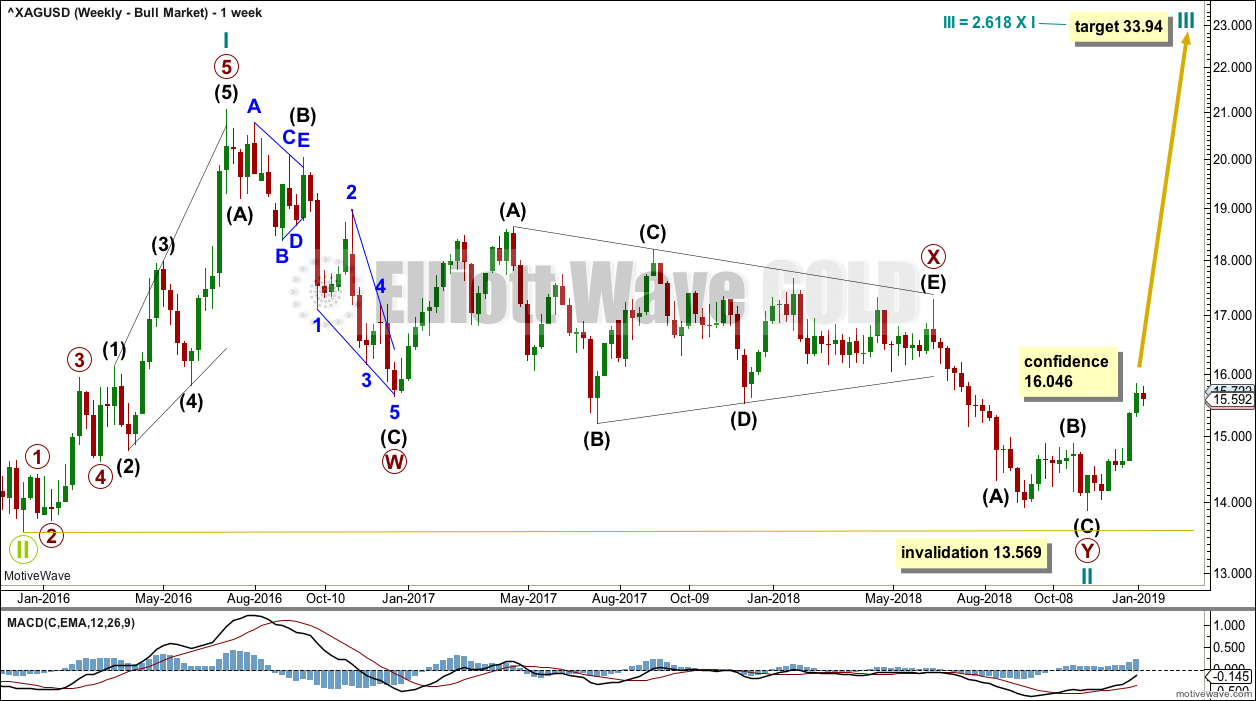
Cycle wave II may be a complete double zigzag. Cycle wave II would be very deep at 0.96 of cycle wave I. This is typical behaviour for the first second wave correction within a new trend for commodities.
If it continues any further, then cycle wave II may not move beyond the start of cycle wave I below 13.569.
DAILY CHART – BULL WAVE COUNT
Click chart to enlarge.
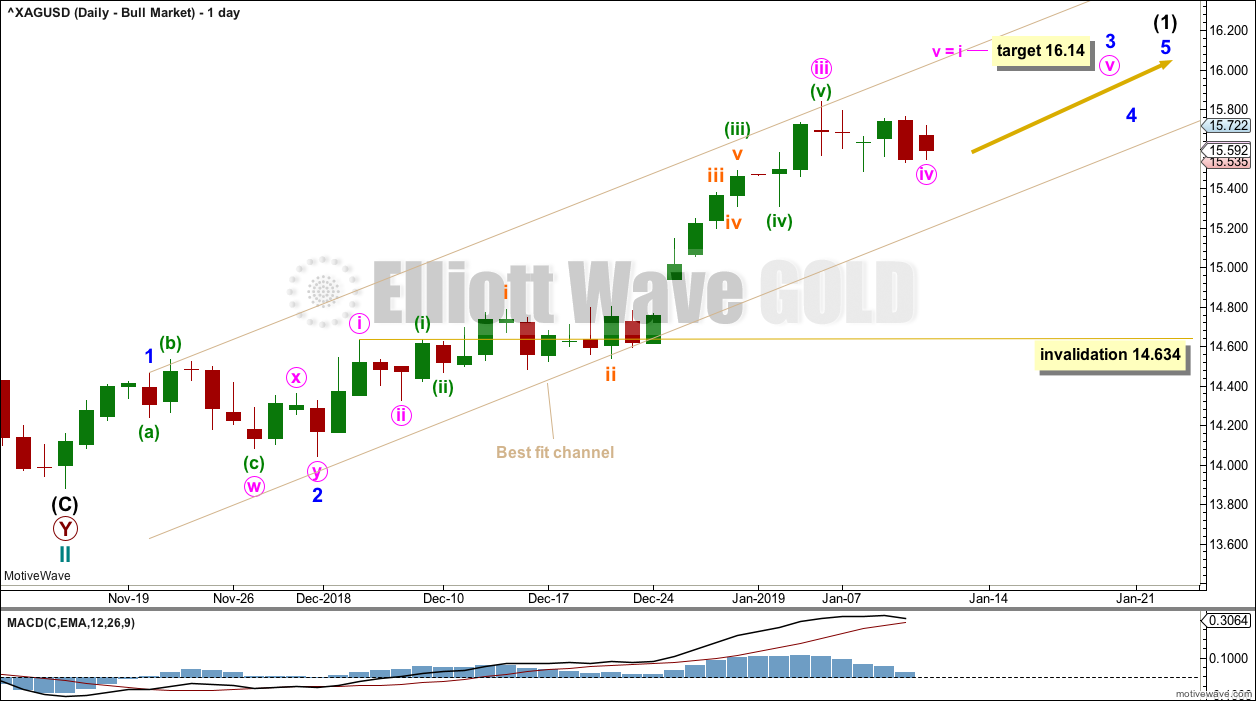
If cycle wave II is over, then the new trend up for cycle wave III should begin with a five wave structure. This is labelled intermediate wave (1). The structure is still incomplete.
Within the impulse, minute wave iv may not move into minute wave i price territory below 14.634.
TECHNICAL ANALYSIS
WEEKLY CHART
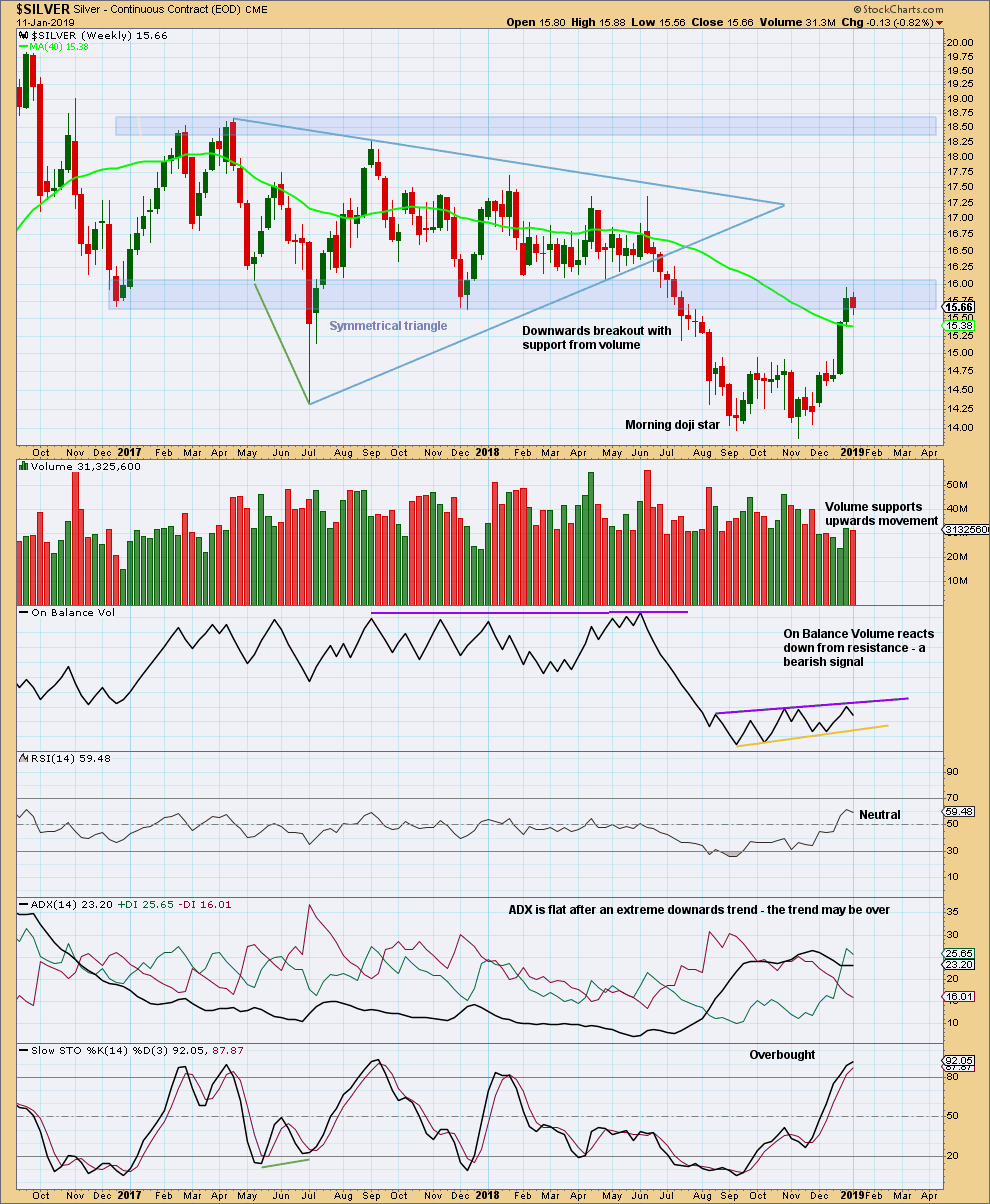
Click chart to enlarge. Chart courtesy of StockCharts.com.
Silver may now be bouncing up to test resistance at prior support. Look for strong resistance about 15.60 to 16.05.
With price within a strong zone of resistance and On Balance Volume reacting down from resistance, look now for either a trend change or consolidation to continue about here.
DAILY CHART
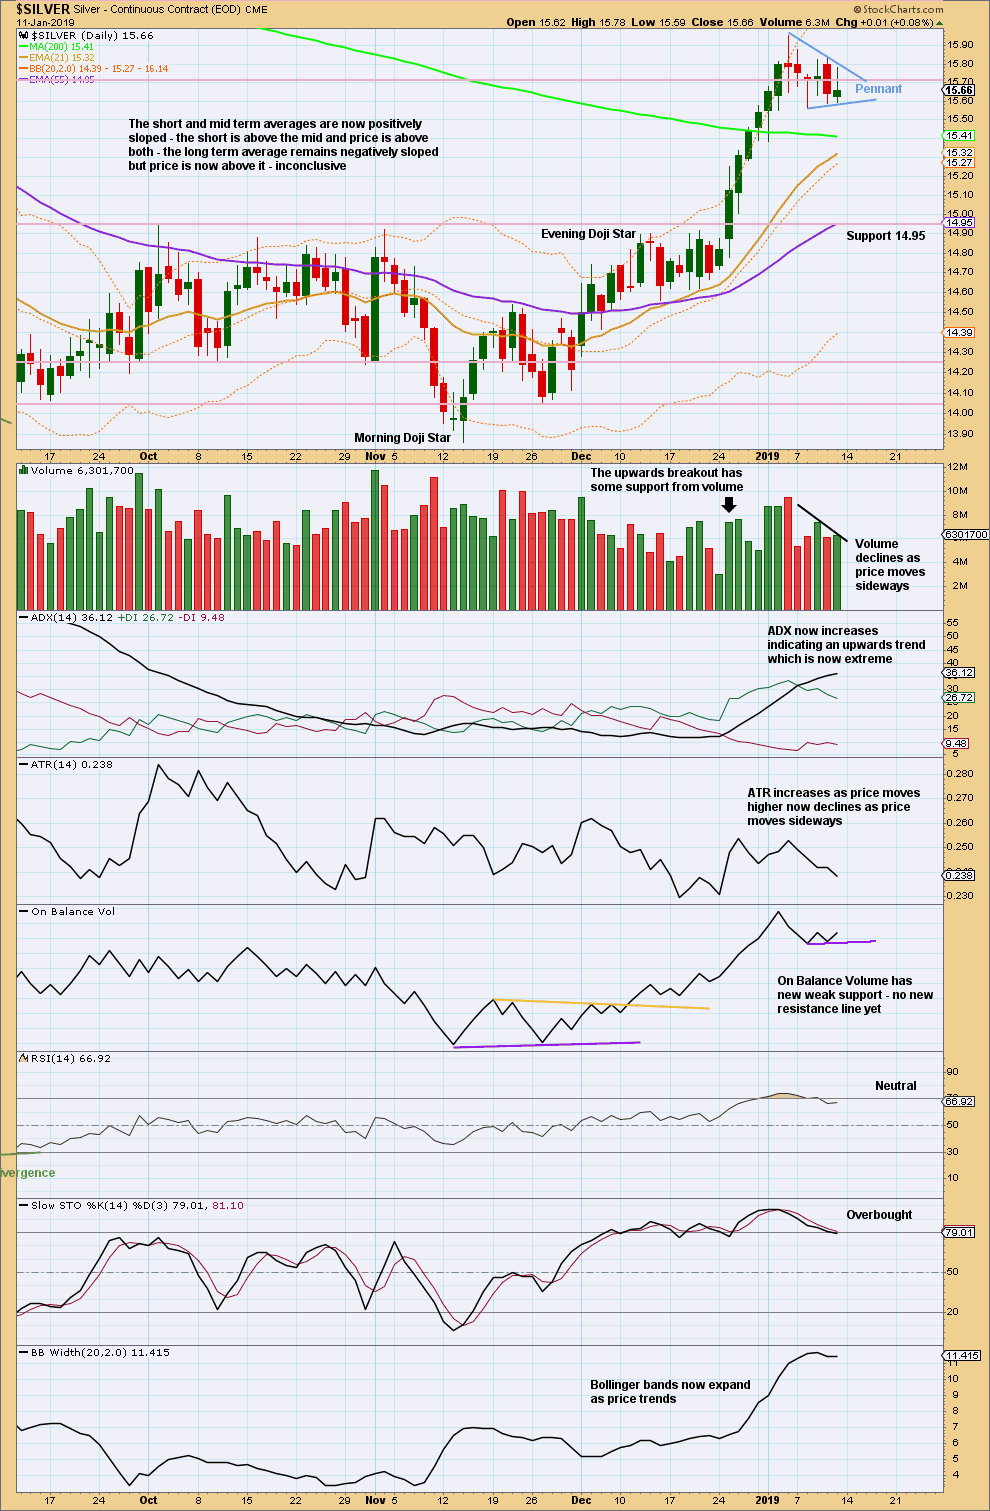
Click chart to enlarge. Chart courtesy of StockCharts.com.
A small pennant pattern may be forming. If this remains viable, then a possible target may be about 17.09. This target may be too optimistic though; there is very strong resistance ahead.
Published @ 02:07 p.m. EST on January 13, 2019.
—
Careful risk management protects your trading account(s).
Follow my two Golden Rules:
1. Always trade with stops.
2. Risk only 1-5% of equity on any one trade.