
Price remains above the invalidation point for both Elliott wave counts.
Summary: For the short term, a sideways consolidation may end very soon and be followed by another short upwards thrust to a target zone at 16.26 to 16.23.
A classic analysis target would be about 16.90.
A new low below 14.634 would indicate that the bounce is over and a large third wave down may then be in its early stages.
This bounce may be viewed as the first primary degree correction within an ongoing downwards trend as long as price does not make a new high above 17.680. At its end, it may offer an opportunity to short silver.
Monthly charts were reviewed here.
New updates to this analysis are in bold.
ELLIOTT WAVE COUNTS
MAIN WAVE COUNT
WEEKLY CHART – TRIANGLE
Click chart to enlarge.
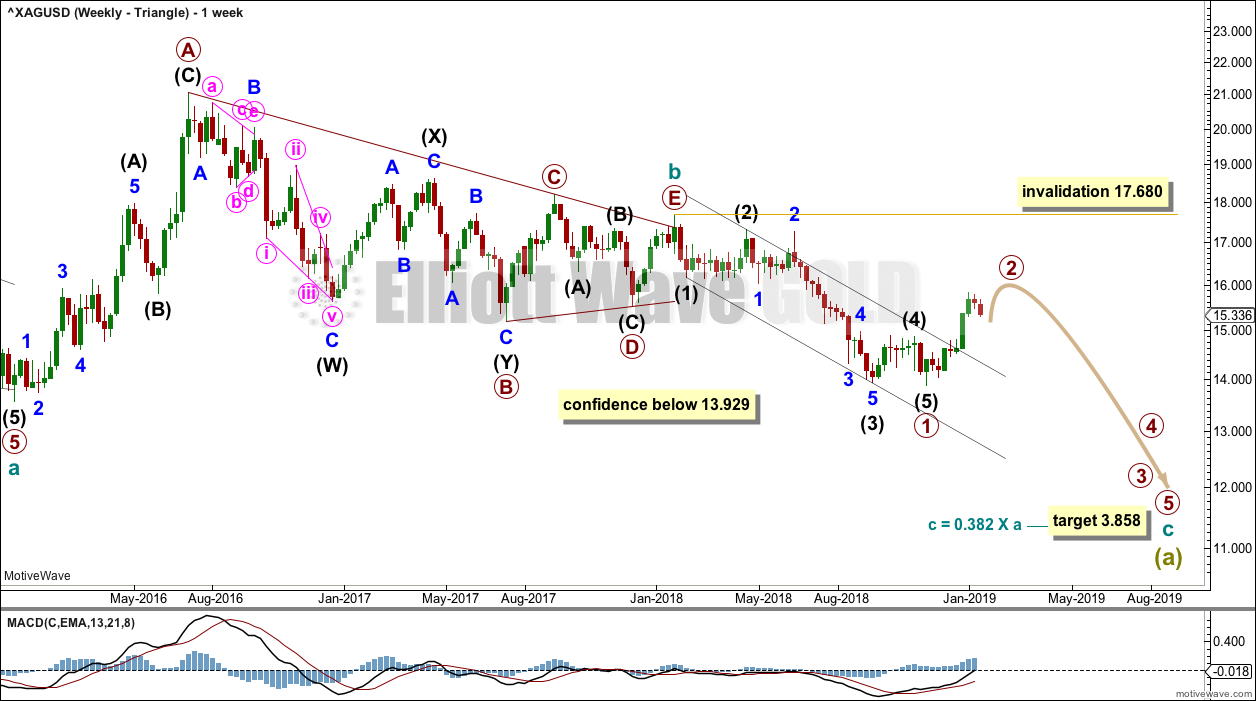
This first wave count has good support from classic technical analysis, so it will be favoured. This wave count looks likely.
The first wave count expects that the bear market, which began from the April 2011 high, is incomplete.
Cycle wave a is seen as a five wave impulse for this main wave count.
This first weekly chart sees cycle wave b as a now possibly complete regular contracting triangle.
Primary wave E of the triangle may have ended with an overshoot of the A-C trend line.
Within cycle wave c, primary wave 1 may be a complete impulse. A breach of the black Elliott channel about primary wave 1 indicates primary wave 1 should be over and now primary wave 2 should be underway.
Primary wave 2 may not move beyond the start of primary wave 1 above 17.680.
Cycle wave c needs to move below the end of cycle wave a in order to avoid a truncation.
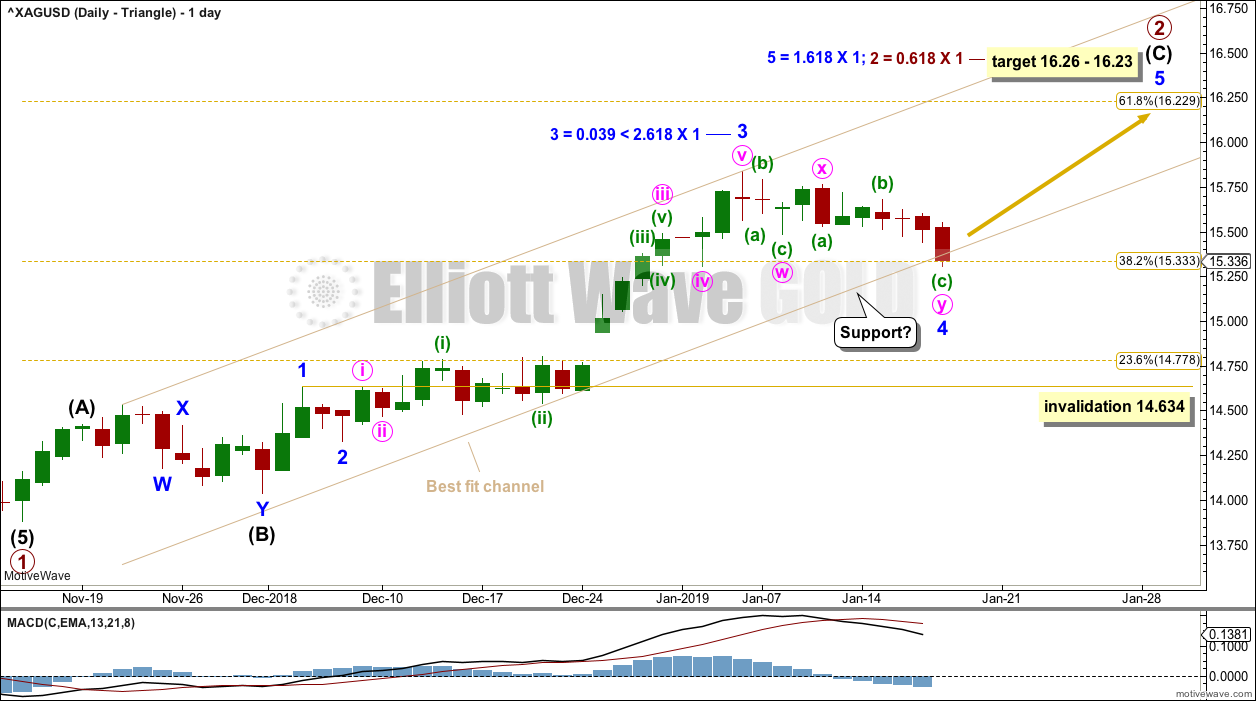
DAILY CHART – TRIANGLE
Click chart to enlarge.
Primary wave 2 may subdivide as any corrective structure except a triangle. It would most likely subdivide as a zigzag as zigzags are the most common corrective structures.
So far it looks like primary wave 2 may be subdividing as a zigzag. The most likely target for it to end would be about the 0.618 Fibonacci ratio of primary wave 1.
The best fit channel is adjusted about primary wave 2. The lower edge may be about where price finds some support. If the channel is breached again, it may need to be readjusted.
Intermediate wave (C) is unfolding as an impulse. Within intermediate wave (C), minor wave 4 may not move into minor wave 1 price territory below 14.634.
Minor wave 4 may possibly be over.
ALTERNATE WAVE COUNT
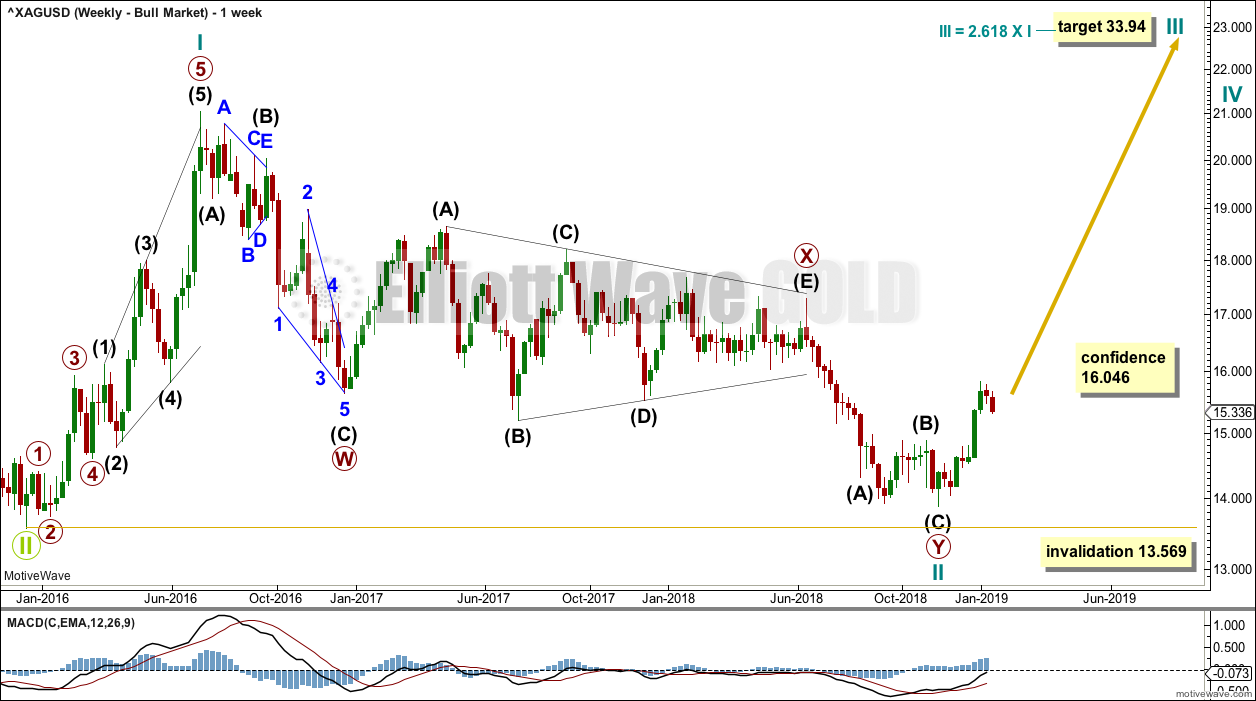
WEEKLY CHART – BULL WAVE COUNT
Click chart to enlarge.
Cycle wave II may be a complete double zigzag. Cycle wave II would be very deep at 0.96 of cycle wave I. This is typical behaviour for the first second wave correction within a new trend for commodities.
If it continues any further, then cycle wave II may not move beyond the start of cycle wave I below 13.569.
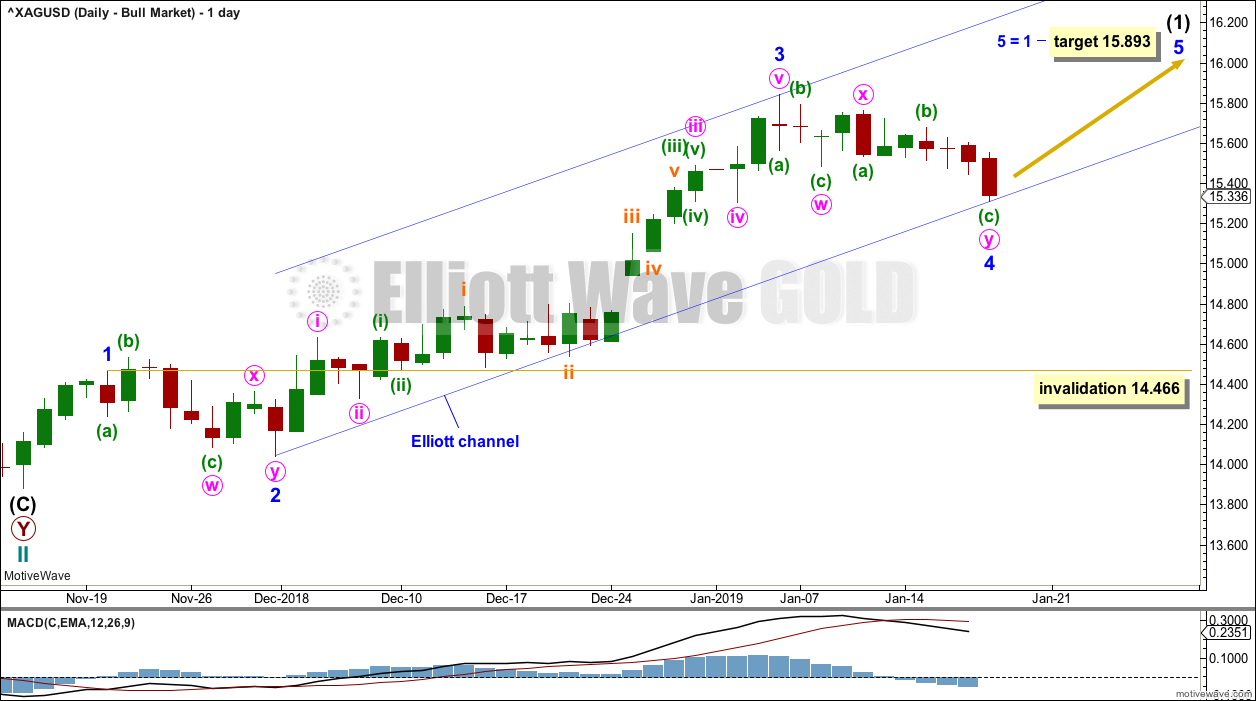
DAILY CHART – BULL WAVE COUNT
Click chart to enlarge.
If cycle wave II is over, then the new trend up for cycle wave III should begin with a five wave structure. This is labelled intermediate wave (1). The structure is still incomplete.
Intermediate wave (1) is relabelled to have better proportion. Minor wave 4 may be complete or almost complete as a double zigzag. Although minor wave 4 is labelled W-X-Y in the same way as minor wave 2, each is a different structure: minor wave 2 fits as a double combination and minor wave 4 as a double zigzag. There is perfect alternation between them.
Minor wave 4 may not move into minor wave 1 price territory below 14.466.
TECHNICAL ANALYSIS
WEEKLY CHART
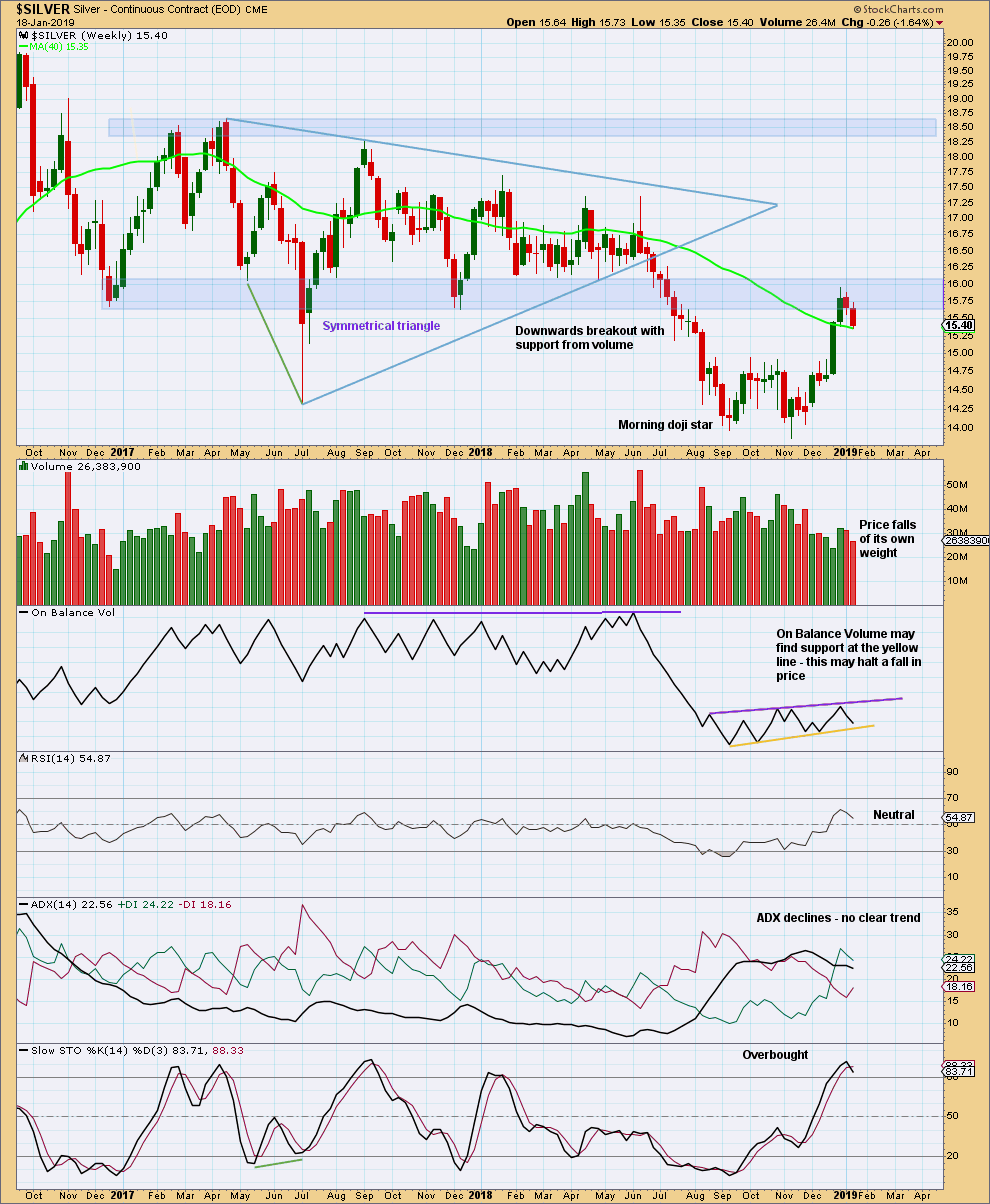
Click chart to enlarge. Chart courtesy of StockCharts.com.
There is no candlestick reversal pattern at the last high. Support for On Balance Volume may halt a fall in price. If support for On Balance Volume is broken, that would provide a bearish signal and then a high in place may be considered.
DAILY CHART
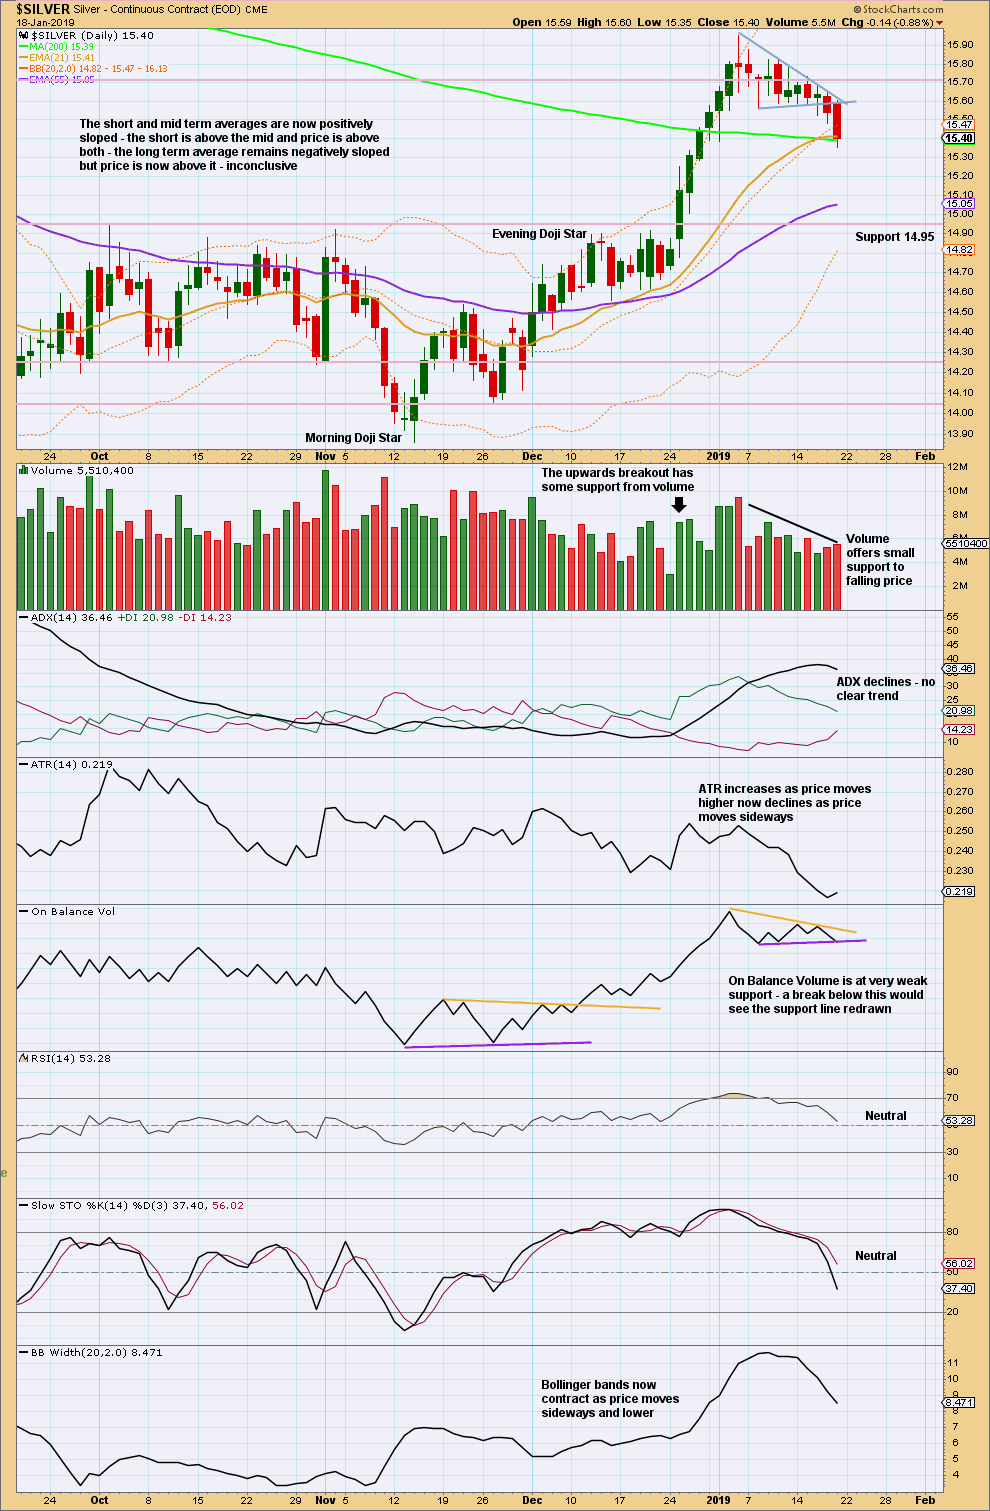
Click chart to enlarge. Chart courtesy of StockCharts.com.
The pennant pattern now looks like it may have morphed into a flag pattern. The best flags and pennants last up to 15 sessions. So far this one has lasted 11 sessions.
A target using the flag pole would be about 16.90.
There is no bearish candlestick reversal pattern at the last high. This downwards movement still looks like a counter trend movement at this stage.
Published @ 04:12 p.m. EST on January 19, 2019.
—
Careful risk management protects your trading account(s).
Follow my two Golden Rules:
1. Always trade with stops.
2. Risk only 1-5% of equity on any one trade.