
Sideways movement was expected to end at some stage this week and be followed by upwards movement. Friday’s strong upwards day is exactly what was expected.
Summary: The target is now at 16.13 to 16.23.
A classic analysis target would be about 16.88.
Thereafter, a new low below 15.169 would indicate that the bounce is over and a large third wave down may then be in its early stages.
This bounce may be viewed as the first primary degree correction within an ongoing downwards trend as long as price does not make a new high above 17.680. At its end, it may offer an opportunity to short silver.
Monthly charts were reviewed here.
New updates to this analysis are in bold.
ELLIOTT WAVE COUNTS
MAIN WAVE COUNT
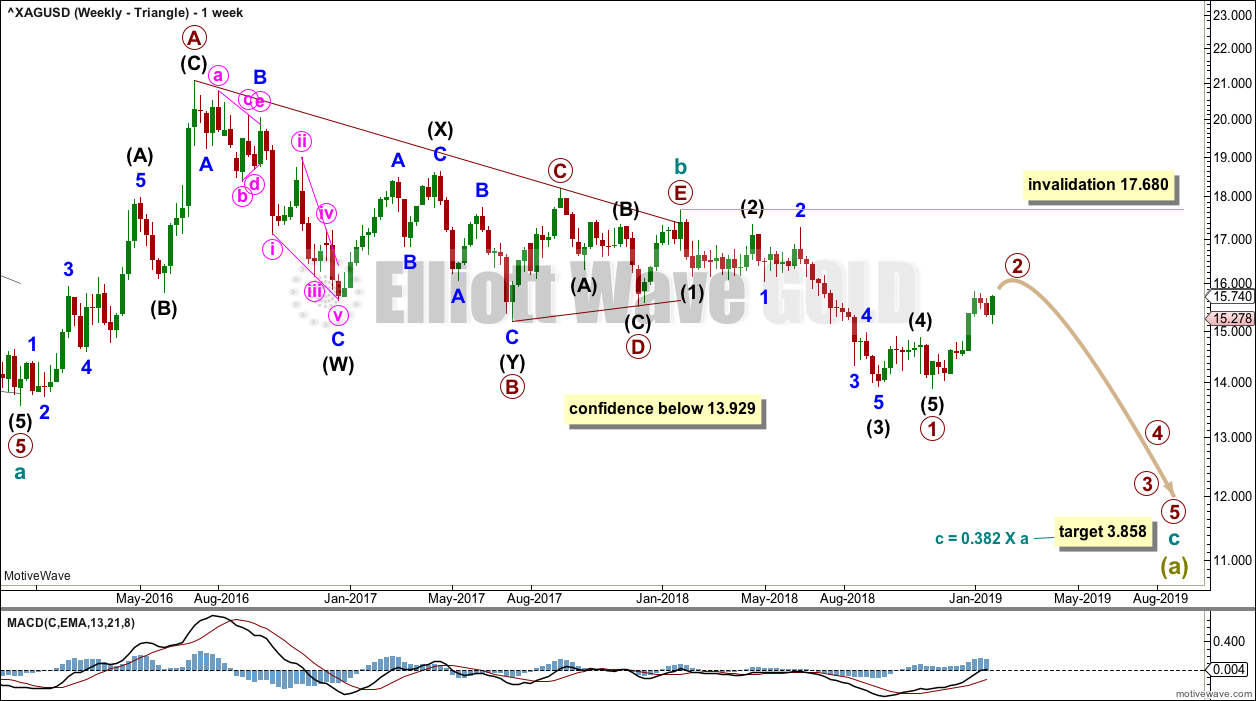
WEEKLY CHART – TRIANGLE
Click chart to enlarge.
This first wave count has good support from classic technical analysis, so it will be favoured. This wave count looks likely.
The first wave count expects that the bear market, which began from the April 2011 high, is incomplete.
Cycle wave a is seen as a five wave impulse for this main wave count.
This first weekly chart sees cycle wave b as a now possibly complete regular contracting triangle.
Primary wave E of the triangle may have ended with an overshoot of the A-C trend line.
Within cycle wave c, primary wave 1 is a complete impulse. Primary wave 2 may be an almost complete zigzag.
Primary wave 2 may not move beyond the start of primary wave 1 above 17.680.
Cycle wave c needs to move below the end of cycle wave a in order to avoid a truncation.
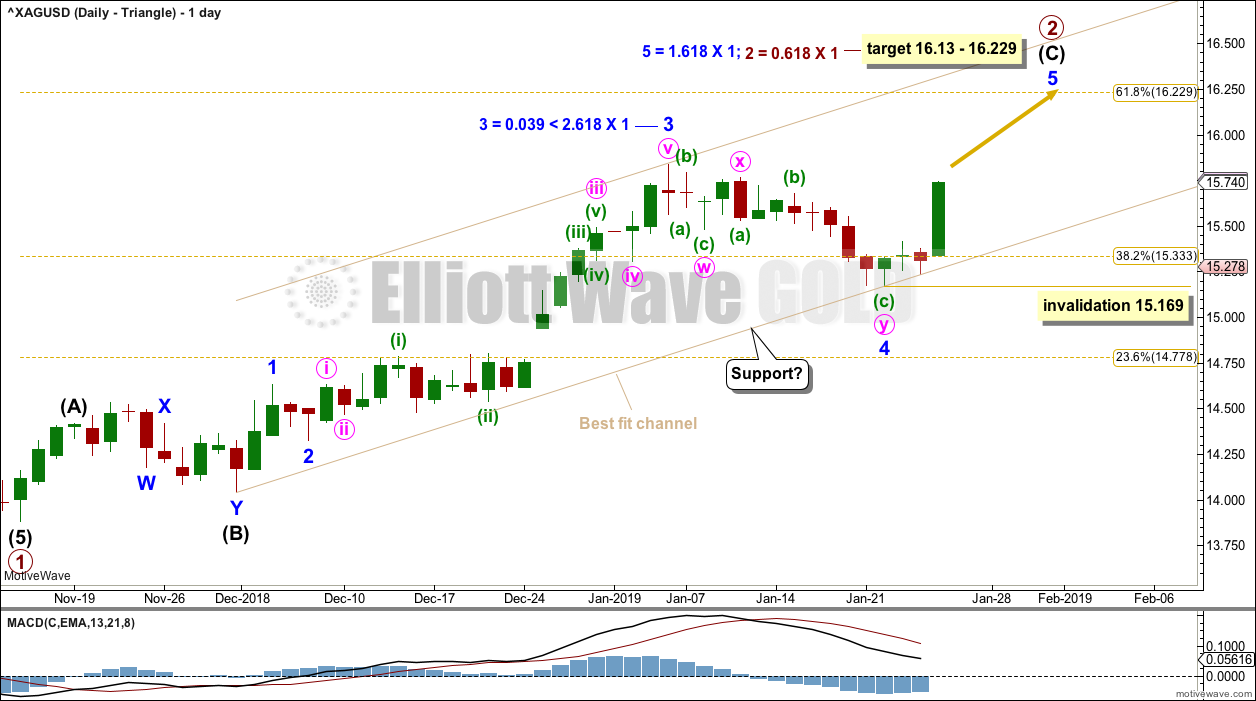
DAILY CHART – TRIANGLE
Click chart to enlarge.
Primary wave 2 may be subdividing as a zigzag. The most likely target for it to end would be about the 0.618 Fibonacci ratio of primary wave 1.
The best fit channel is again adjusted about primary wave 2.
Intermediate wave (C) is unfolding as an impulse. Within intermediate wave (C), minor waves 1 through to 4 may now be complete. Minor wave 5 has begun. The target is widened to a zone now calculated at two degrees.
Minor wave 5 would be very likely to make at least a slight new high above the end of minor wave 3 at 15.841 to avoid a truncation.
Within minor wave 5, no second wave correction may move beyond the start of its first wave below 15.169.
When minor wave 5 may be complete, then a new low below 15.169 could not be a second wave correction within an extending minor wave 5, and so at that stage a new low below 15.169 may be taken as price confirmation that primary wave 2 should be over.
ALTERNATE WAVE COUNT
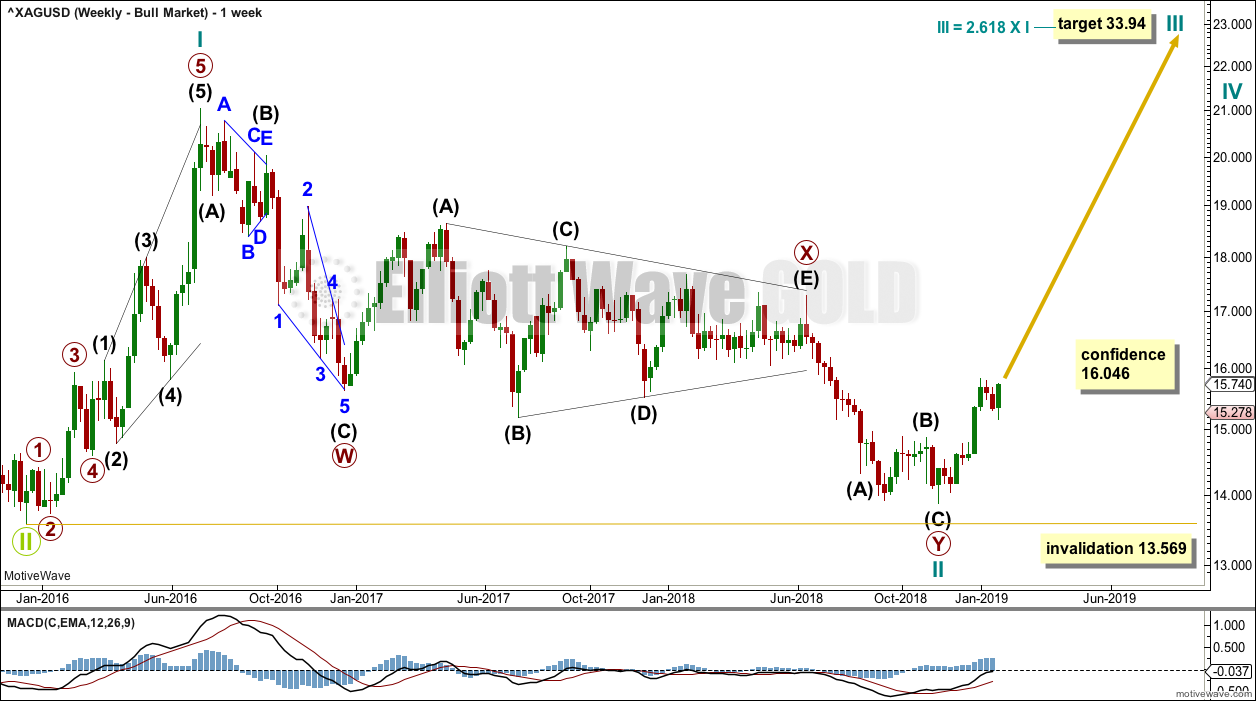
WEEKLY CHART – BULL WAVE COUNT
Click chart to enlarge.
Cycle wave II may be a complete double zigzag. Cycle wave II would be very deep at 0.96 of cycle wave I. This is typical behaviour for the first second wave correction within a new trend for commodities.
If it continues any further, then cycle wave II may not move beyond the start of cycle wave I below 13.569.
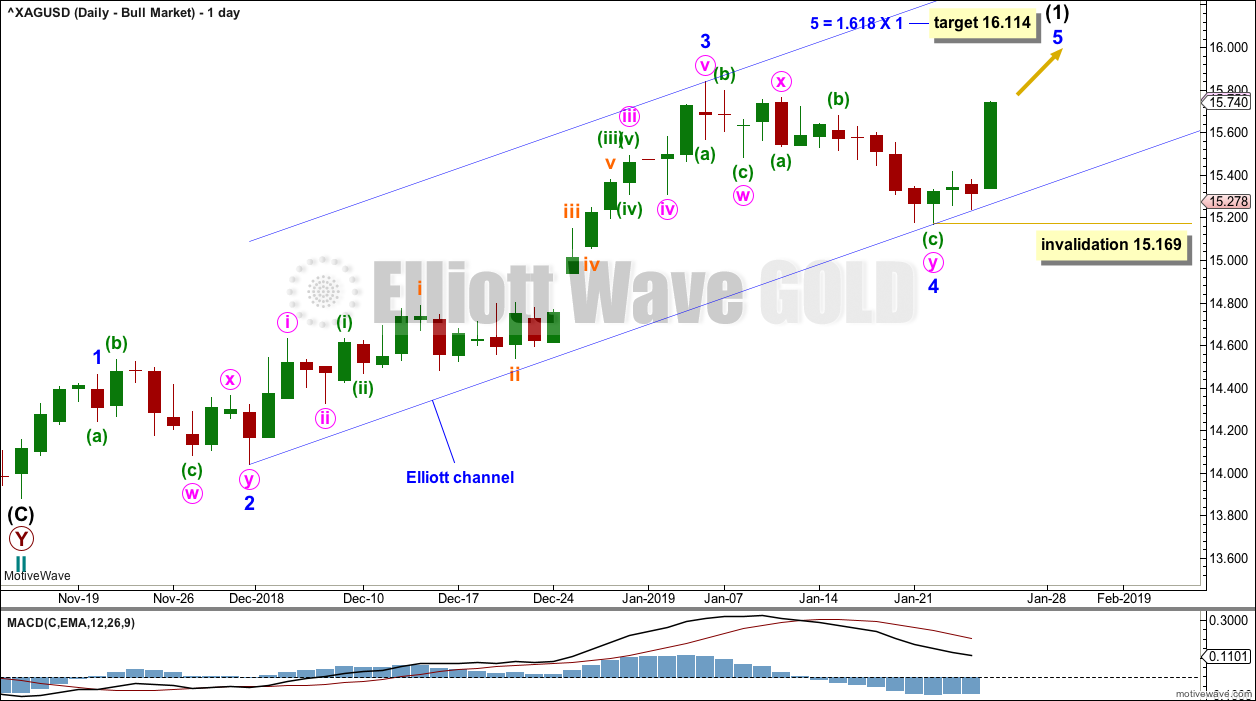
DAILY CHART – BULL WAVE COUNT
Click chart to enlarge.
If cycle wave II is over, then the new trend up for cycle wave III should begin with a five wave structure. This is labelled intermediate wave (1). The structure is still incomplete.
Minor wave 4 may be complete as a double zigzag. Although minor wave 4 is labelled W-X-Y in the same way as minor wave 2, each is a different structure: minor wave 2 fits as a double combination and minor wave 4 as a double zigzag. There is perfect alternation between them.
Within minor wave 5, no second wave correction may move beyond the start of its first wave below 15.169.
TECHNICAL ANALYSIS
WEEKLY CHART
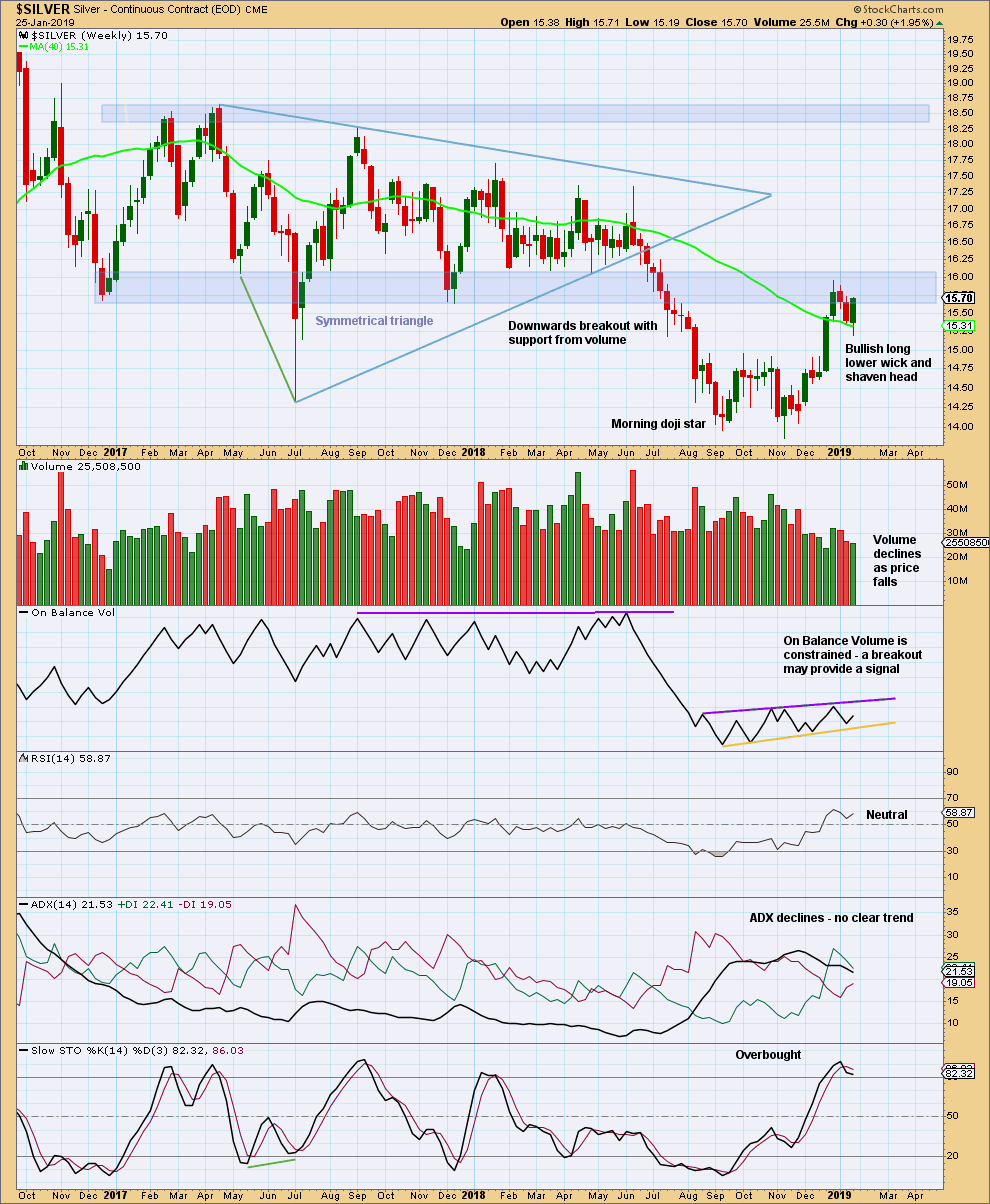
Click chart to enlarge. Chart courtesy of StockCharts.com.
On Balance Volume did halt the fall in price this week. It gives a small bullish signal with a bounce up from support.
To judge the short-term volume profile this week it is necessary to look inside the week at the daily volume profile.
DAILY CHART
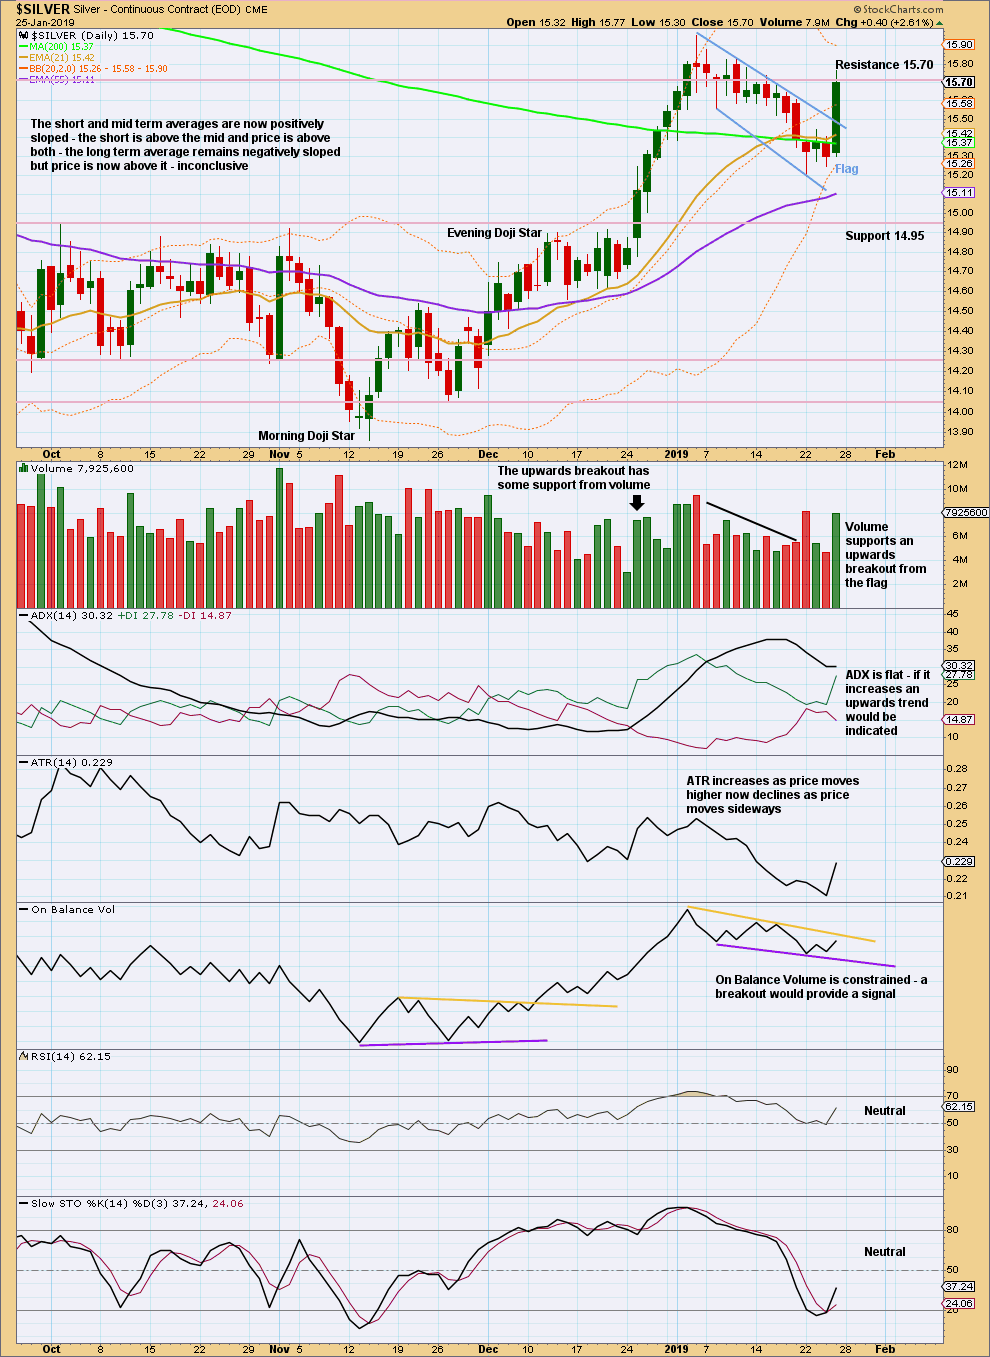
Click chart to enlarge. Chart courtesy of StockCharts.com.
Friday completes a strong bullish candlestick which breaks above the upper flag trend line with support from volume.
The target is at 16.88.
Published @ 12:29 a.m. EST on January 27, 2019.
—
Careful risk management protects your trading account(s).
Follow my two Golden Rules:
1. Always trade with stops.
2. Risk only 1-5% of equity on any one trade.