
Last week’s end of week US Oil analysis expected a bounce or sideways consolidation had begun. An upwards week this week fits this expectation perfectly.
Summary: A bounce or sideways consolidation for a few weeks is now expected to continue. The target is about 63.71.
A breach of the best fit channel and a Morning Doji Star candlestick pattern on the weekly chart add support to this view.
The larger picture still sees Oil in a new downwards trend to end reasonably below 26.06.
New updates to this analysis are in bold.
MAIN ELLIOTT WAVE COUNT
MONTHLY CHART
Click chart to enlarge.
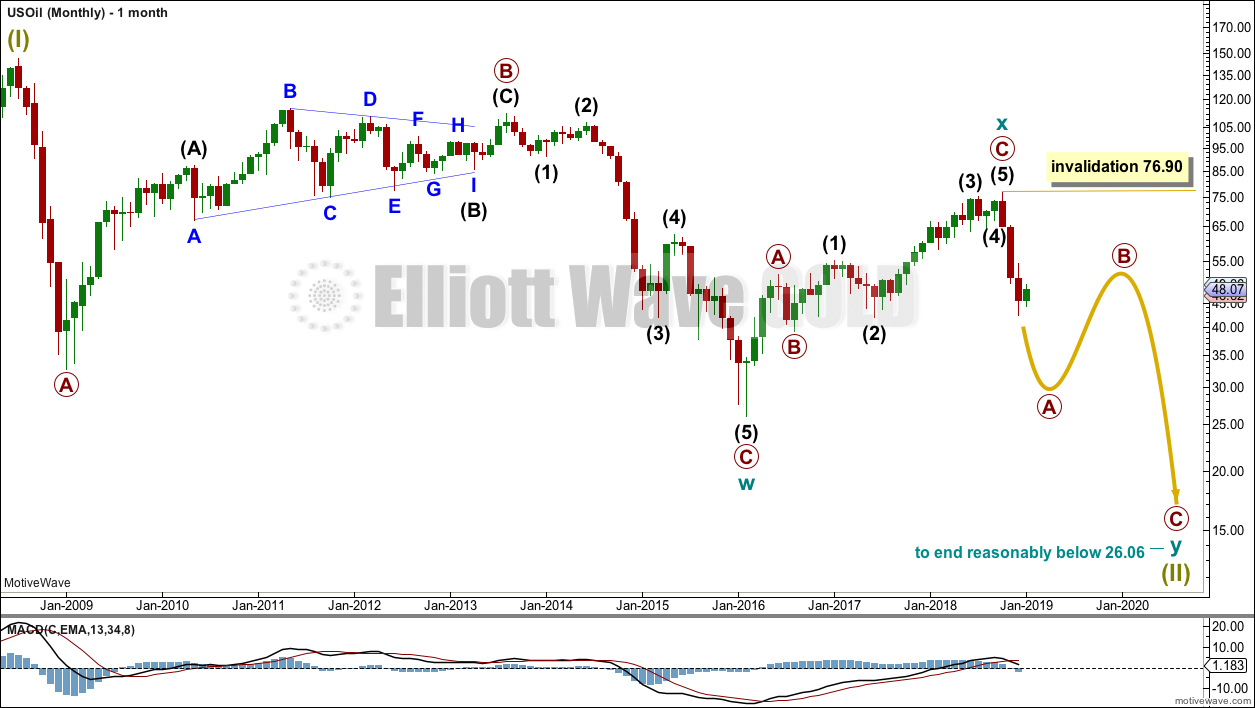
Classic technical analysis favours a bearish wave count for Oil at this time.
The large fall in price from the high in June 2008 to February 2016 is seen as a complete three wave structure. This large zigzag may have been only the first zigzag in a deeper double zigzag.
The first zigzag down is labelled cycle wave w. The double is joined by a now complete three in the opposite direction, a zigzag labelled cycle wave x.
The purpose of a second zigzag in a double is to deepen the correction when the first zigzag does not move price deep enough. Cycle wave y would be expected to move reasonably below the end of cycle wave w to deepen the correction. Were cycle wave y to reach equality with cycle wave w that takes Oil into negative price territory, which is not possible. Cycle wave y would reach 0.618 the length of cycle wave w at $2.33.
A better target calculation would be using the Fibonacci ratios between primary waves A and C within cycle wave y. This cannot be done until both primary waves A and B are complete.
Within cycle wave y, no second wave correction nor B wave may move beyond its start above 76.90.
WEEKLY CHART
Click chart to enlarge.
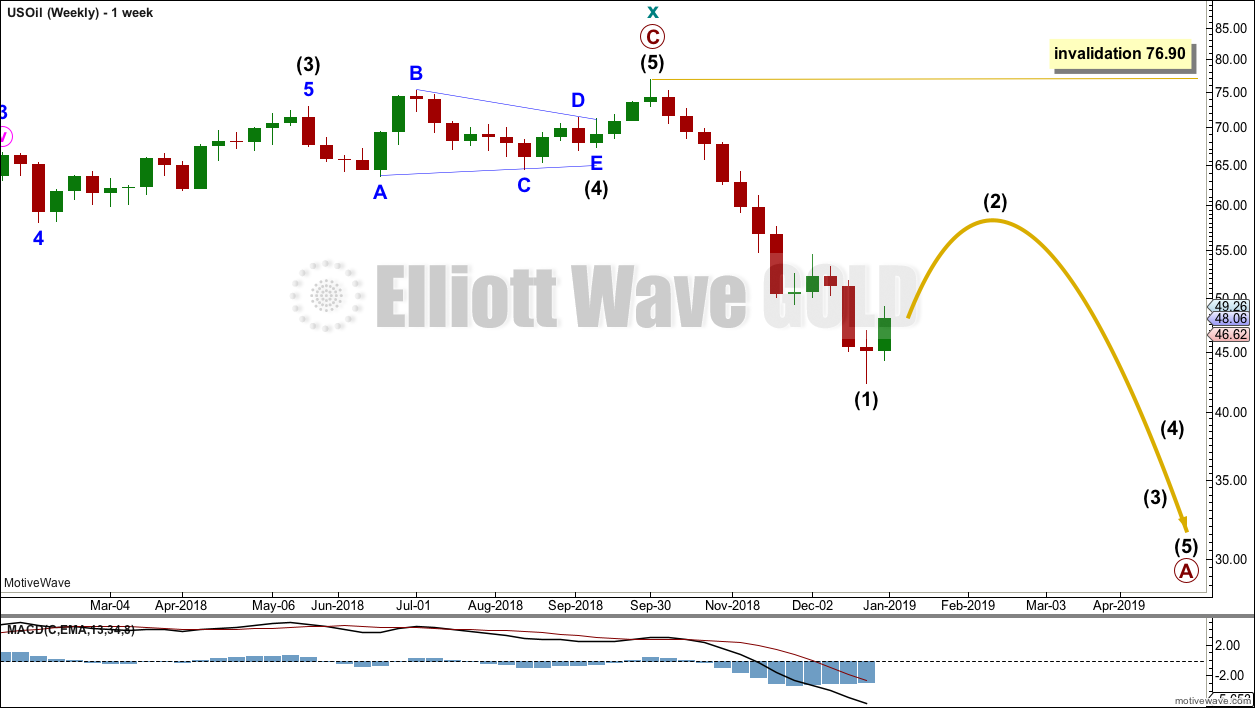
This weekly chart is now focussed on the start of cycle wave y.
Cycle wave y is expected to subdivide as a zigzag. A zigzag subdivides 5-3-5. Primary wave A must subdivide as a five wave structure if this wave count is correct.
Within primary wave A, intermediate wave (1) may now be complete. Intermediate wave (2) may unfold over a few weeks as a sideways choppy consolidation, or a deep sharp bounce.
Intermediate wave (2) may not move beyond the start of intermediate wave (1) above 76.90.
DAILY CHART
Click chart to enlarge.
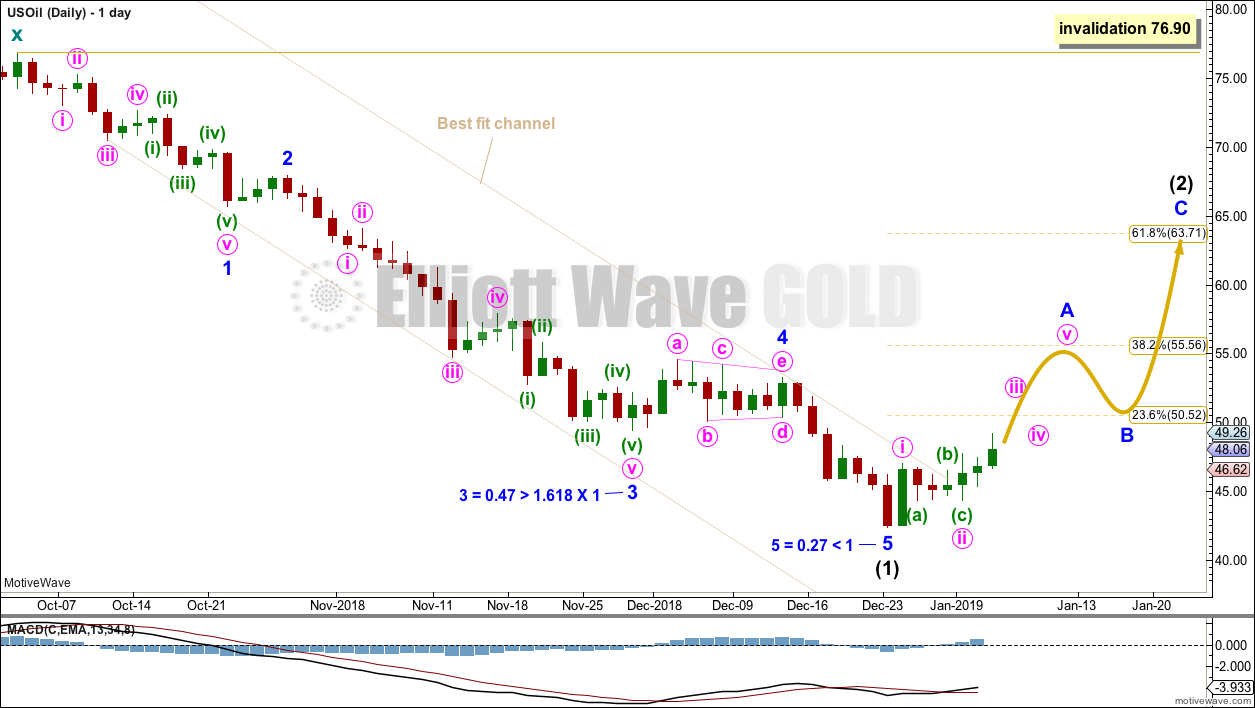
Intermediate wave (2) would most likely subdivide as a zigzag and at this stage that is how it will be labelled. However, it may also subdivide as a flat or combination. It is impossible at this stage to know which structure it will unfold as. The labelling within it will most likely change as it unfolds.
If intermediate wave (2) is unfolding as a zigzag, then within it minor wave A must subdivide as a five wave structure. Within minor wave A, minute waves i and ii may be complete. Minute wave iii has now moved above the end of minute wave i. When minute wave iv unfolds it must remain above minute wave i price territory at 47.00.
For the very short term, no invalidation points within intermediate wave (2) are given on this chart because it is not possible to know which structure may be unfolding. Flexibility is essential when corrections unfold.
Intermediate wave (2) may be very deep. It should last at least four weeks, so that it shows up on the monthly chart.
Intermediate wave (2) may not move beyond the start of intermediate wave (1) above 76.90.
TECHNICAL ANALYSIS
MONTHLY CHART
Click chart to enlarge. Chart courtesy of StockCharts.com.
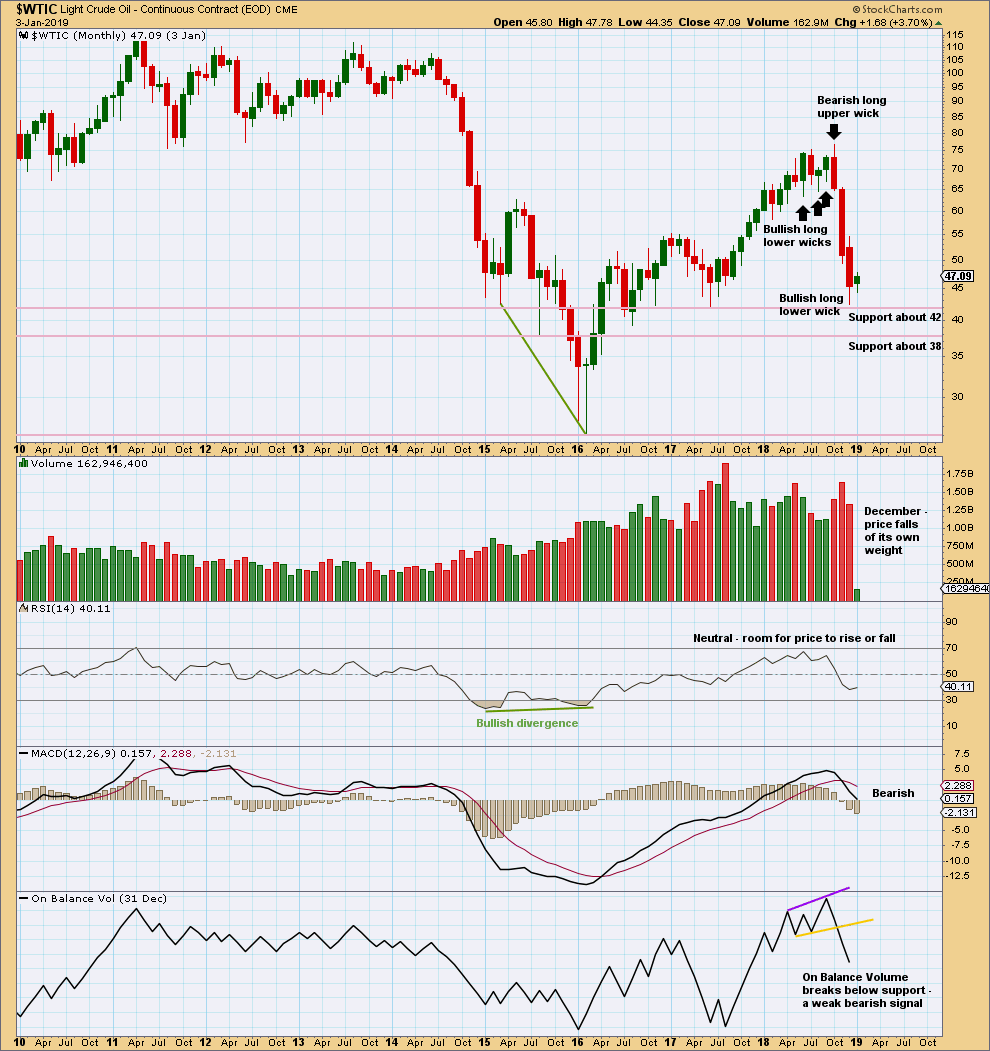
Lower volume and a slightly bullish long lower wick for December add a little support to the Elliott wave count.
WEEKLY CHART
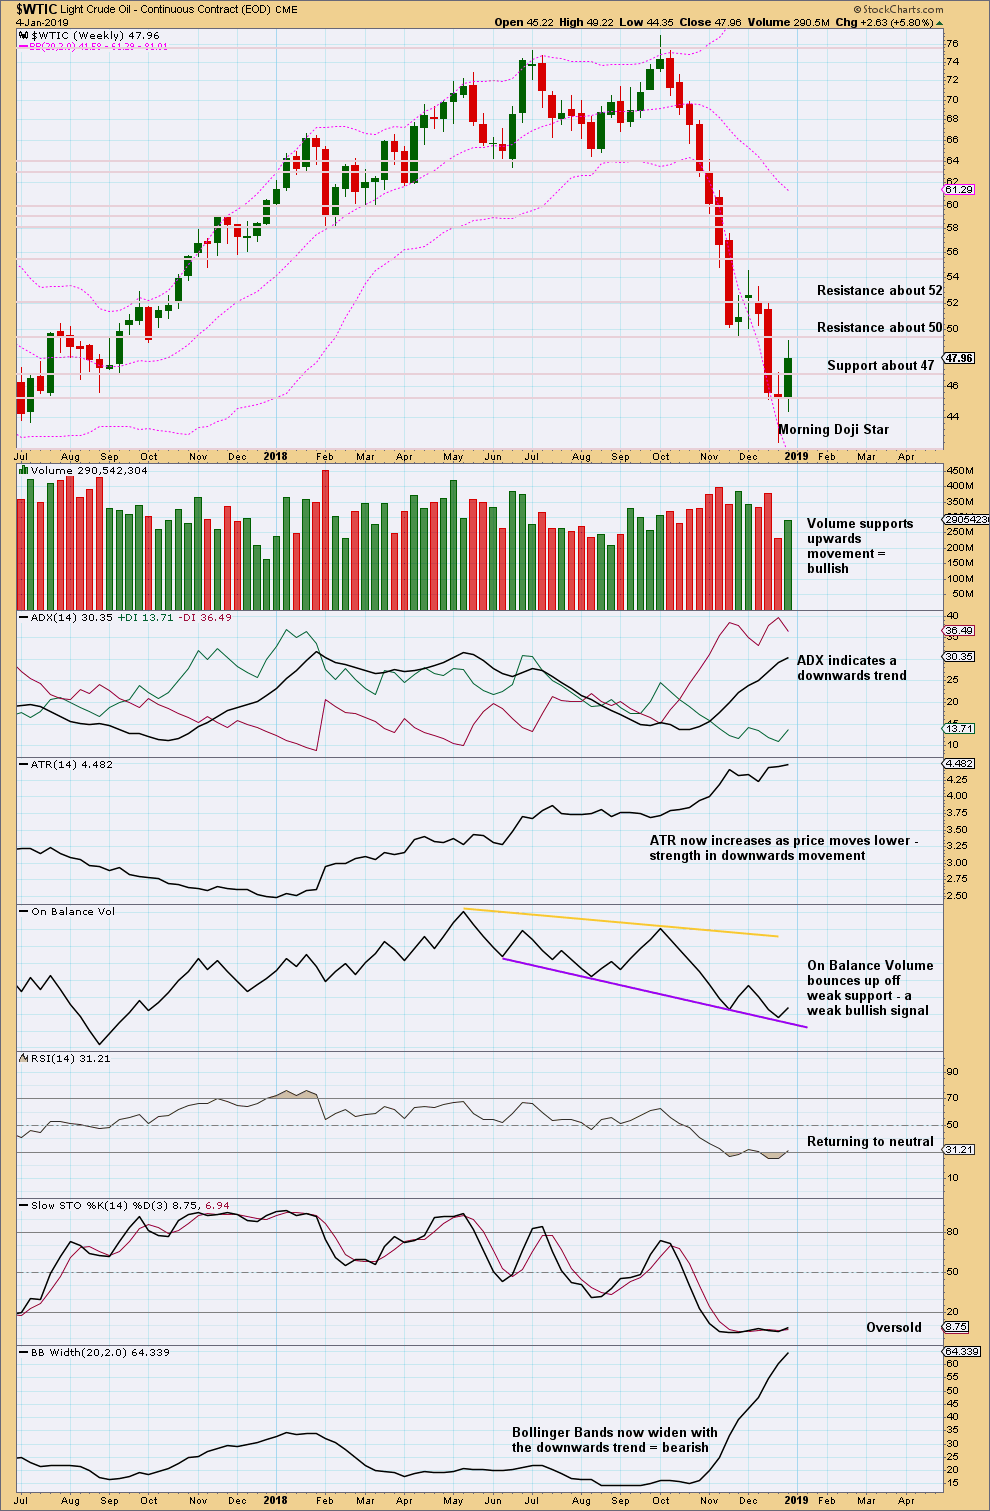
Click chart to enlarge. Chart courtesy of StockCharts.com.
The Morning Doji Star is a bullish reversal pattern. With support from volume for the upwards week, this adds confidence that a low may be in place at least for the short to mid term.
DAILY CHART
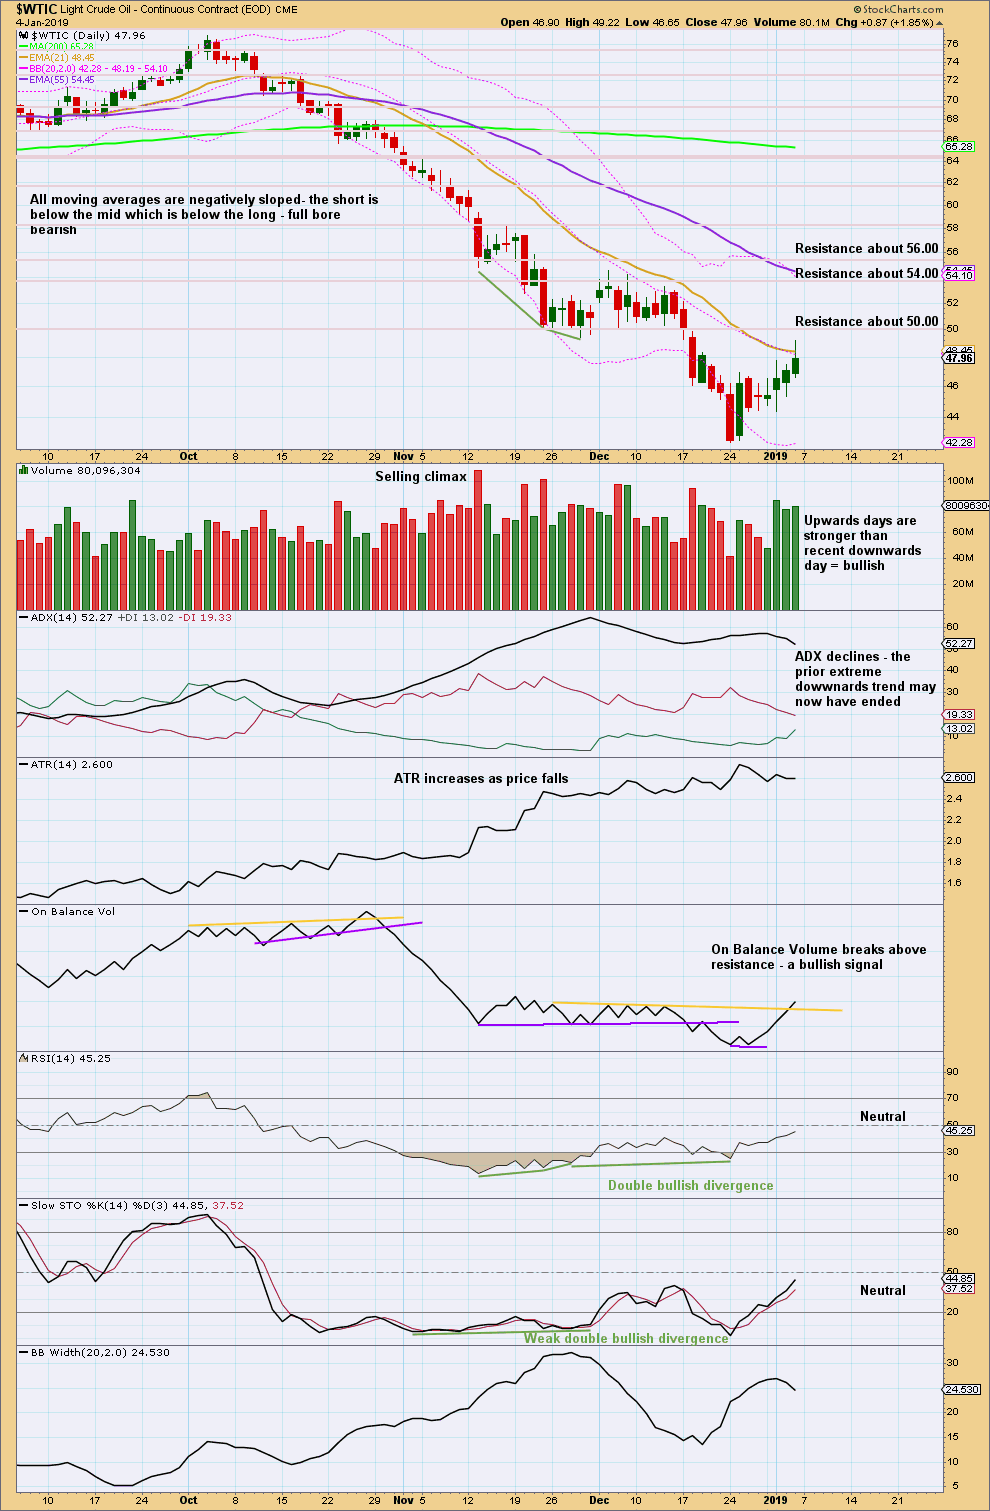
Click chart to enlarge. Chart courtesy of StockCharts.com.
This chart overall supports the Elliott wave count.
Published @ 07:39 p.m. EST.
—
Careful risk management protects your trading account(s).
Follow my two Golden Rules:
1. Always trade with stops.
2. Risk only 1-5% of equity on any one trade.
Happy New Year Lara!
You posted an analysis of the S&P Oil and Gas Index XOP at my request last year. I very much appreciate that work! I recently established a leveraged position after xop bottomed. The wave count for oil changed. XOP is technically a different market than oil. Do you have any change In view of xop since posting it last year. I am in a profitable position and I’m trying to develop a rational exit point. I need to make more to pay for my two little ones education. Thanks in advance for your help.
Happy New Year to you too.
Weekly XOP:
Looking at the bigger picture, the downwards trend to the end of December 2018 was strong. This bounce may not be done, but it may be a bounce within an ongoing downwards trend.
Resistance lines are indicated on the chart. Next resistance about 31.70. Then 33, then about 36.50.
For the shorter term Stochastics gave a bullish signal one week ago when the short term line crossed above the longer term line. Coming from oversold this is a reasonable bullish signal.
This bounce is bringing RSI up from oversold. When it is done, there will again be room for price to fall.
I would be looking for one or both of the following to indicate this bounce is completed:
– a candlestick reversal pattern
– Stochastics short trend line crossing below the longer trend line
At the daily chart level Stochastics is now overbought.
I would look for divergence between price and Stochastics at this time frame to indicate a possible high in place. Or a strong bearish candlestick reversal pattern.
Neither of those are present today. I would expect this bounce to continue. More resistance lines are noted on the chart.
Hi Lara,
Many thanks for your current view of xop and tips for developing exit points.
-Andy