
Last week’s analysis for Silver expected more downwards movement. A lower low and lower high for the week fits expectations.
Summary: A trend change may have occurred for Silver. Reasonable confidence in a trend change may be had with a new low below 15.169.
The next target is now at 10.02.
Monthly charts were reviewed here.
New updates to this analysis are in bold.
ELLIOTT WAVE COUNTS
MAIN WAVE COUNT
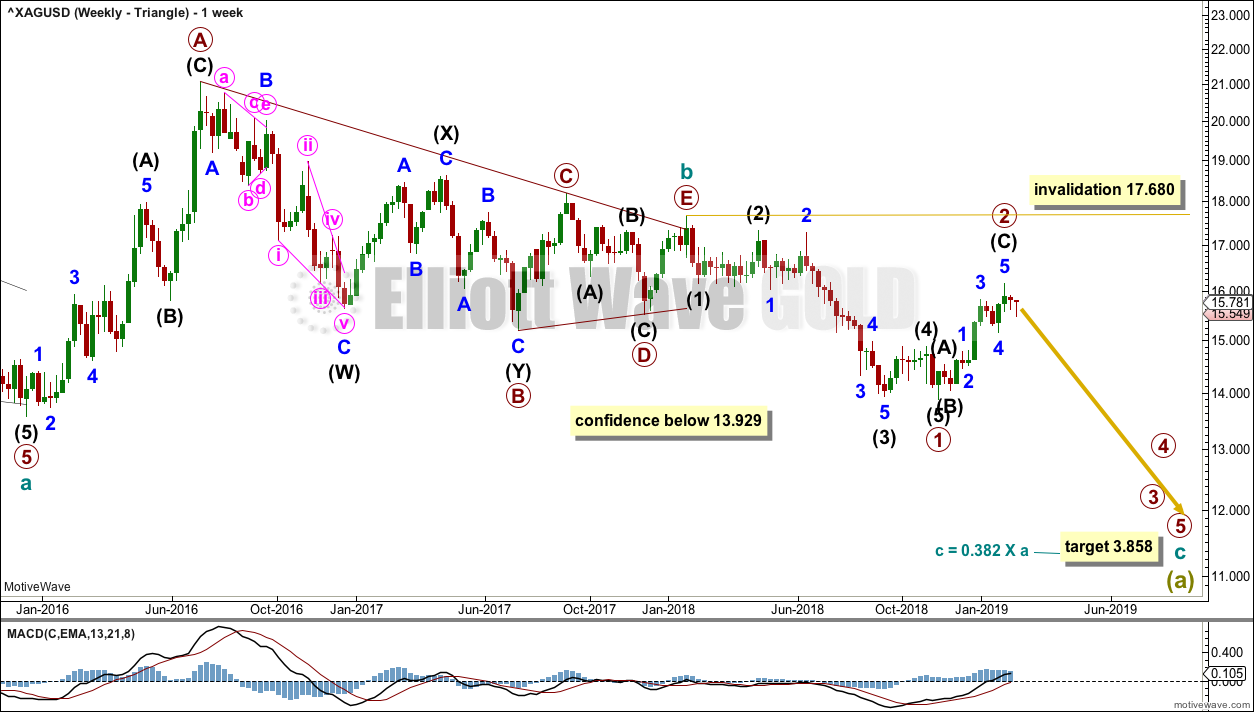
WEEKLY CHART – TRIANGLE
Click chart to enlarge.
This first wave count has good support from classic technical analysis, so it will be favoured. This wave count looks likely.
The first wave count expects that the bear market, which began from the April 2011 high, is incomplete.
Cycle wave a is seen as a five wave impulse for this main wave count.
This first weekly chart sees cycle wave b as a now possibly complete regular contracting triangle.
Primary wave E of the triangle may have ended with an overshoot of the A-C trend line.
Within cycle wave c, primary waves 1 and 2 may now both be complete.
If it continues higher, then primary wave 2 may not move beyond the start of primary wave 1 above 17.680.
Cycle wave c needs to move below the end of cycle wave a below 13.569 in order to avoid a truncation.
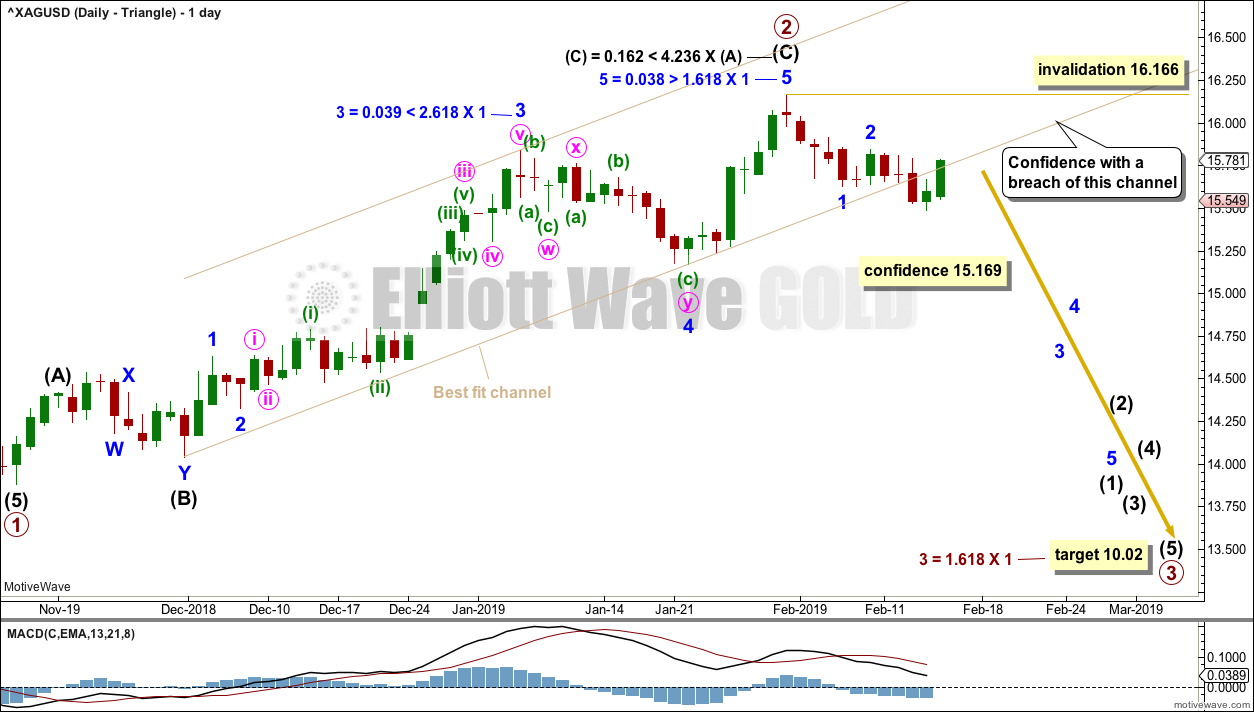
DAILY CHART – TRIANGLE
Click chart to enlarge.
Primary wave 2 may now be a complete zigzag. There are Fibonacci ratios between intermediate waves (A) and (C) and between all of minor waves 1, 3 and 5 within intermediate wave (C).
A best fit channel is drawn about primary wave 2. If price breaks below the lower edge of that channel, then some confidence that a high is in place may be had.
A new low now below 15.169 could not be a second wave correction within minor wave 5, so at that stage minor wave 5 would have to be over. That would add confidence in a trend change.
A target is calculated for primary wave 3 to reach the most common Fibonacci ratio to primary wave 1.
Primary wave 3 may only subdivide as an impulse. Within primary wave 3, intermediate wave (1) may be incomplete. Within intermediate wave (1), minor waves 1 and 2 may be complete. If it continues higher, then minor wave 2 may not move beyond the start of minor wave 1 above 16.166.
ALTERNATE WAVE COUNT
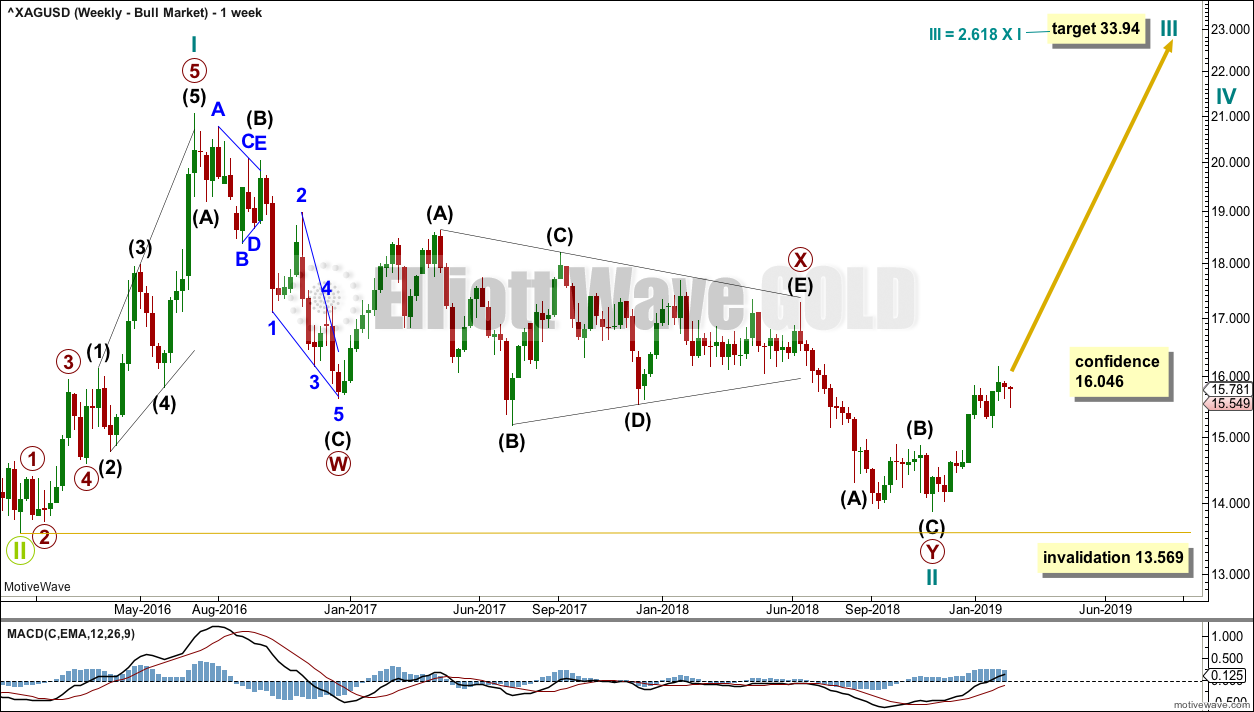
WEEKLY CHART – BULL WAVE COUNT
Click chart to enlarge.
Cycle wave II may be a complete double zigzag. Cycle wave II would be very deep at 0.96 of cycle wave I. This is typical behaviour for the first second wave correction within a new trend for commodities.
If it continues any further, then cycle wave II may not move beyond the start of cycle wave I below 13.569.
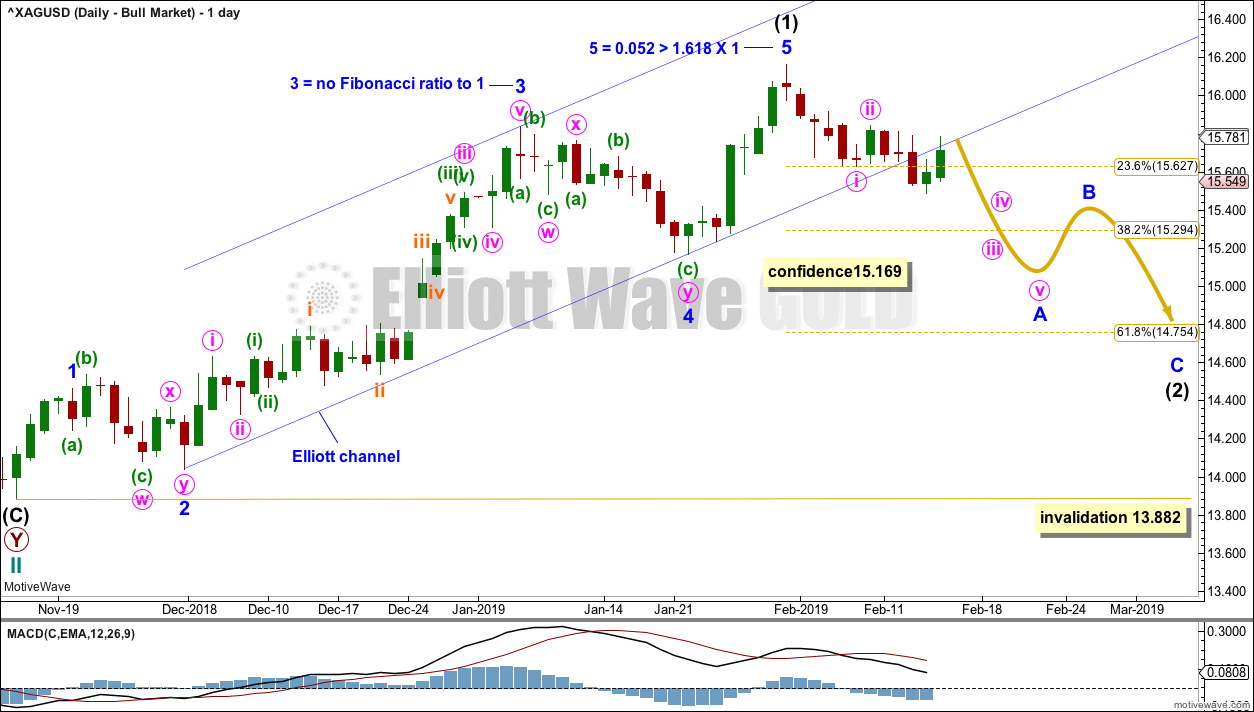
DAILY CHART – BULL WAVE COUNT
Click chart to enlarge.
If cycle wave II is over, then the new trend up for cycle wave III should begin with a five wave structure. This is labelled intermediate wave (1). The structure may now be complete.
Intermediate wave (2) may unfold over a few weeks. The most likely target for it would be the 0.618 Fibonacci ratio of intermediate wave (1).
Intermediate wave (2) may not move beyond the start of intermediate wave (1) below 13.882.
Intermediate wave (2) would most likely subdivide as a zigzag, but it may be any corrective structure except a triangle. It will be labelled as a possible zigzag.
Within the zigzag, minor wave A must subdivide as a five wave structure. Within minor wave A, minute waves i and ii may be complete. If it continues higher, then minute wave ii may not move beyond the start of minute wave i above 16.166. A new high above 16.166 would indicate intermediate wave (2) may not be a zigzag. If that happens, it may then be relabelled as a flat or combination.
TECHNICAL ANALYSIS
WEEKLY CHART
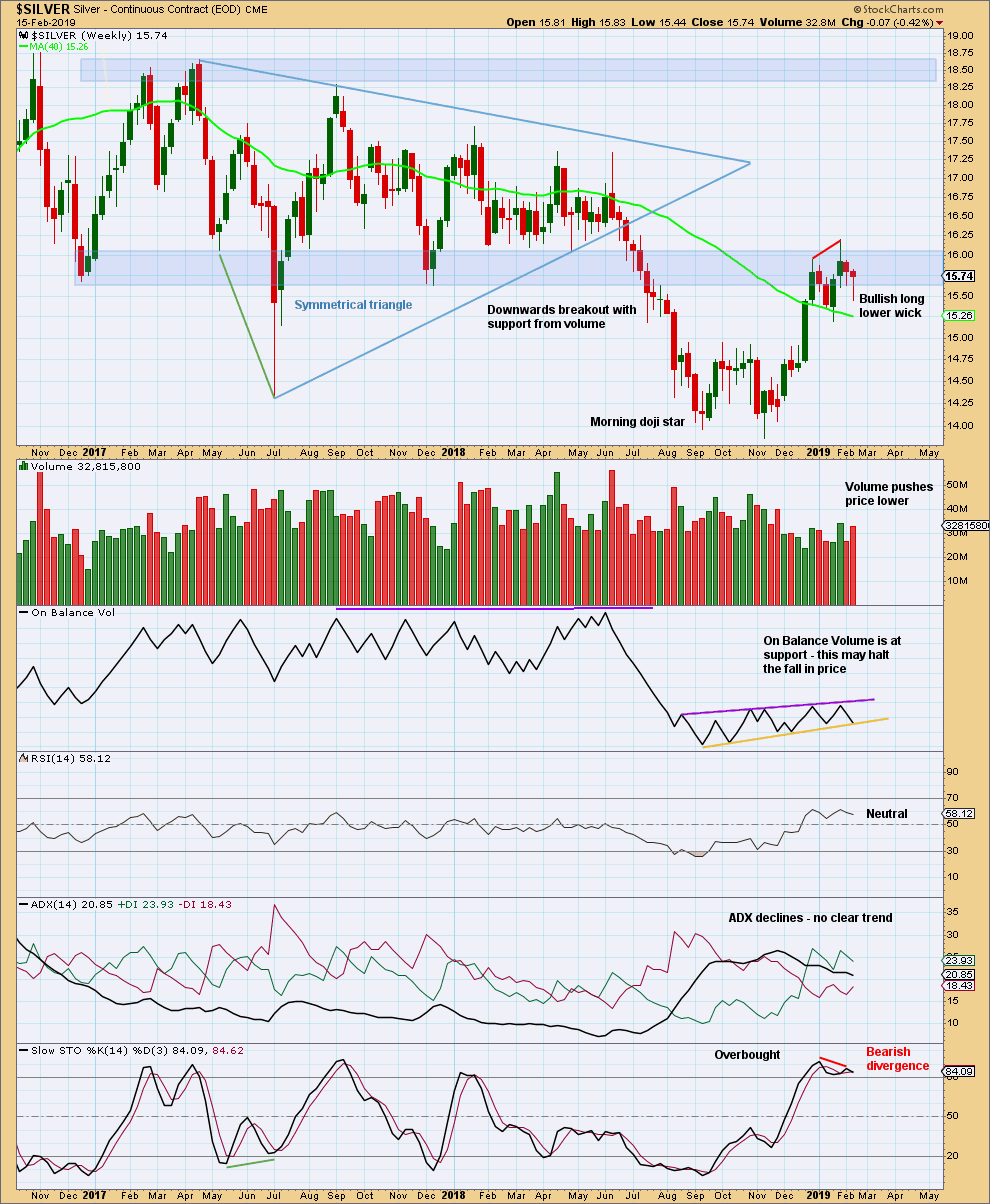
Click chart to enlarge. Chart courtesy of StockCharts.com.
Price is still within a strong zone of resistance and Stochastics is overbought and exhibiting bearish divergence. Caution is indicated with this upwards trend; look for reversal signals.
DAILY CHART
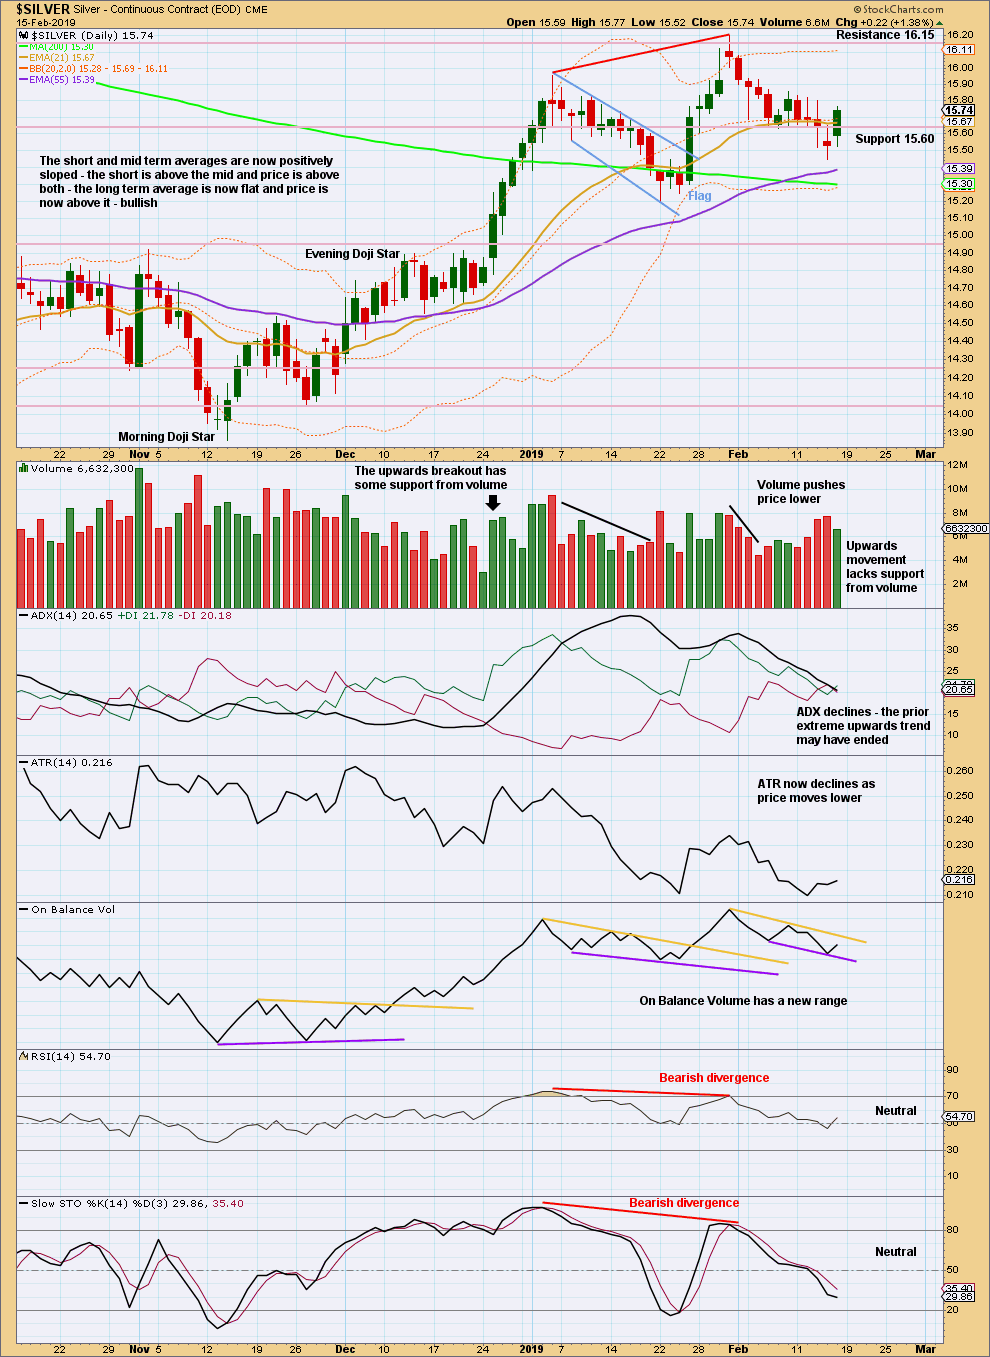
Click chart to enlarge. Chart courtesy of StockCharts.com.
With ADX indicating an extreme upwards trend and both of Stochastics and RSI exhibiting bearish divergence at the last high, look out for a possible trend change here.
The short-term volume profile is bearish.
Published @ 01:47 p.m. EST on February 17, 2019.
—
Careful risk management protects your trading account(s).
Follow my two Golden Rules:
1. Always trade with stops.
2. Risk only 1-5% of equity on any one trade.