
A very slight new high for the week sees targets slightly adjusted for Silver. The short-term expectation for next week’s direction is the same for both Elliott wave counts. This is supported by classic technical analysis.
Summary: Downwards movement is expected for next week.
The next target is now at 10.05.
Monthly charts were reviewed here.
New updates to this analysis are in bold.
ELLIOTT WAVE COUNTS
MAIN WAVE COUNT
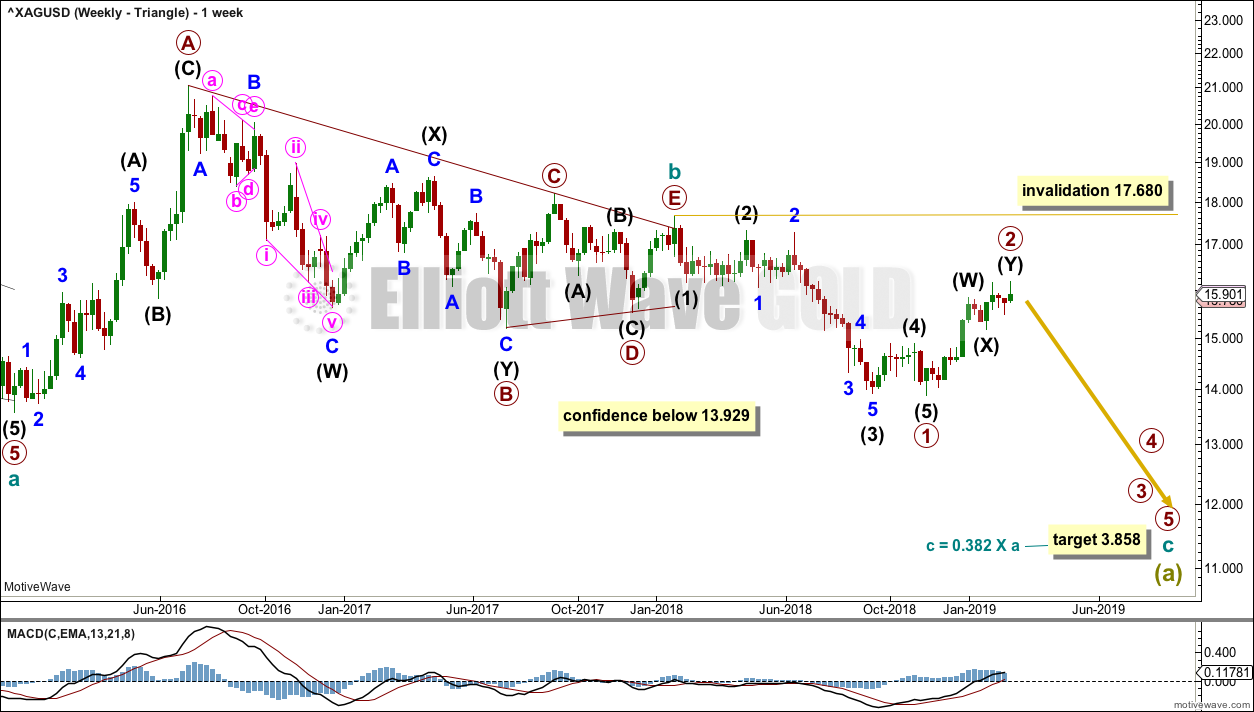
WEEKLY CHART – TRIANGLE
Click chart to enlarge.
This first wave count has good support from classic technical analysis, so it will be favoured. This wave count looks likely.
The first wave count expects that the bear market, which began from the April 2011 high, is incomplete.
Cycle wave a is seen as a five wave impulse for this main wave count.
This first weekly chart sees cycle wave b as a now possibly complete regular contracting triangle.
Primary wave E of the triangle may have ended with an overshoot of the A-C trend line.
Within cycle wave c, primary waves 1 and 2 may now both be complete.
If it continues higher, then primary wave 2 may not move beyond the start of primary wave 1 above 17.680.
Cycle wave c needs to move below the end of cycle wave a below 13.569 in order to avoid a truncation.
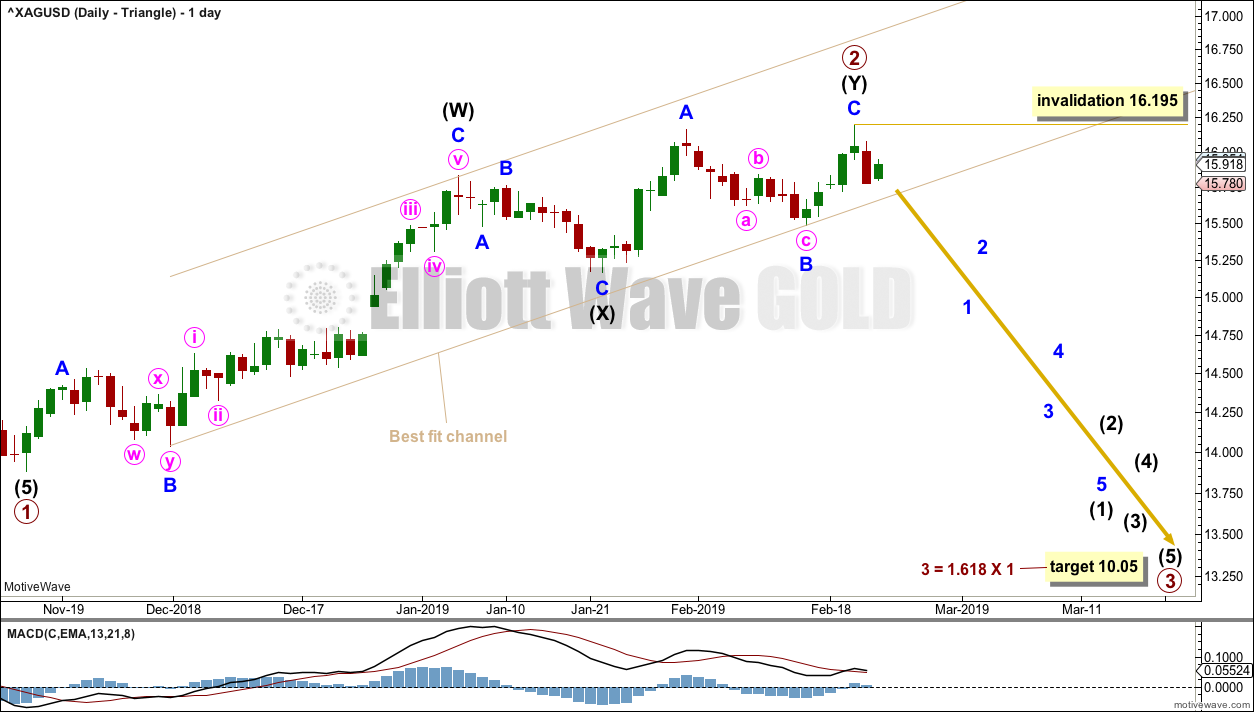
DAILY CHART – TRIANGLE
Click chart to enlarge.
A slight new high requires primary wave 2 to be reanalysed. The new high this week may have been the end of a double zigzag for primary wave 2, which is a reasonably common structure for second waves. The subdivisions fit neatly at the daily chart level.
A channel is drawn about primary wave 2 to contain the whole movement and be most conservative. If this channel is breached by downwards movement (not sideways), that would add confidence to this wave count and the idea of a high in place.
A target is calculated for primary wave 3 to reach the most common Fibonacci ratio to primary wave 1.
Primary wave 3 may only subdivide as an impulse. Within primary wave 3, intermediate wave (1) may be incomplete. Within intermediate wave (1), minor wave 2 may not move beyond the start of minor wave 1 above 16.195.
ALTERNATE WAVE COUNT
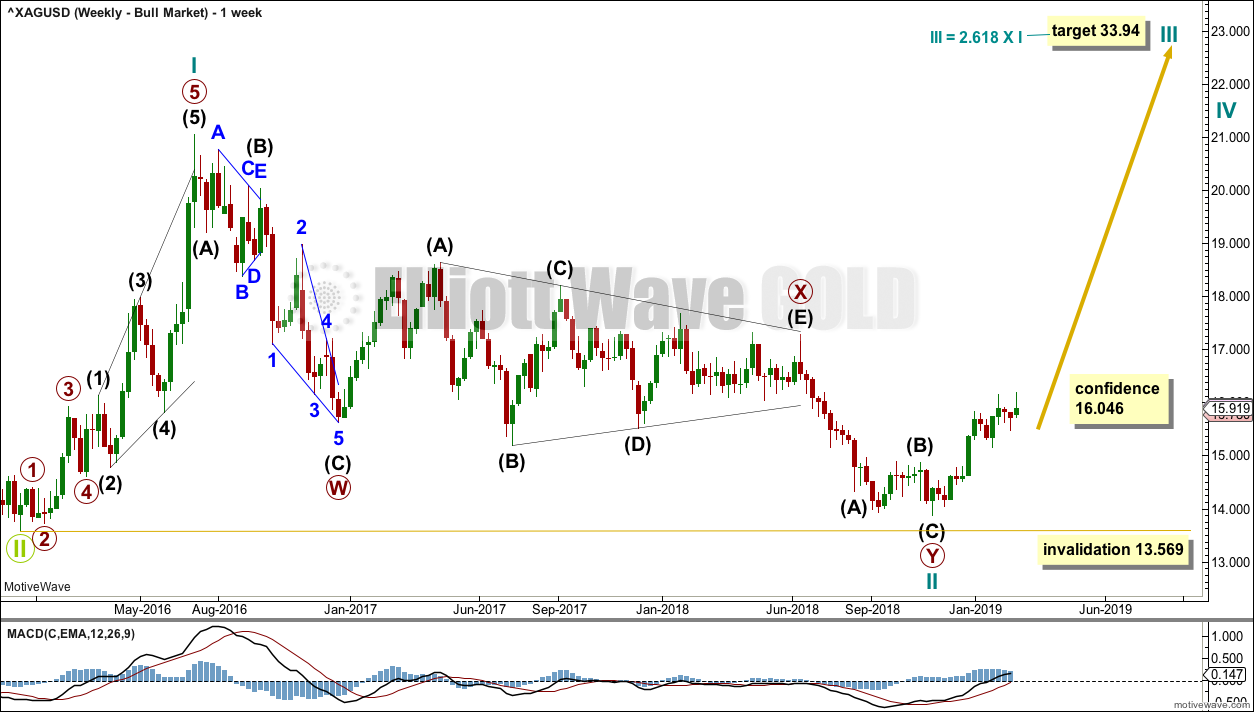
WEEKLY CHART – BULL WAVE COUNT
Click chart to enlarge.
Cycle wave II may be a complete double zigzag. Cycle wave II would be very deep at 0.96 of cycle wave I. This is typical behaviour for the first second wave correction within a new trend for commodities.
If it continues any further, then cycle wave II may not move beyond the start of cycle wave I below 13.569.
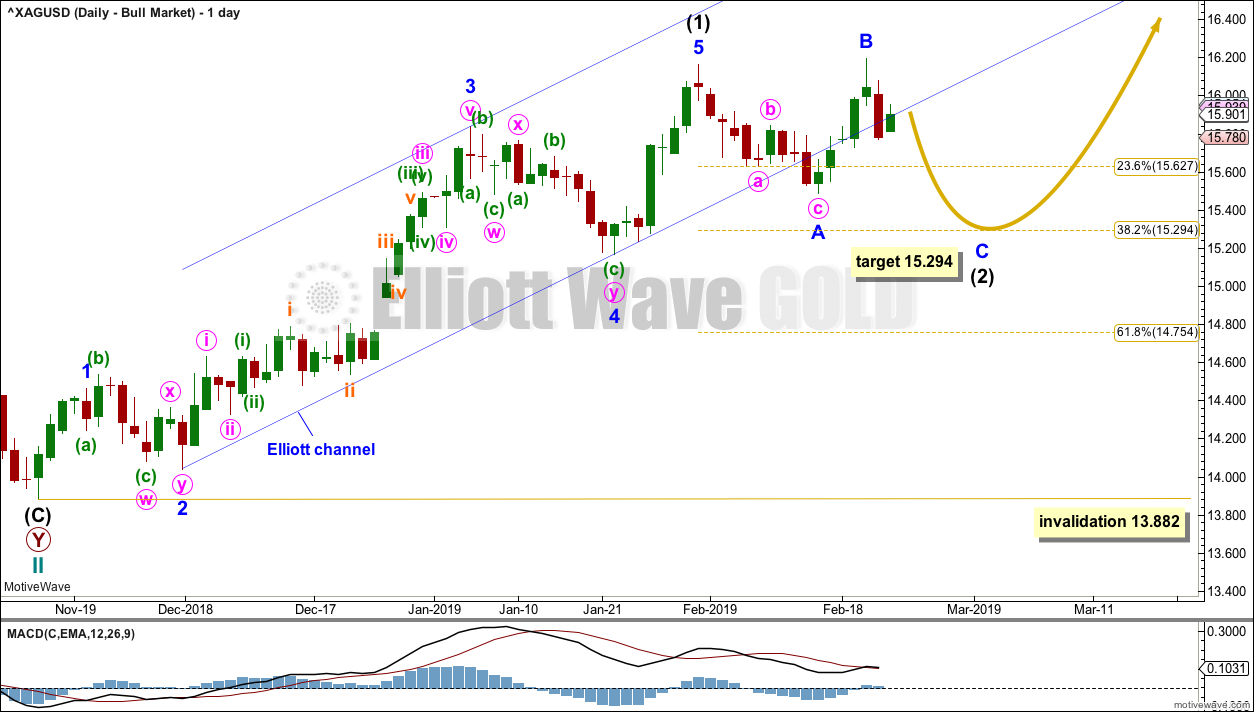
DAILY CHART – BULL WAVE COUNT
Click chart to enlarge.
If cycle wave II is over, then the new trend up for cycle wave III should begin with a five wave structure. This is labelled intermediate wave (1). The structure may now be complete.
Intermediate wave (2) may unfold over a few weeks. The most likely target for it would be the 0.618 Fibonacci ratio of intermediate wave (1).
Intermediate wave (2) may not move beyond the start of intermediate wave (1) below 13.882.
Intermediate wave (2) would most likely subdivide as a zigzag, but it may be any corrective structure except a triangle; it is labelled this week as a possible regular flat correction.
Regular flats most commonly exhibit C waves which are about even in length with their A waves. Minor wave C should be expected to end at least slightly below the end of minor wave A at 15.487, so that a truncation is avoided. Intermediate wave (2) may end about the 0.382 Fibonacci ratio of intermediate wave (1).
It is still not possible to have full confidence in the structure for intermediate wave (2) for this wave count. It is entirely possible that labelling within it may again change as it continues. Focus should be not on what structure intermediate wave (2) is and identifying the smaller movements within it, but instead focus should be on identifying when this correction may be complete and the trend may then resume.
TECHNICAL ANALYSIS
WEEKLY CHART
Click chart to enlarge. Chart courtesy of StockCharts.com.
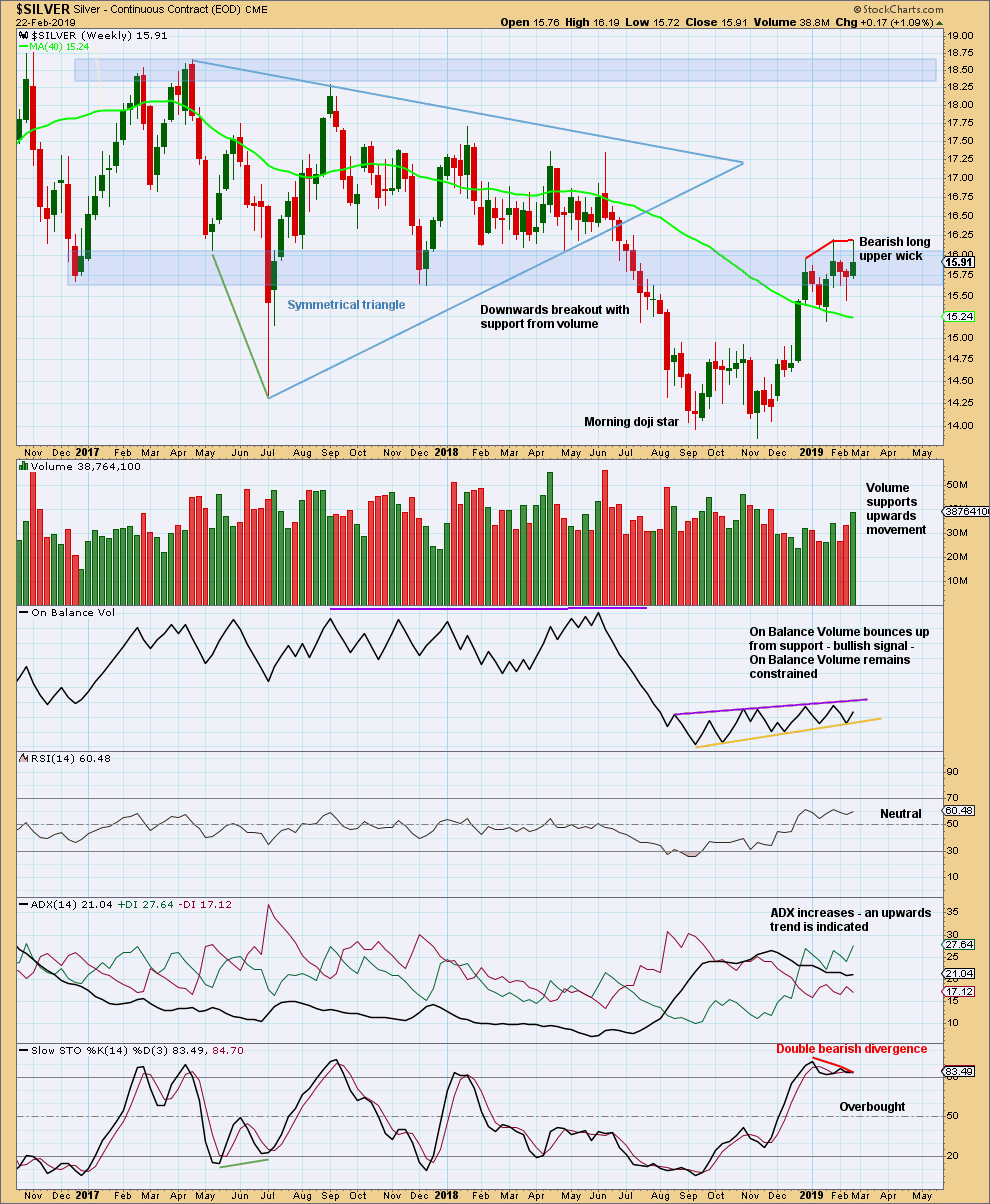
Price is still within a strong zone of resistance and Stochastics is overbought and exhibiting bearish divergence. Caution is indicated with this upwards trend; look for reversal signals.
This week may have seen a high. The long upper wick and now double bearish divergence indicate this is possible.
DAILY CHART
Click chart to enlarge. Chart courtesy of StockCharts.com.
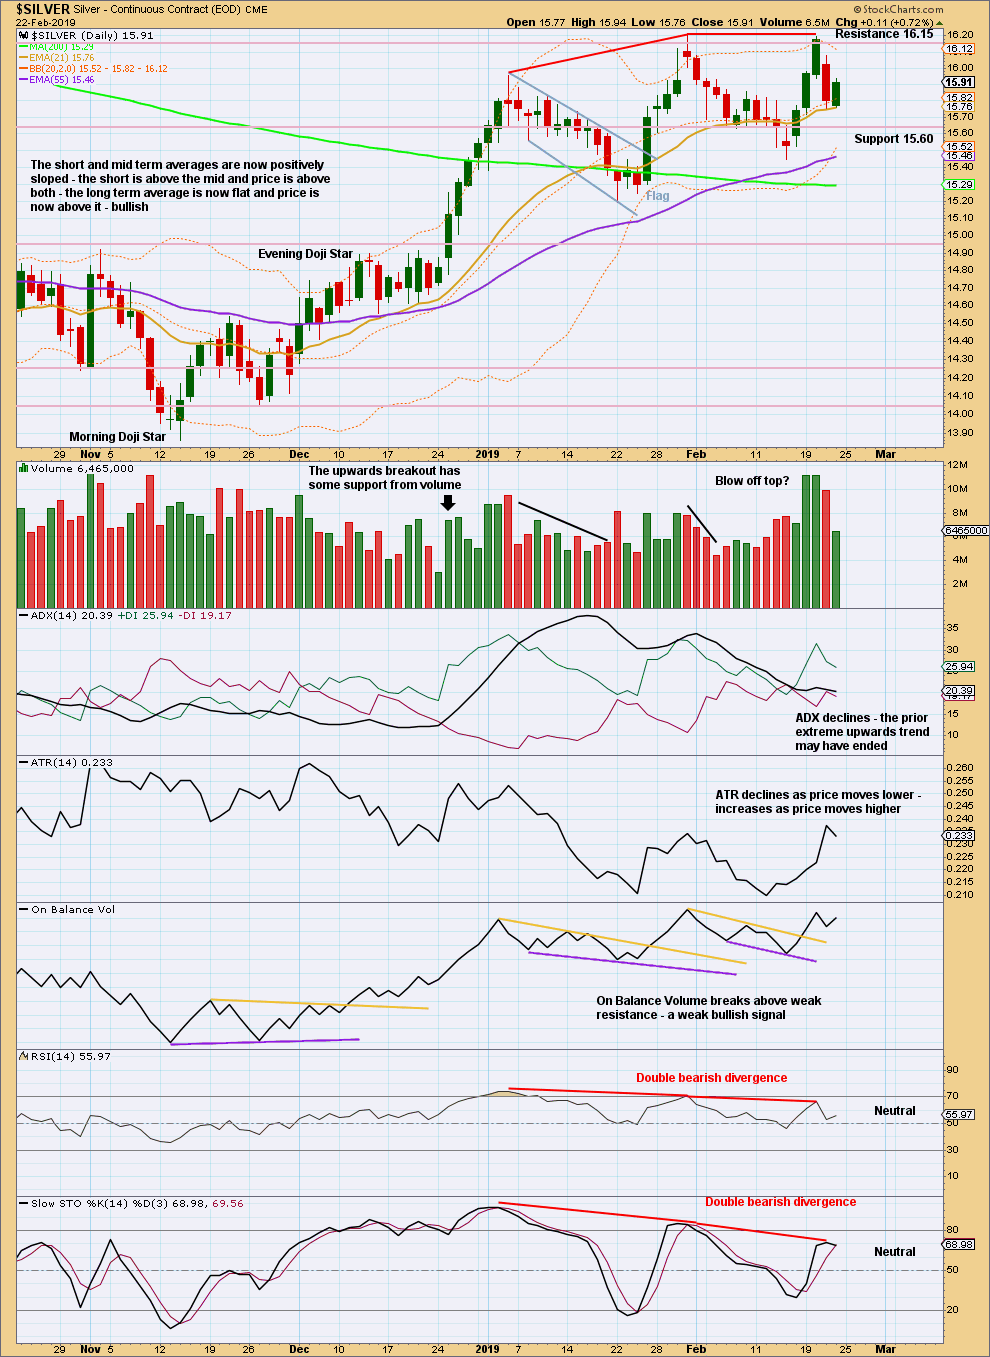
A double top may have formed. With Stockcharts data, the high of 31st of January was at 16.20 and now the high of 20th of February is also 16.20.
ADX indicates the upwards trend may be over. Double bearish divergence between price and both of RSI and Stochastics supports this view.
Overall, this chart supports the Elliott wave analysis.
The short-term volume profile is bearish.
Published @ 02:51 a.m. EST on February 24, 2019.
—
Careful risk management protects your trading account(s).
Follow my two Golden Rules:
1. Always trade with stops.
2. Risk only 1-5% of equity on any one trade.