
Last end of week analysis for US Oil expected this week to see the upwards bounce continue towards the target. This is exactly what has happened. The small target zone remains unchanged this week.
Summary: The upwards bounce may continue to the final target zone about 63.19 to 63.71. This target may be met in another three to five weeks.
However, there is now reasonable weakness in upwards movement, and it shows some weakness. Look out for a possible earlier than expected end to this bounce. If a candlestick reversal pattern is printed, or price breaks below the blue channel on the daily Elliott wave chart, then assume a third wave down has just begun.
The larger picture still sees Oil in a new downwards trend to end reasonably below 26.06.
New updates to this analysis are in bold.
MAIN ELLIOTT WAVE COUNT
MONTHLY CHART
Click chart to enlarge.
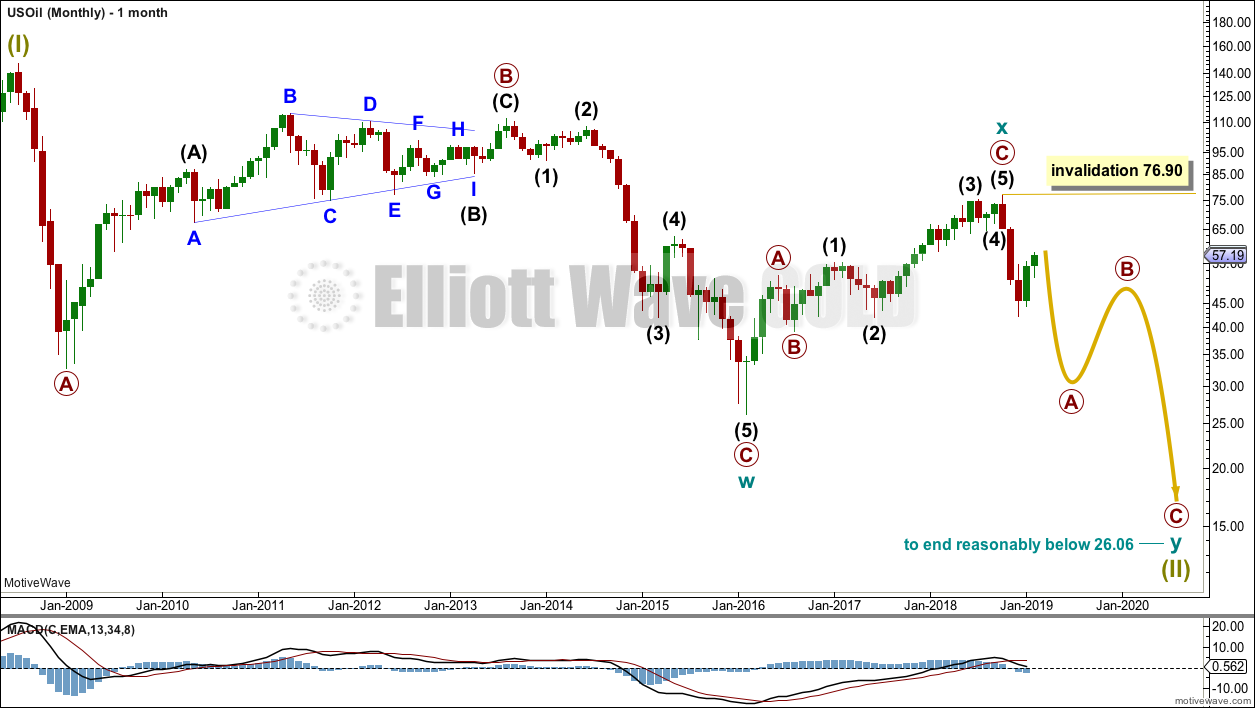
Classic technical analysis favours a bearish wave count for Oil at this time.
The large fall in price from the high in June 2008 to February 2016 is seen as a complete three wave structure. This large zigzag may have been only the first zigzag in a deeper double zigzag.
The first zigzag down is labelled cycle wave w. The double is joined by a now complete three in the opposite direction, a zigzag labelled cycle wave x.
The purpose of a second zigzag in a double is to deepen the correction when the first zigzag does not move price deep enough. Cycle wave y would be expected to move reasonably below the end of cycle wave w to deepen the correction. Were cycle wave y to reach equality with cycle wave w that takes Oil into negative price territory, which is not possible. Cycle wave y would reach 0.618 the length of cycle wave w at $2.33.
A better target calculation would be using the Fibonacci ratios between primary waves A and C within cycle wave y. This cannot be done until both primary waves A and B are complete.
Within cycle wave y, no second wave correction nor B wave may move beyond its start above 76.90.
WEEKLY CHART
Click chart to enlarge.
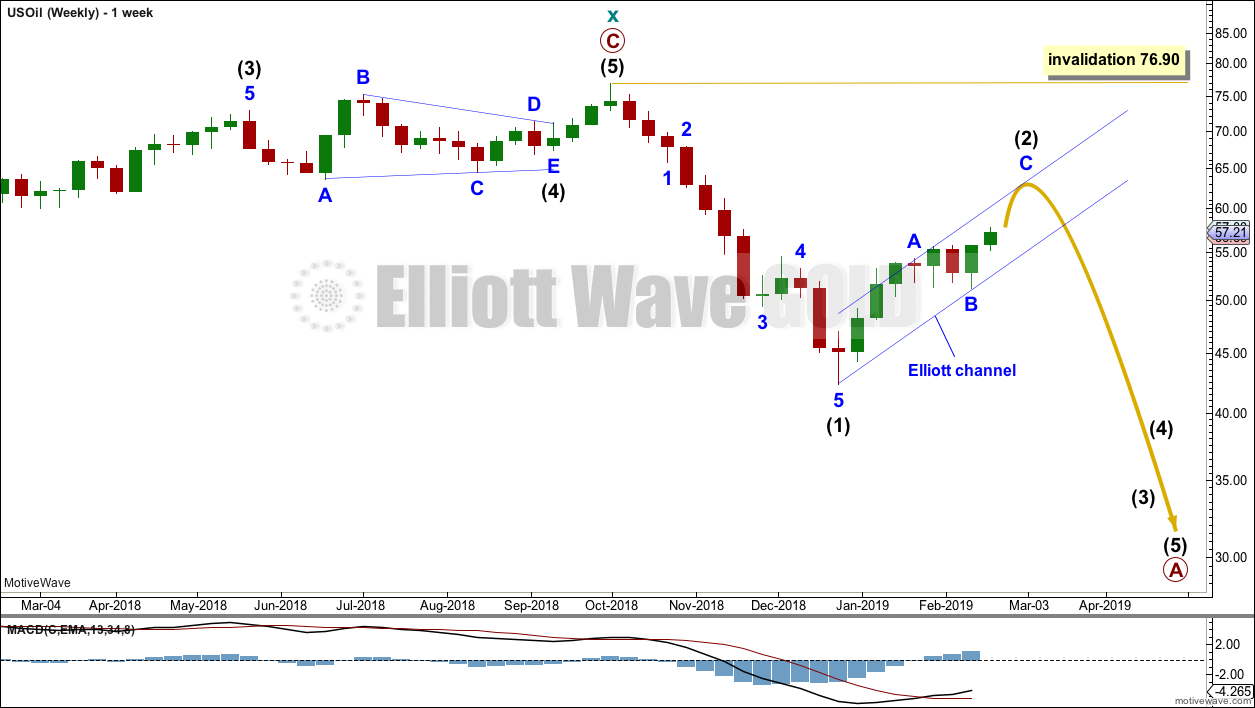
This weekly chart is focussed on the start of cycle wave y.
Cycle wave y is expected to subdivide as a zigzag. A zigzag subdivides 5-3-5. Primary wave A must subdivide as a five wave structure if this wave count is correct.
Within primary wave A, intermediate wave (1) may now be complete. Intermediate wave (2) so far looks like it is unfolding as a zigzag, which is the most common Elliott wave structure for a second wave, and so far it has lasted seven weeks. If it completes in a total Fibonacci thirteen weeks, then it may continue now for a further six weeks. It may however not be as long lasting as that; it may not exhibit a Fibonacci duration.
Intermediate wave (2) may not move beyond the start of intermediate wave (1) above 76.90.
DAILY CHART
Click chart to enlarge.
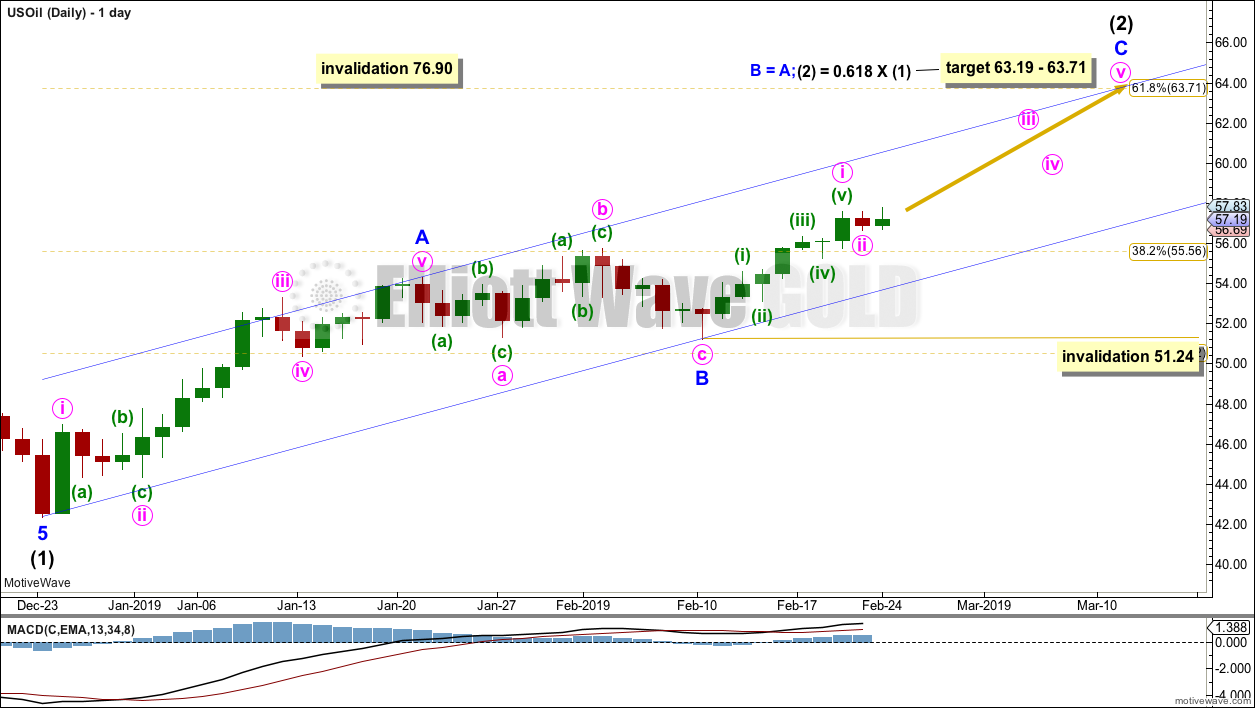
Intermediate wave (2) would most likely subdivide as a zigzag and at this stage that is how it will be labelled, and that is how it looks like it is subdividing. However, it may also subdivide as a flat or combination. It is impossible at this stage to be confident as to which structure it will unfold as. The labelling within it may yet change as it unfolds.
If intermediate wave (2) is unfolding as a zigzag, then within it minor waves A and B may now both be complete.
Another five wave structure upwards for minor wave C may be expected to unfold.
The target is now widened to a small zone calculated at two degrees.
The channel is drawn about intermediate wave (2) using Elliott’s technique for a correction. Any pullbacks along the way up within minor wave C may find support about the lower edge of this channel. Minor wave C may end either mid way within the channel or more likely about the upper edge.
The channel will also be used now to indicate when intermediate wave (2) may possibly be over and intermediate wave (3) downwards may possibly have begun. At this stage, a clear breach of the lower edge of the channel by downwards movement (not sideways) may be taken as the earliest warning that intermediate wave (2) could be over. This may be an indication of a trend change even if the target is not met.
Within minor wave C, minute wave ii may not move beyond the start of minute wave i below 51.24.
Intermediate wave (2) may be very deep.
Intermediate wave (2) may not move beyond the start of intermediate wave (1) above 76.90.
At the end of this week, the alternate wave count is now discarded based upon a very low probability.
TECHNICAL ANALYSIS
MONTHLY CHART
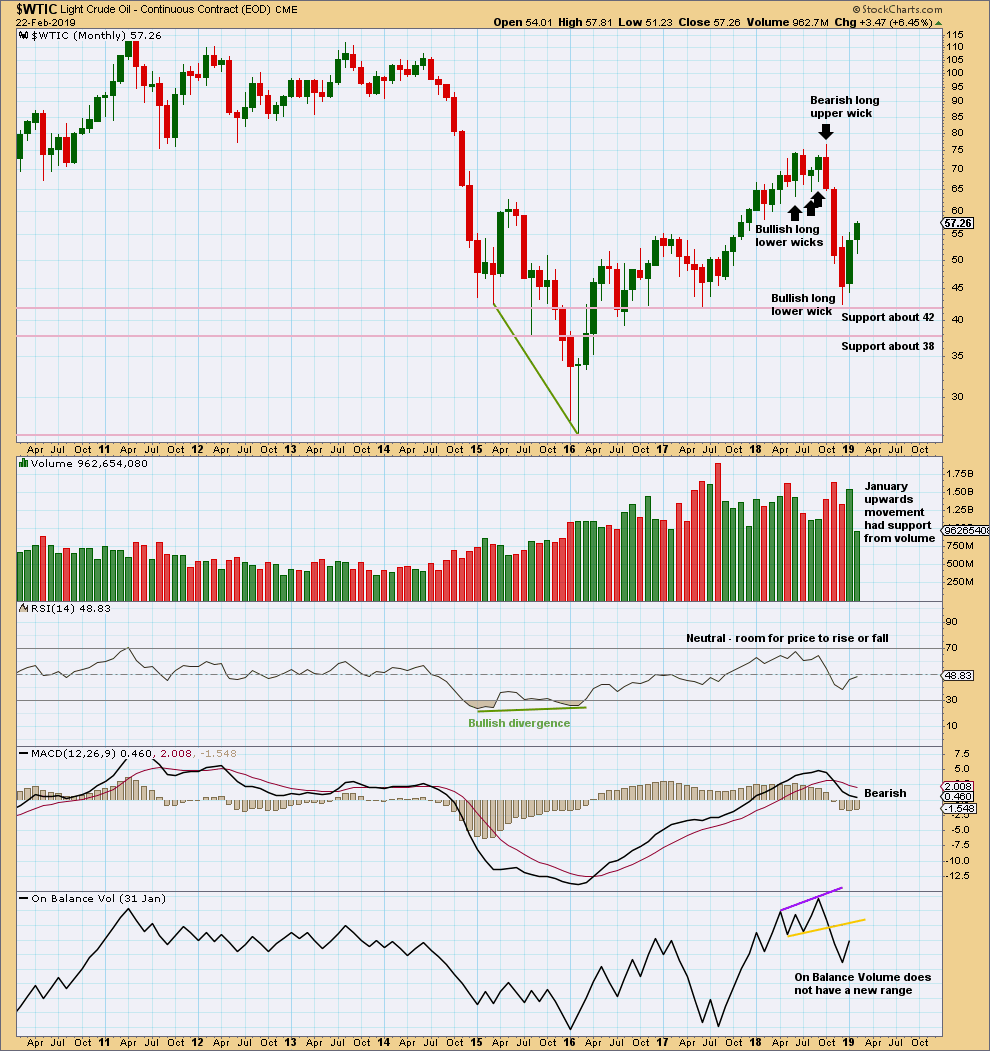
Click chart to enlarge. Chart courtesy of StockCharts.com.
Upwards movement within January has support from volume. This supports the Elliott wave count which expects overall more upwards movement in coming weeks.
WEEKLY CHART
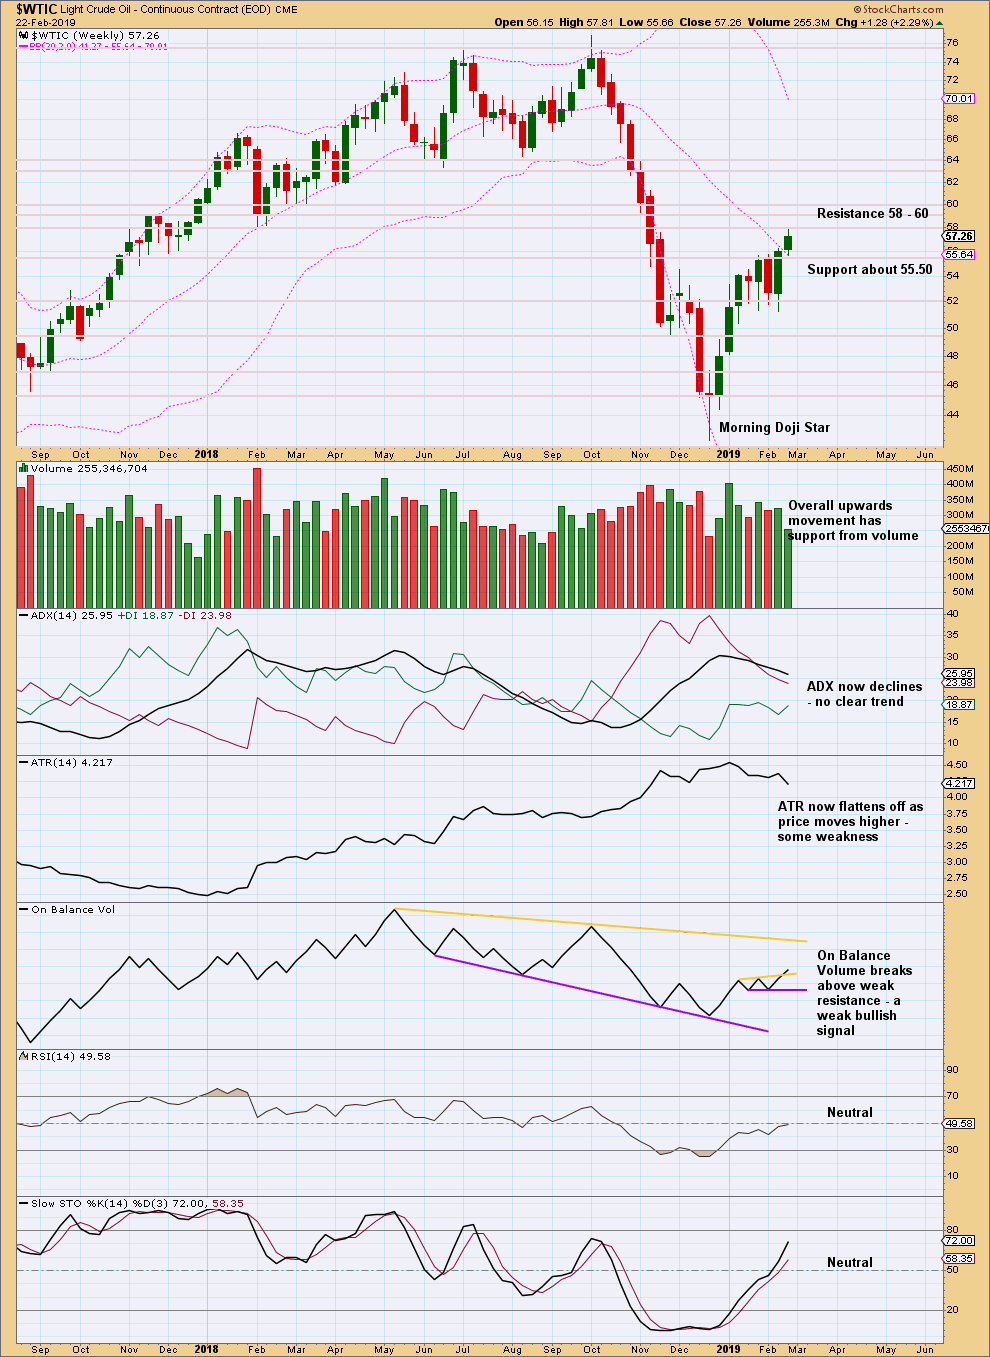
Click chart to enlarge. Chart courtesy of StockCharts.com.
A small range week, which lacks support from volume, sees price close at resistance and this is concerning for bulls. Although there is room for this counter trend bounce to continue until Stochastics reaches overbought, look out for a possible earlier than expected end.
DAILY CHART
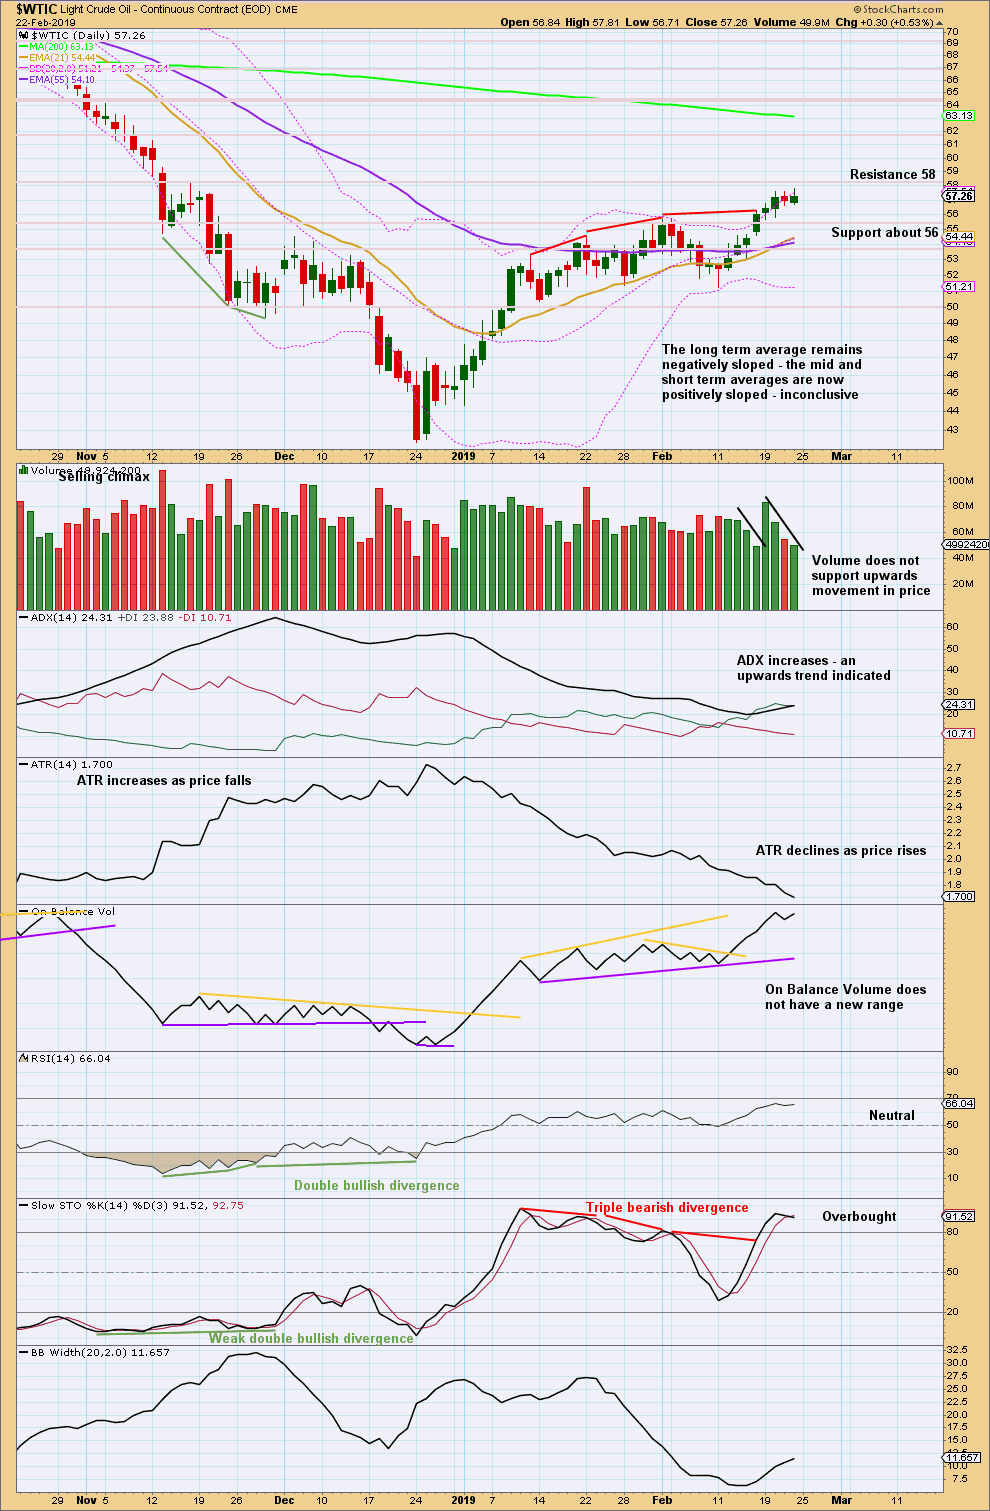
Click chart to enlarge. Chart courtesy of StockCharts.com.
Upwards movement shows weakness. Look out for a possible trend change. This counter trend bounce may end within current resistance. If a bearish candlestick reversal pattern is formed, that may be taken as an indication the bounce could be over.
Published @ 06:03 p.m. EST.
—
Careful risk management protects your trading account(s).
Follow my two Golden Rules:
1. Always trade with stops.
2. Risk only 1-5% of equity on any one trade.
Lara, your analysis in gold and (especially) crude oil are outstanding! My trading results over the last year have improved dramatically. Thank you.
RKB
Thank you so much for letting me know! It’s always great to have some positive feedback.
I think we may have seen a turn in Oil. Looks like five waves down. Let’s wait for the 3 up.
Price remains within the blue channel. Assume the trend remains the same while it continues to find support there.
I’m going to label minor C still as incomplete, and the last little pullback just minute ii within it.