
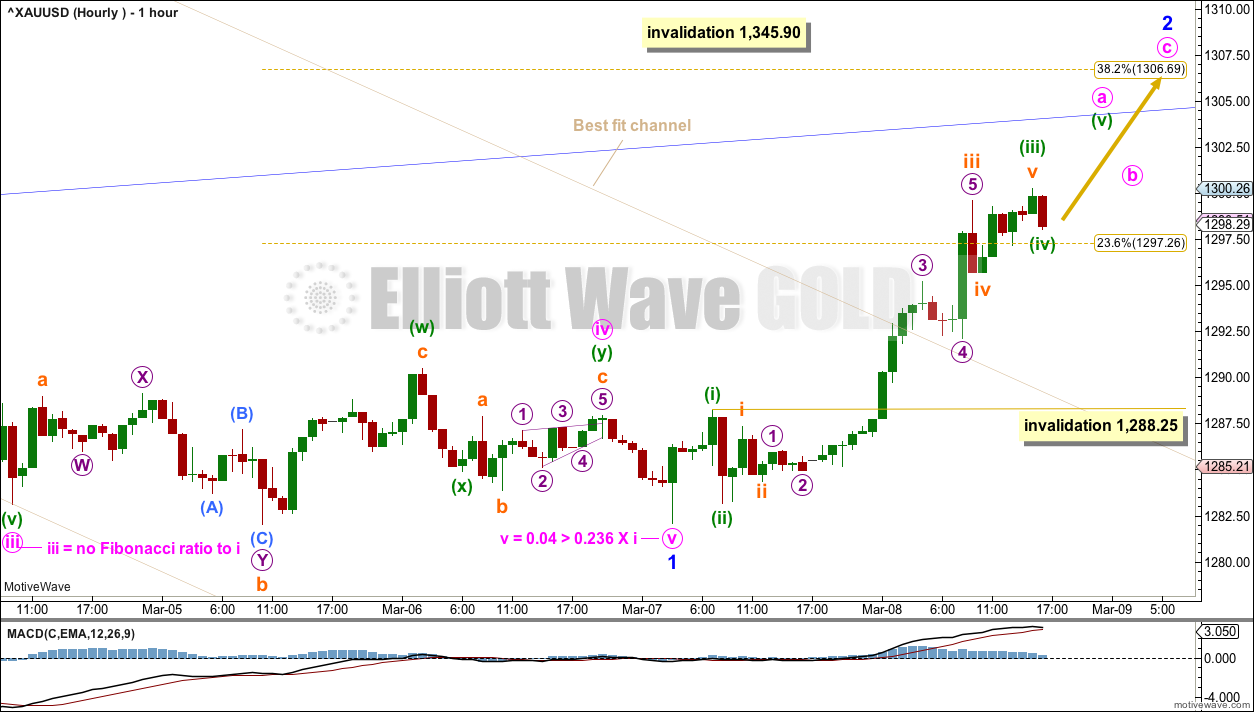
Upwards movement on Friday indicates the first wave down is complete. Fibonacci ratios are used to calculate targets.
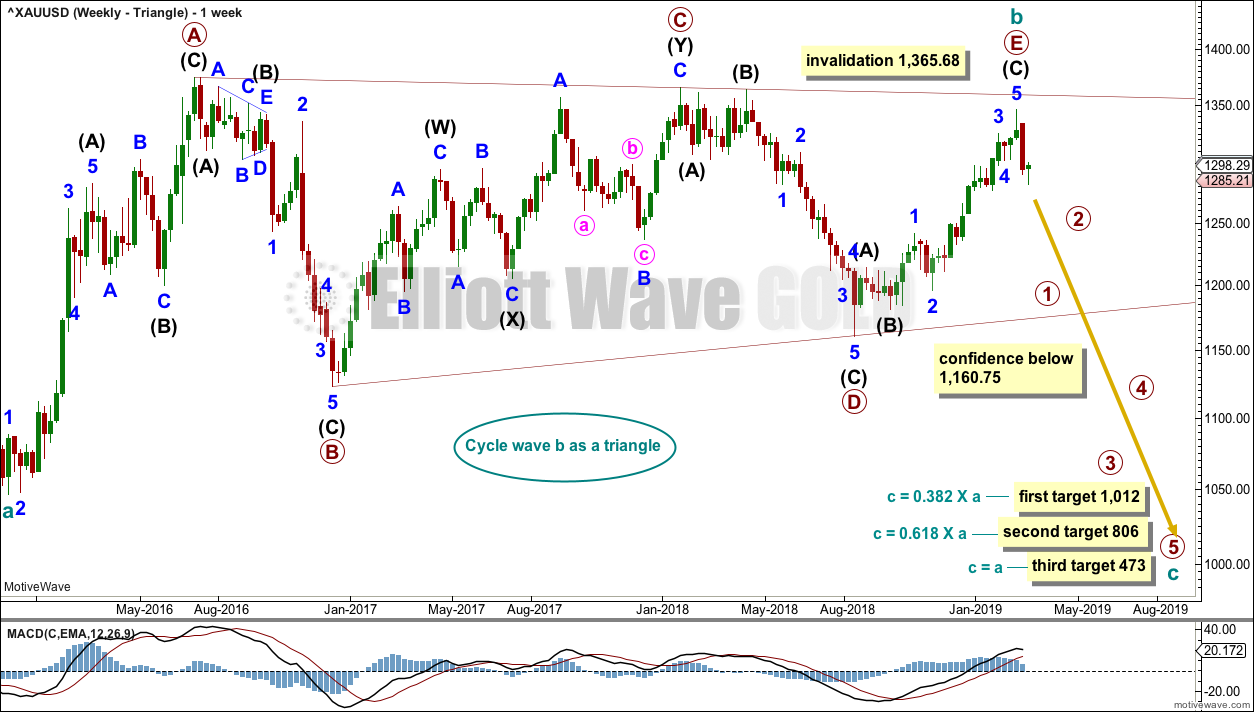
Summary: Three long-term targets are now calculated for cycle wave c to end. Confidence in a new downwards trend may be had with a new low below 1,160.75.
For the short term, minor wave 2 may now test resistance about 1,300 – 1,310. Within this range is the 0.382 Fibonacci ratio of minor wave 1 at 1,306.69, which is the preferred target.
New updates to this analysis are in bold.
Grand SuperCycle analysis is here.
Monthly charts are updated in this analysis.
MAIN ELLIOTT WAVE COUNT
MONTHLY CHART
Click chart to enlarge.
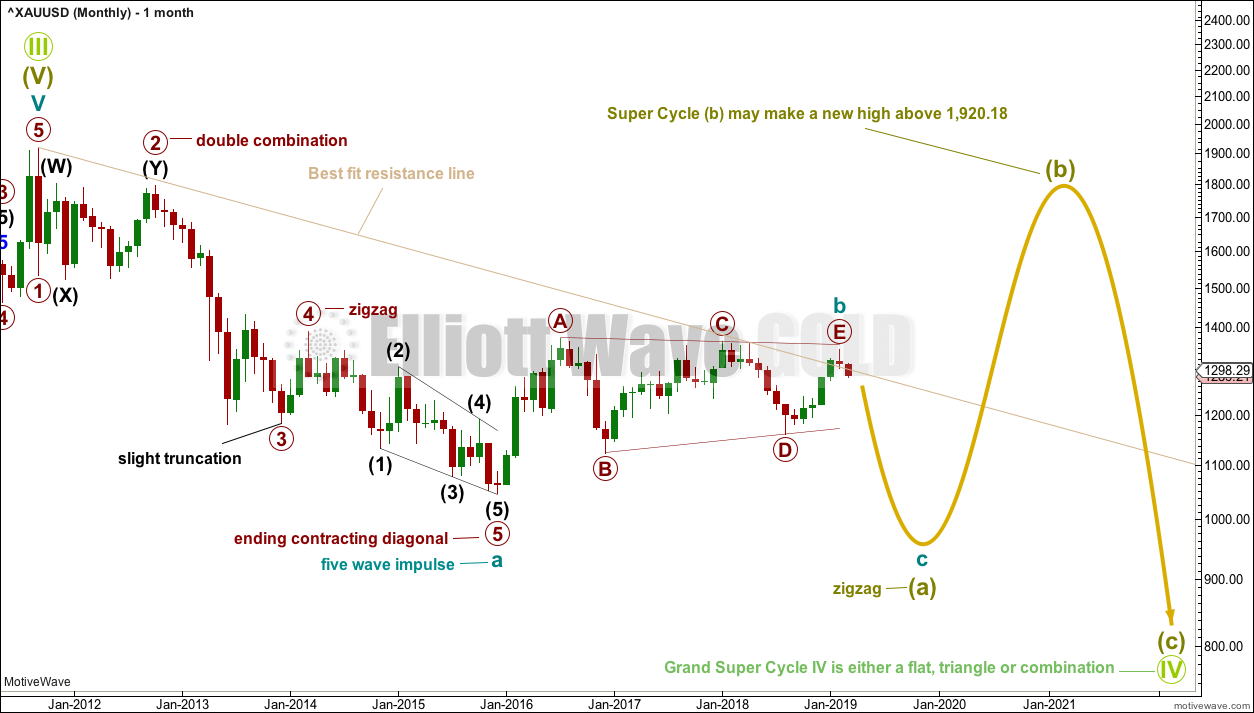
The main wave count will look at the large downwards wave from the all time high as a five wave impulse. For this main wave count, it will be labelled as cycle wave a, within a zigzag for Super Cycle wave (a).
It is also possible to move the degree of labelling up one degree and see this as a five wave structure complete for Super Cycle wave (a).
Both degrees of labelling would be valid, but in the interests of keeping charts and ideas to a manageable level only one shall be published at this stage. The difference will not be material for at least a year and probably more.
If cycle wave a is a five, then cycle wave b may not move beyond its start above 1,920.18.
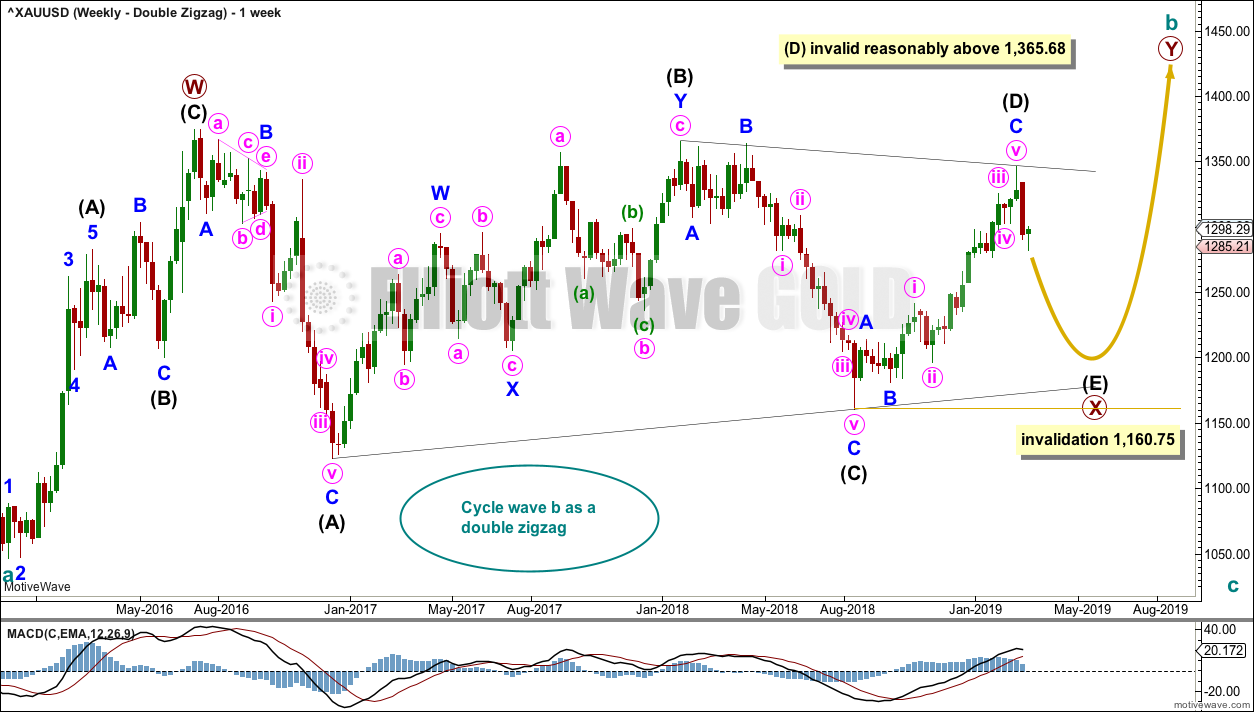
Cycle wave b at this stage will be labelled on the monthly chart as a complete regular contracting triangle, but it may also be an incomplete double zigzag or double combination. Both ideas will be published on weekly charts.
When cycle wave b is complete, then cycle wave c downwards should unfold. Cycle wave c would most likely reach about equality in length with cycle wave a.
If this wave count unfolds as expected, then a huge zigzag downwards may be complete when cycle wave c completes. That would then be expected to be followed by a huge three wave structure upwards, most likely another zigzag for Super Cycle wave (b), which may make a new all time high.
The larger structure for Grand Super Cycle wave (IV) would be starting out with a huge zigzag downwards, indicating either a flat, triangle or combination.
WEEKLY CHART – TRIANGLE
Click chart to enlarge.
This is the preferred wave count.
Cycle wave b may be a complete regular contracting triangle. If it continues further, then primary wave E may not move beyond the end of primary wave C above 1,365.68.
Four of the five sub-waves of a triangle must be zigzags, with only one sub-wave allowed to be a multiple zigzag. Wave C is the most common sub-wave to subdivide as a multiple, and this is how primary wave C for this example fits best.
There are no problems in terms of subdivisions or rare structures for this wave count. It has an excellent fit and so far a typical look.
This wave count would expect a cycle degree trend change has just occurred. Cycle wave c would most likely make new lows below the end of cycle wave a at 1,046.27 to avoid a truncation.
Primary wave E should exhibit reasonable weakness as it comes to an end. Triangles often end with declining ATR, weak momentum and weak volume.
If this weekly wave count is correct, then cycle wave c downwards should develop strength, ATR should show some increase, and MACD should exhibit an increase in downwards momentum.
Three targets are calculated for cycle wave c. Cycle wave a lasted 4.25 years. Cycle wave b may be over in 3.17 years. Cycle wave c may last a minimum of 2 years and possibly up to 5 years.
DAILY CHART – TRIANGLE
Click chart to enlarge.
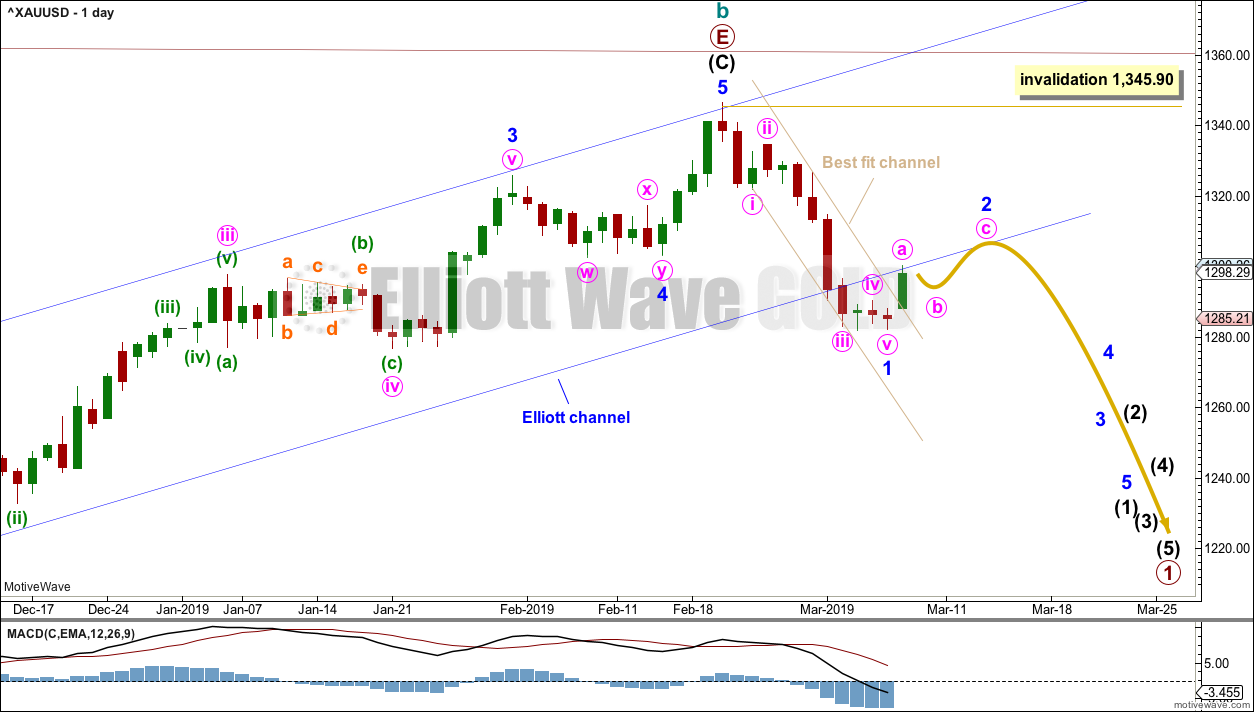
Further confidence in this wave count may be had now that the blue channel is breached.
Classic analysis offers good support to this wave count.
Cycle wave c must subdivide as a five wave structure, either an impulse or an ending diagonal. An impulse is much more common and that shall be how it is labelled unless overlapping suggests a diagonal should be considered.
A new trend at cycle degree should begin with a five wave structure on the daily chart, which will be labelled minor wave 1. A best fit channel is drawn about minor wave 1. This channel is breached by strong upwards movement on Friday, indicating minor wave 1 should be over and now minor wave 2 should be underway.
Minor wave 2 may not move beyond its start above 1,345.90.
HOURLY CHART
Click chart to enlarge.
Minor wave 1 may have ended with a remarkably short and brief fifth wave for minute wave v. There is a very close Fibonacci ratio between minute waves v and i.
Minor wave 2 may unfold over a few days. It would most likely subdivide as a single or multiple zigzag, but it may be any corrective structure except a triangle.
Minor wave 2 may end about either the 0.382 Fibonacci ratio at 1,306.69 or the 0.618 Fibonacci ratio at 1,321.94.
Minor wave 2 may not move beyond the start of minor wave 1 above 1,345.90.
Within minor wave 2, so far an impulse may be completing that may be minute wave a. Within minute wave a, minuette wave (iv) may not move into minuette wave (i) price territory below 1,288.25.
The lower edge of the blue channel, copied over from the daily chart, is at the end of Friday’s session providing resistance.
WEEKLY CHART – DOUBLE ZIGZAG
Click chart to enlarge.
It is possible that cycle wave b may be an incomplete double zigzag or a double combination.
The first zigzag in the double is labelled primary wave W. This has a good fit.
The double may be joined by a corrective structure in the opposite direction, a triangle labelled primary wave X. The triangle would be about four fifths complete.
Within multiples, X waves are almost always zigzags and rarely triangles. Within the possible triangle of primary wave X, it is intermediate wave (B) that is a multiple; this is acceptable, but note this is not the most common triangle sub-wave to subdivide as a multiple. These two points reduce the probability of this wave count.
Intermediate wave (D) may be complete. The (B)-(D) trend line is almost perfectly adhered to with the smallest overshoot within intermediate wave (C). This is acceptable.
Intermediate wave (E) should continue to exhibit weakness: ATR should continue to show a steady decline, and MACD may begin to hover about zero.
Intermediate wave (E) may not move beyond the end of intermediate wave (C) below 1,160.75.
This wave count may now expect downwards movement for several weeks.
Primary wave Y would most likely be a zigzag because primary wave X would be shallow; double zigzags normally have relatively shallow X waves.
Primary wave Y may also be a flat correction if cycle wave b is a double combination, but combinations normally have deep X waves. This would be less likely.
This wave count has good proportions and no problems in terms of subdivisions.
FIRST ALTERNATE ELLIOTT WAVE COUNT
MONTHLY CHART
Click chart to enlarge.
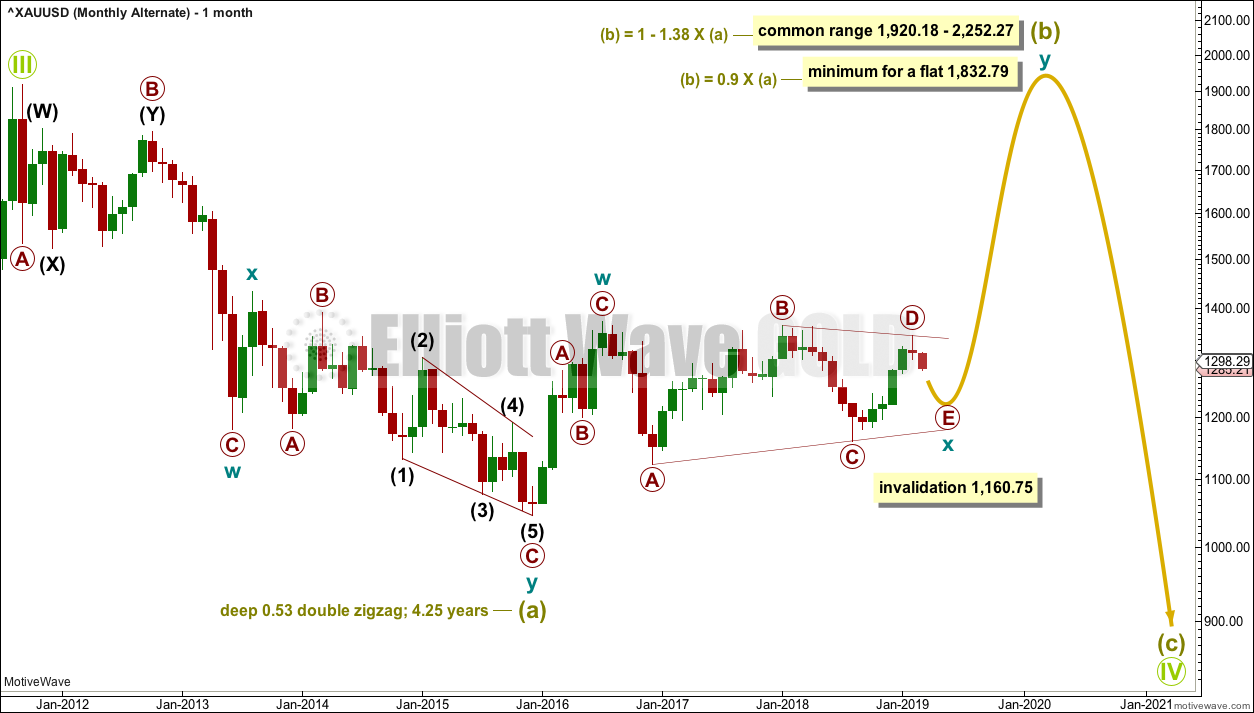
The large wave down from September 2011 to November 2015 may also be seen as a three wave structure, a double zigzag.
If the big wave down is a multiple three wave structure, then Grand Super Cycle wave (IV) may be either a flat or triangle. It may not be a combination because they may not have multiples within multiples.
If Grand Super Cycle wave (IV) is a flat correction, then within it Super Cycle wave (b) must retrace a minimum 0.9 length of Super Cycle wave (a) at 1,832.79.
If Grand Super Cycle wave (IV) is a triangle, then there is no minimum requirement for Super Cycle wave (b). There is only the structural requirement that it should be a three wave structure. Super Cycle wave (b) would need to move higher for a triangle to have the right look.
At this stage, it looks like Super Cycle wave (b) for this wave count may be an unfolding double zigzag. A double zigzag for Super Cycle wave (b) may see its Y wave reach up to the minimum requirement at 1,832.79 for a flat correction, for the structure one degree higher at Grand Super Cycle degree.
SECOND ALTERNATE ELLIOTT WAVE COUNT
MONTHLY CHART
Click chart to enlarge.
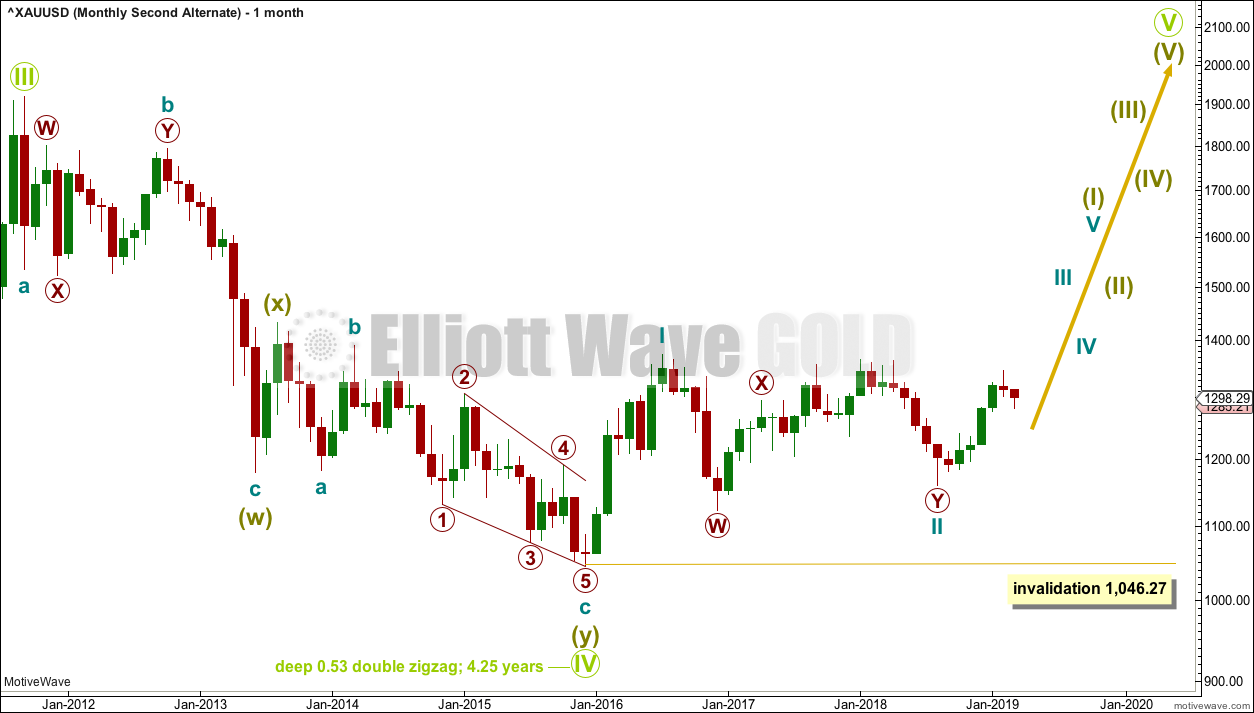
By simply moving the degree of labelling within the last huge wave down all up one degree, it is possible to see that Grand Super Cycle wave IV could be over. It would be rather brief though at only 4.25 years. However, Grand Super Cycle wave II in the Grand Super Cycle analysis is expected to have lasted only about 8 years, so this possibility should be accepted.
If there has been a trend change at Grand Super Cycle degree in the end of November 2015, then a new five wave structure upwards should develop from there at the monthly chart level.
Gold will often form long slow basing movements. Its first waves can be short and its second waves long lasting and deep.
Cycle wave I may have been complete and relatively short and brief at only 7 months duration.
Cycle wave II may now be a complete double combination.
WEEKLY CHART
Click chart to enlarge.
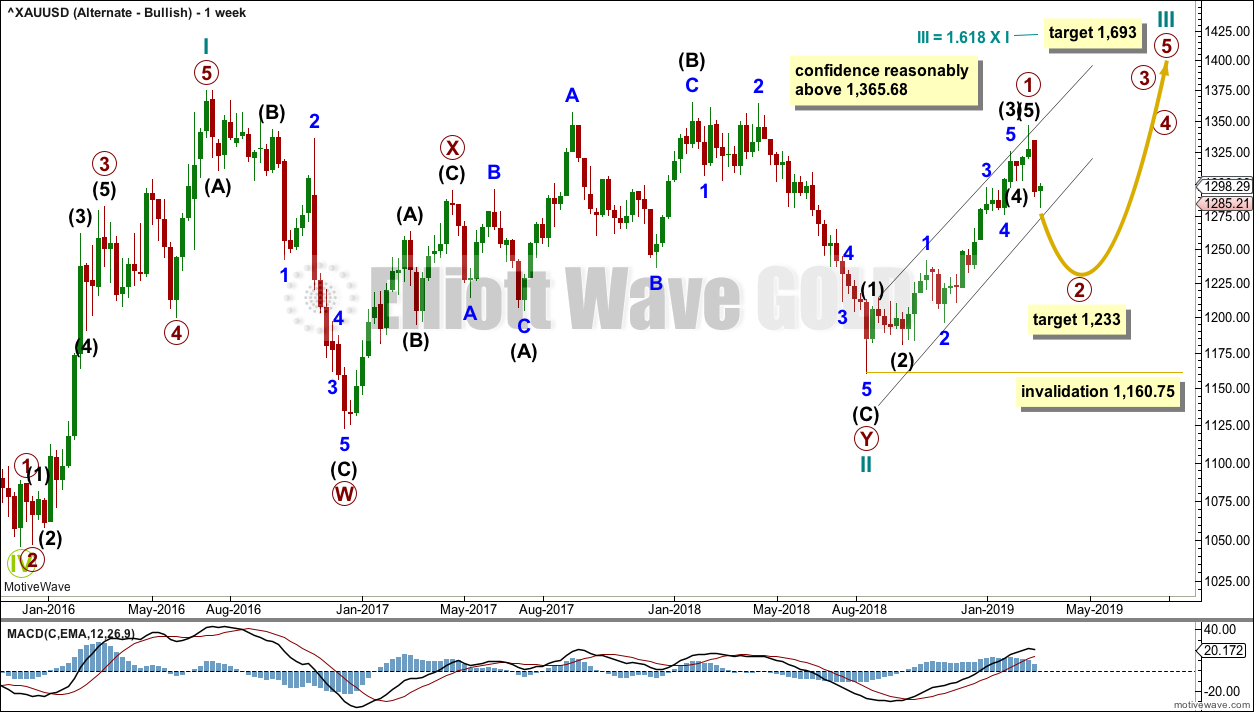
If Gold is in a new bull market, then it should begin with a five wave structure upwards on the weekly chart. However, the biggest problem with this wave count is the structure labelled cycle wave I because this wave count must see it as a five wave structure, but it looks more like a three wave structure.
Commodities often exhibit swift strong fifth waves that force the fourth wave corrections coming just prior to be more brief and shallow than their counterpart second waves. It is unusual for a commodity to exhibit a quick second wave and a more time consuming fourth wave, and this is how cycle wave I is labelled. The probability of this wave count is low due to this problem.
Cycle wave II subdivides well as a double combination: zigzag – X – expanded flat.
Cycle wave III may have begun. Within cycle wave III, primary wave 1 may now be complete. The target for primary wave 2 is the 0.618 Fibonacci ratio of primary wave 1. Primary wave 2 may not move beyond the start of primary wave 1 below 1,160.75.
A black channel is drawn about primary wave 1. Primary wave 2 may breach the lower edge of this channel.
Cycle wave III so far for this wave count would have been underway now for 27 weeks. It should be beginning to exhibit some support from volume, increase in upwards momentum and increasing ATR. However, volume continues to decline, ATR continues to decline and is very low, and momentum is weak in comparison to cycle wave I. This wave count lacks support from classic technical analysis.
TECHNICAL ANALYSIS
MONTHLY CHART
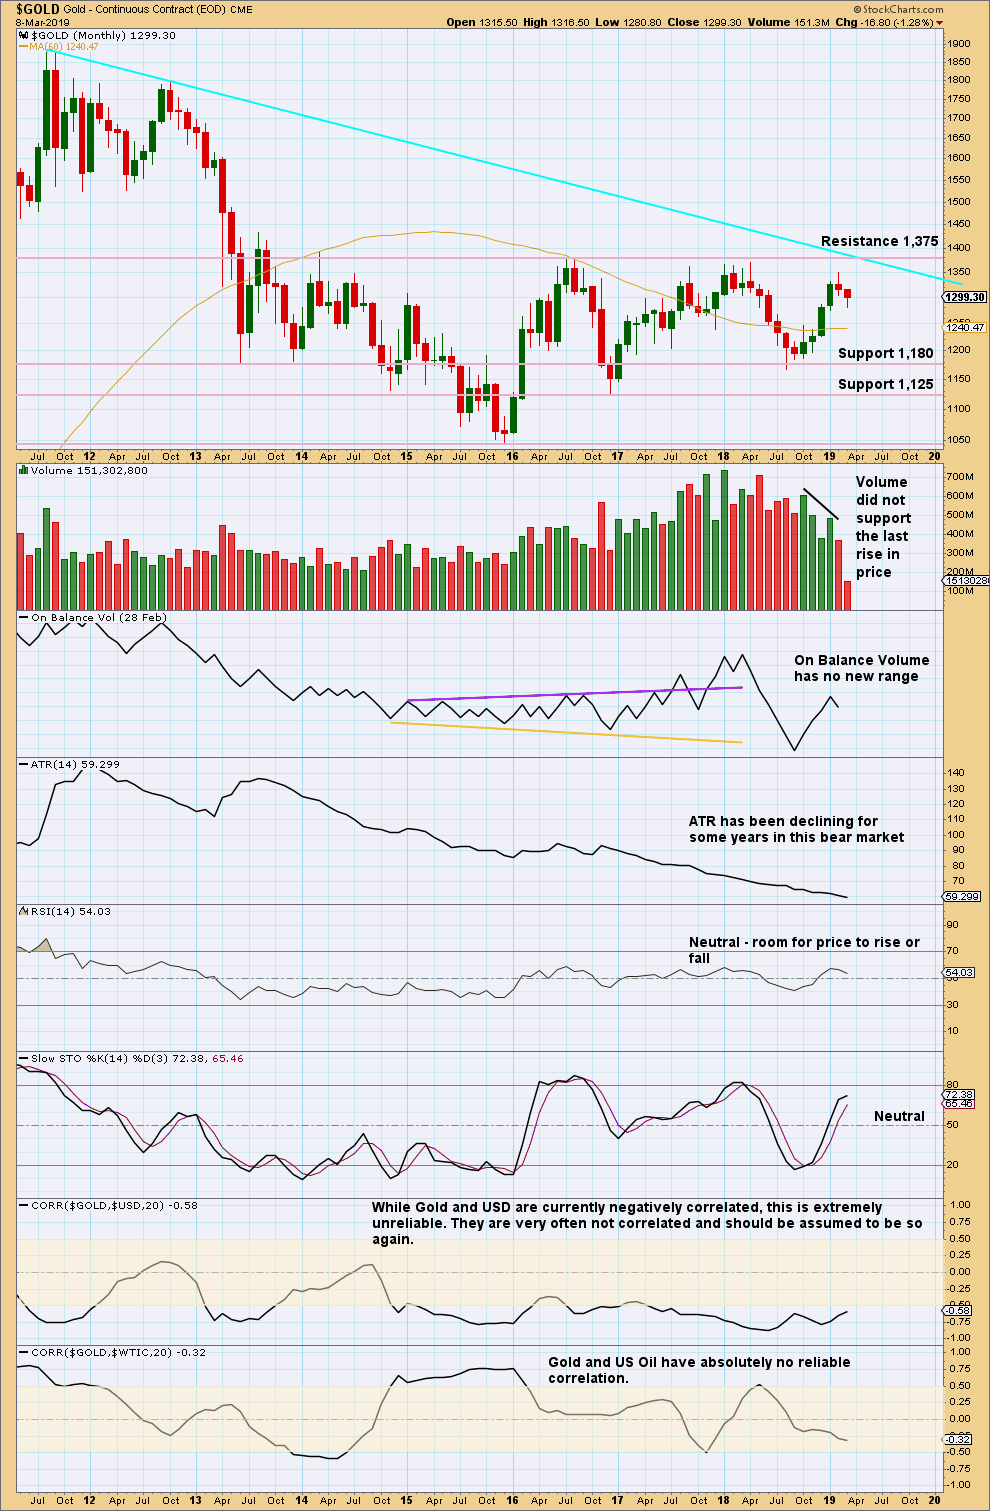
Click chart to enlarge. Chart courtesy of StockCharts.com.
Price has been range bound for years. Resistance is about 1,375 and support about 1,180 and 1,125.
ATR has also been declining for many years. This market is weak.
WEEKLY CHART
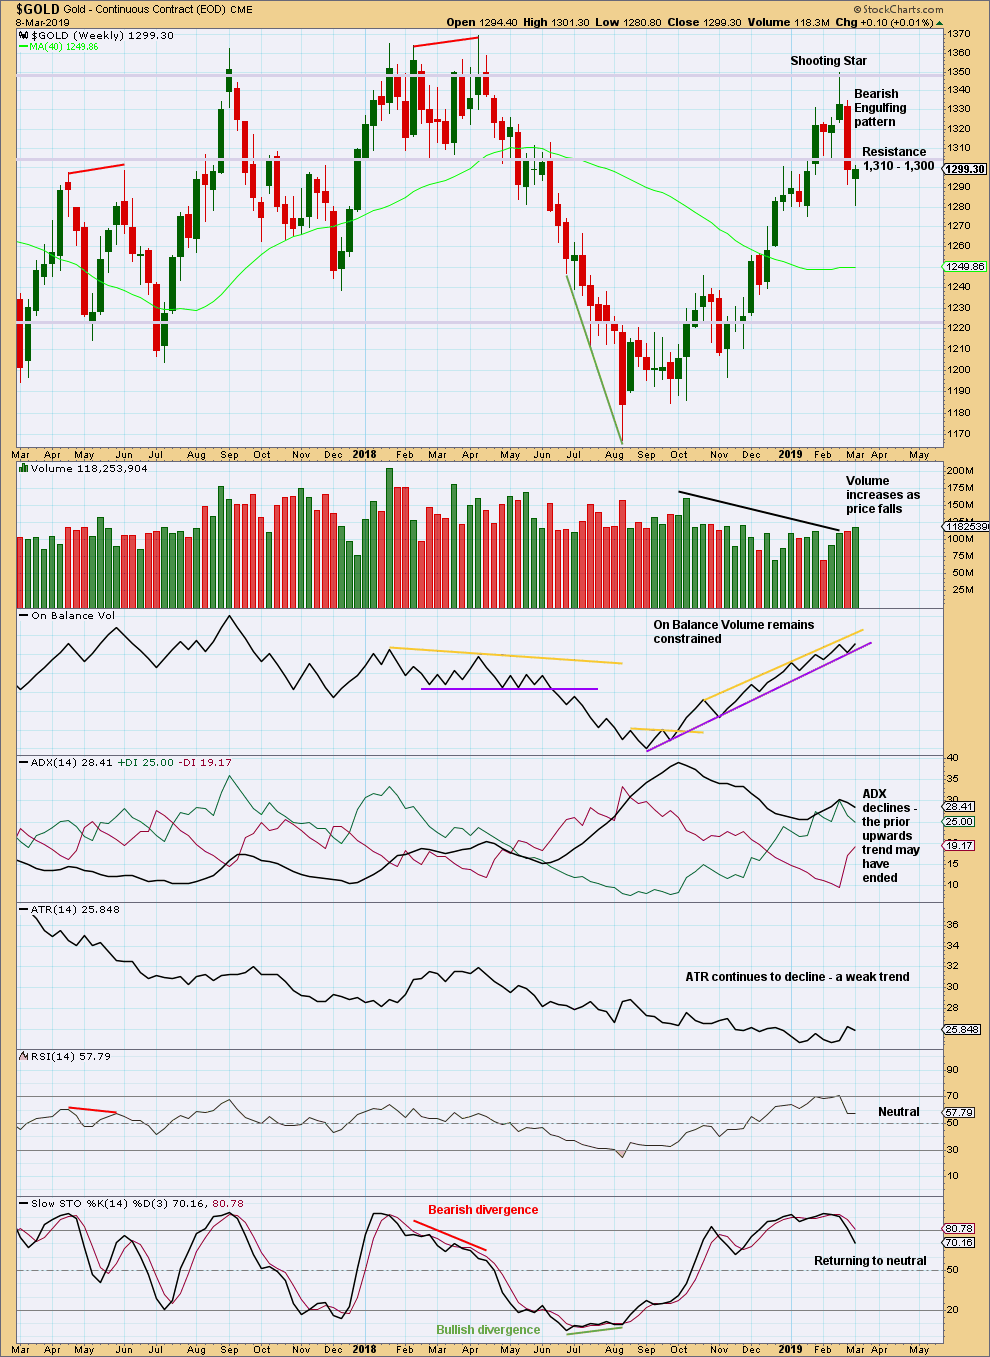
Click chart to enlarge. Chart courtesy of StockCharts.com.
There are now two bearish candlestick reversal patterns on the weekly chart: a Shooting Star and a Bearish Engulfing pattern. This supports the view that a high is in place.
This weekly candlestick may not be considered a bullish reversal pattern as it does not come after a downwards trend at this time frame. The long lower wick is still bullish.
DAILY CHART
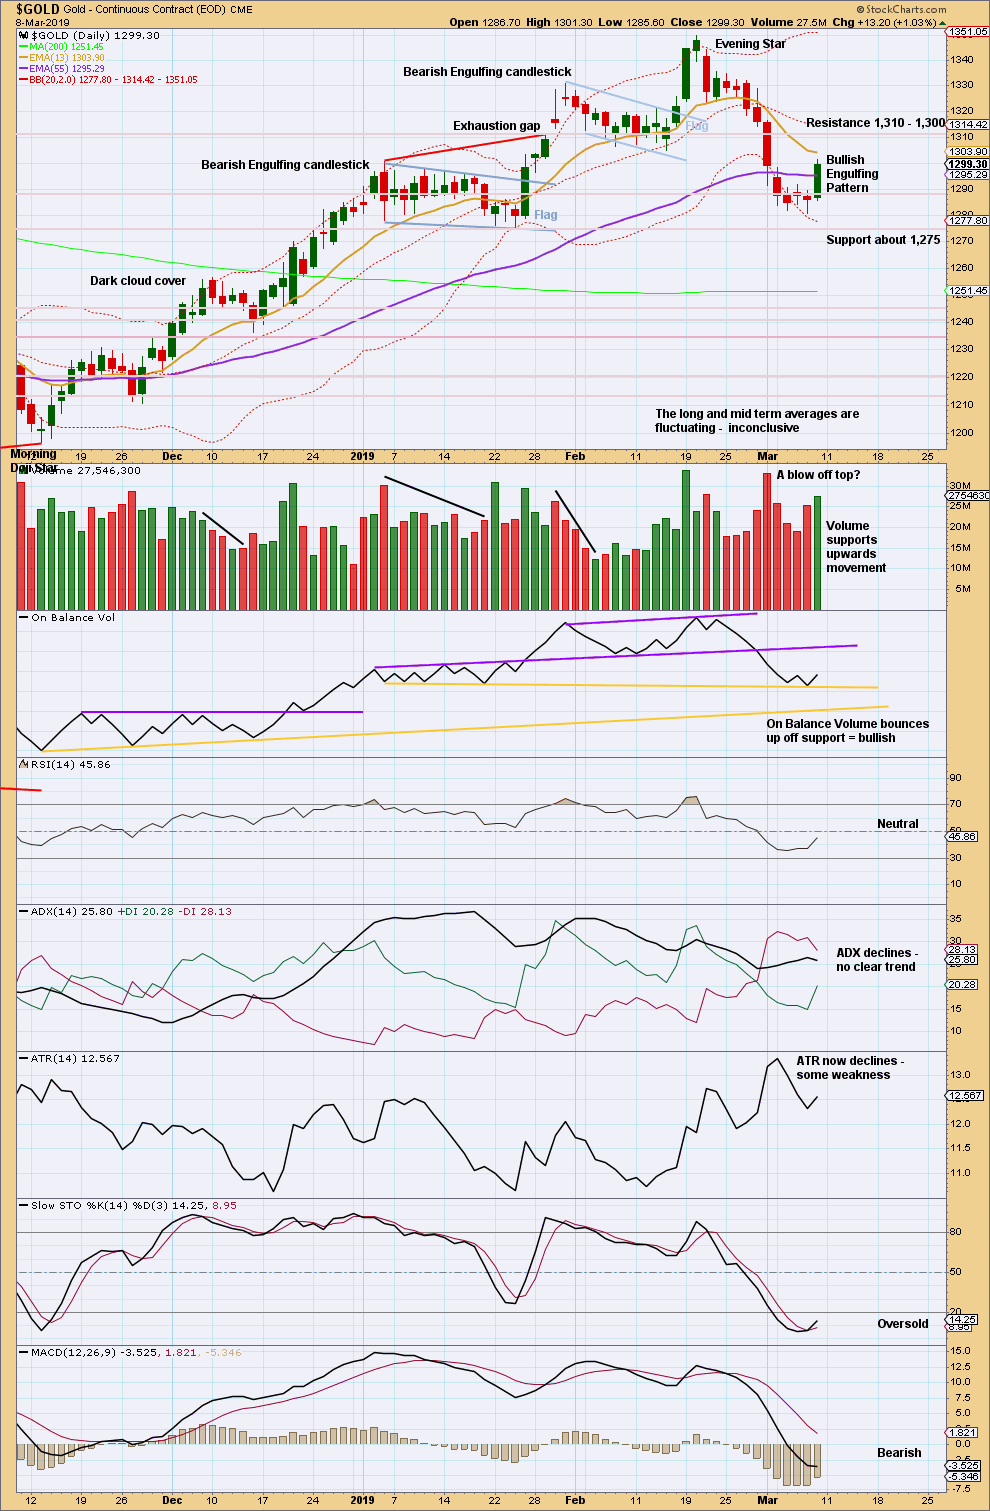
Click chart to enlarge. Chart courtesy of StockCharts.com.
There has been a shorter lived downwards trend at the daily chart level. That trend may now be considered over with a strong bullish candlestick reversal pattern that has support from volume and a bullish signal from On Balance Volume.
Look for a test of resistance about 1,300 to 1,310.
GDX WEEKLY CHART
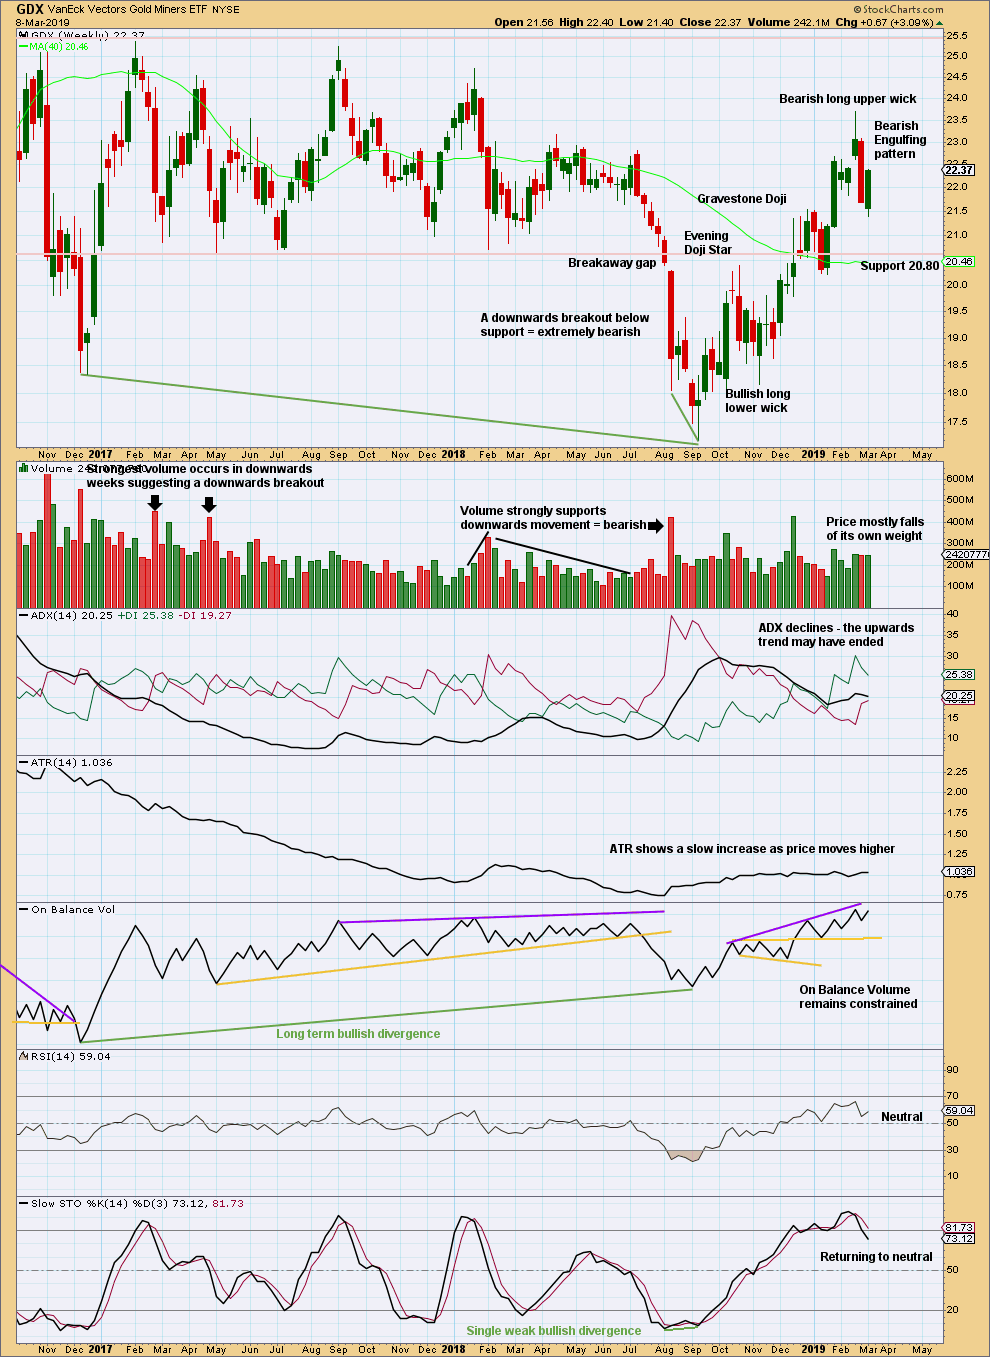
Click chart to enlarge. Chart courtesy of StockCharts.com.
The Bearish Engulfing pattern at the weekly chart level should still be given weight in this analysis. It signals an end to the upwards trend and a new downwards or sideways trend.
GDX DAILY CHART
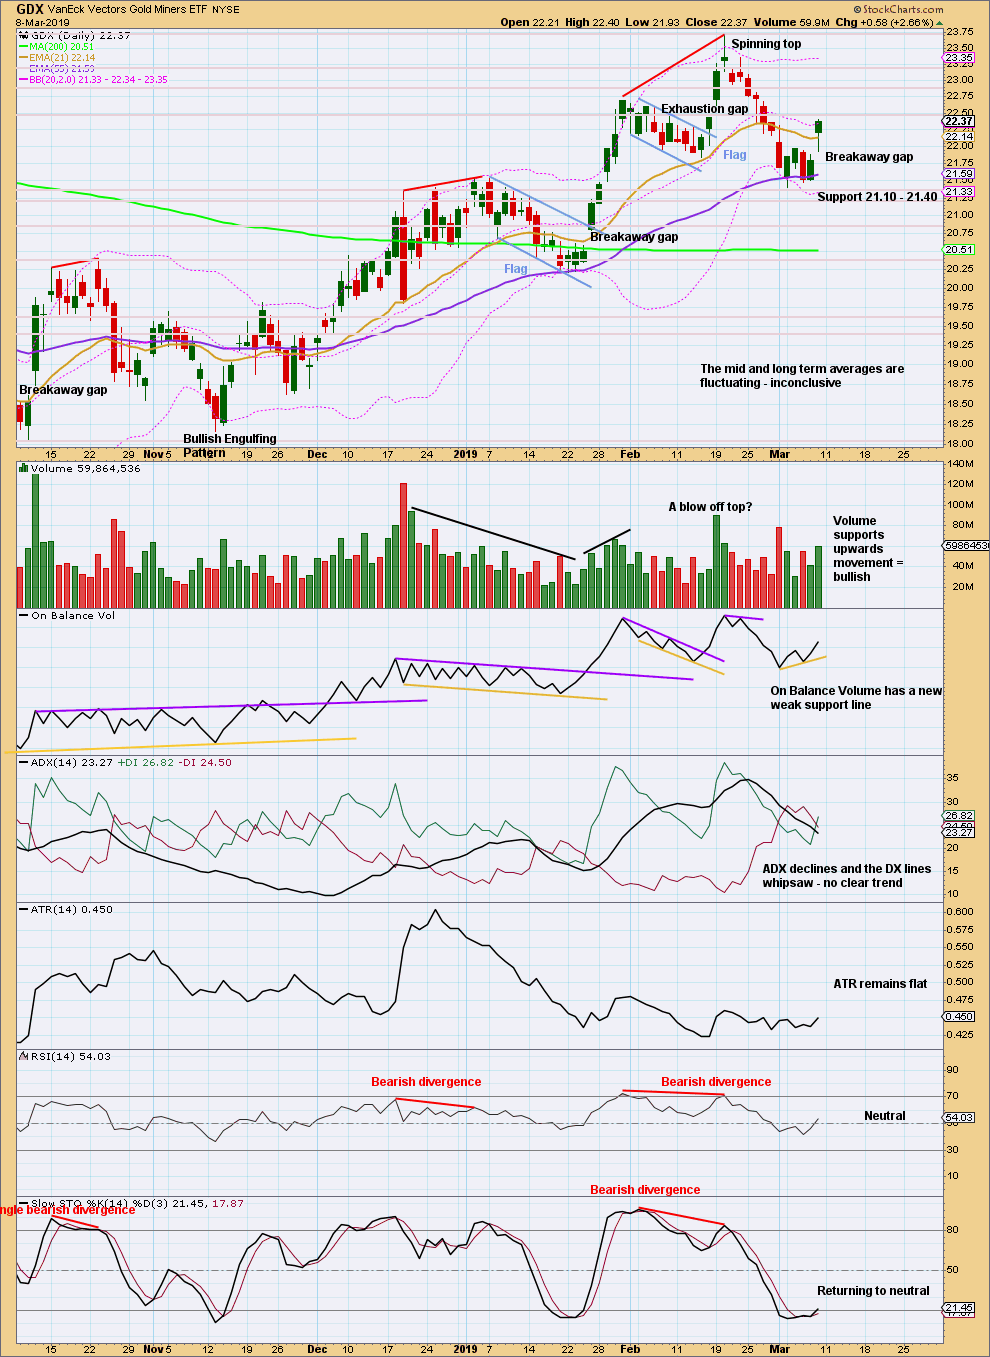
Click chart to enlarge. Chart courtesy of StockCharts.com.
Friday saw an upwards breakout from a small consolidation that has support from volume and a breakaway gap. Look now for support at the breakaway gap at 21.89 and resistance above about 22.50 and then 22.90.
The long lower wick and close near the high for the session indicate more upwards movement as fairly likely on Monday.
Published @ 12:28 a.m. EST on March 9, 2019.
—
Careful risk management protects your trading account(s).
Follow my two Golden Rules:
1. Always trade with stops.
2. Risk only 1-5% of equity on any one trade.
I figured out why I was late this morning. Northern hemisphere daylight savings time changes.
Will be here earlier tomorrow.
Good morning everybody. I am sorry I am so late this morning.
For minor wave 2, minute a may have ended perfectly at resistance at the lower edge of the channel. If minor 2 is a zigzag, then minute a should have subdivided as a five. Minute b may not move beyond the start of minute a.
Minute c may again test resistance at the blue line.
If this analysis is wrong it may be in expecting minor 2 to continue and move higher. It is possible that it could be much quicker and more shallow than I am expecting.
Lara;s service has kept me outside of gold bugs fictional bubble prediction of gold’s price.
It is a great service and best EW analysis.
Recently saw a post of gold bug’s prediction since 2011.
These 113 Analysts Believe Gold Will Go Parabolic to $3,000 or More!
http://www.321gold.com/editorials/moriarty/moriarty112718.html
Feels great to be here!!!
That article was posted on Nov 27, 2018 though. It’s a little bit outdated. I think 2019 should be a decent yr for gold, and goldbugs need to be a little bit more patient.
Gold to silver ratio is a reliable indicator for gold and silver trend. GSR has been trading in a narrow range 86 to 83 for months.
On Friday it appears it has turn down from a bearish upward wedge ending diagonal) in intraday 4 hour chart.
This may support Lara’s EW count for a bounce. If GSR trades below 80 to 77 than the bullish count may become the primary count.
More on GSR on this post- a brief assay.
https://goldtadise.com/?p=441448
Lara, Thanks for the monthly updates! Add to Gold Historical? Thanks
Oh yes, thanks Dreamer.
For those of you interested in the Global Economy and more specifically, Europe & France, EWI is showing that they expect France to start a Cycle Wave C down that will last several years. This could be bearish for most of Europe and likely the world?
Free access for EWI free members this weekend only
https://www.elliottwave.com/Free-Events/Free-Pass-Europe?rcn=4403EID&tcn=1903FPE&sc_camp=86FAE57383094E23ABA52A545D047461
They are often Bearish way too early. I would not make big moves based on their interpretation. They are always Uber bearish and they will not help you make money. Stick with Lara’s work she is light years better. I know from experience. Just imho if you want to make profitable trades. Even though they have a free weekend it may cost you. Be careful whose work you follow when making trading decisions.
Andrew,
I agree with you on Lara’s work. It’s the best. I’m not trying to promote EWI. Just sharing what appears to be a valid EW count that possibly shows the world economy is in for a rough ride in the coming years. Yes, each stock market must be considered individually, but there’re all interconnected in some way. It never hurts to study other information, including EW counts and make your own decisions. Could be bullish for gold and we know there are a few bullish options thanks to Lara. 🙂