
Downwards movement was expected for the week for Silver, which is exactly what has happened.
Summary: Downwards movement is expected again for next week. A possible small consolidation may unfold sideways for a very few days first.
The next target is now at 10.05.
Monthly charts were reviewed here.
New updates to this analysis are in bold.
ELLIOTT WAVE COUNTS
MAIN WAVE COUNT
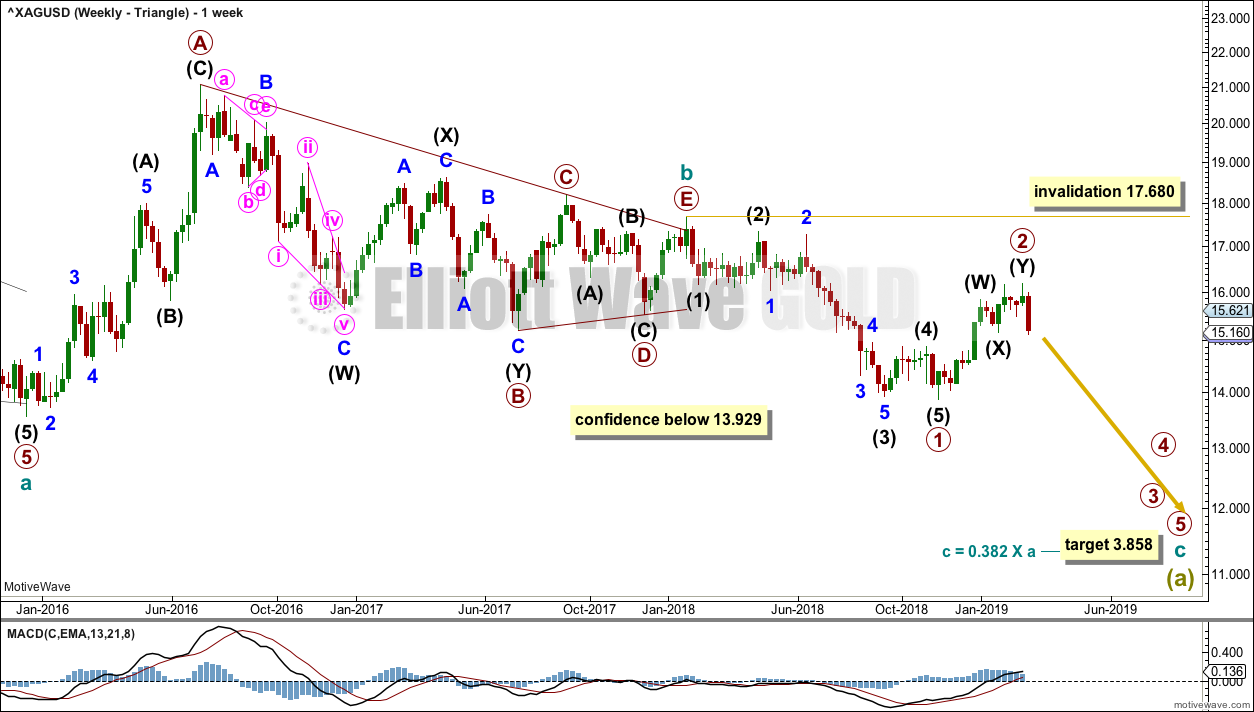
WEEKLY CHART – TRIANGLE
Click chart to enlarge.
This first wave count has good support from classic technical analysis, so it will be favoured. This wave count looks likely.
The first wave count expects that the bear market, which began from the April 2011 high, is incomplete.
Cycle wave a is seen as a five wave impulse for this main wave count.
This first weekly chart sees cycle wave b as a now possibly complete regular contracting triangle.
Primary wave E of the triangle may have ended with an overshoot of the A-C trend line.
Within cycle wave c, primary waves 1 and 2 may now both be complete.
If it continues higher, then primary wave 2 may not move beyond the start of primary wave 1 above 17.680.
Cycle wave c needs to move below the end of cycle wave a below 13.569 in order to avoid a truncation.
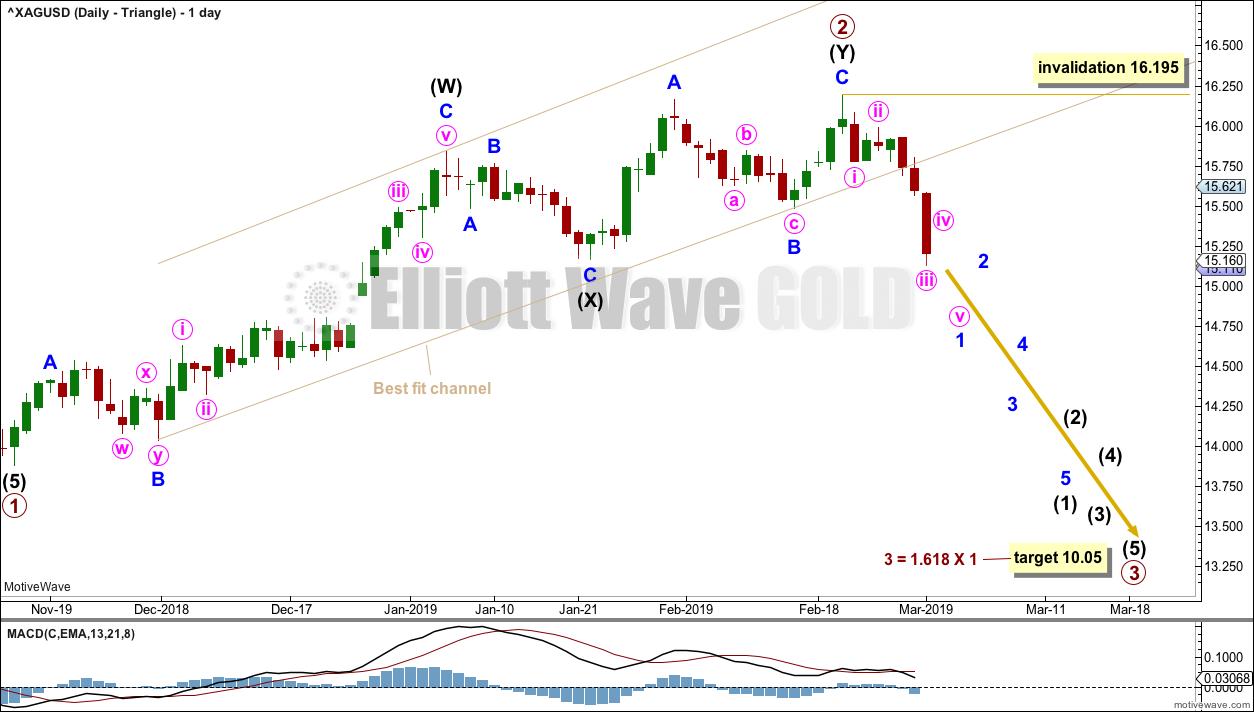
DAILY CHART – TRIANGLE
Click chart to enlarge.
A channel is drawn about primary wave 2 to contain the whole movement and be most conservative. This channel is breached by downwards movement providing confidence to this wave count and the idea of a high in place.
A target is calculated for primary wave 3 to reach the most common Fibonacci ratio to primary wave 1.
Primary wave 3 may only subdivide as an impulse. Within primary wave 3, intermediate wave (1) may be incomplete. Within intermediate wave (1), minor wave 2 may not move beyond the start of minor wave 1 above 16.195.
ALTERNATE WAVE COUNT
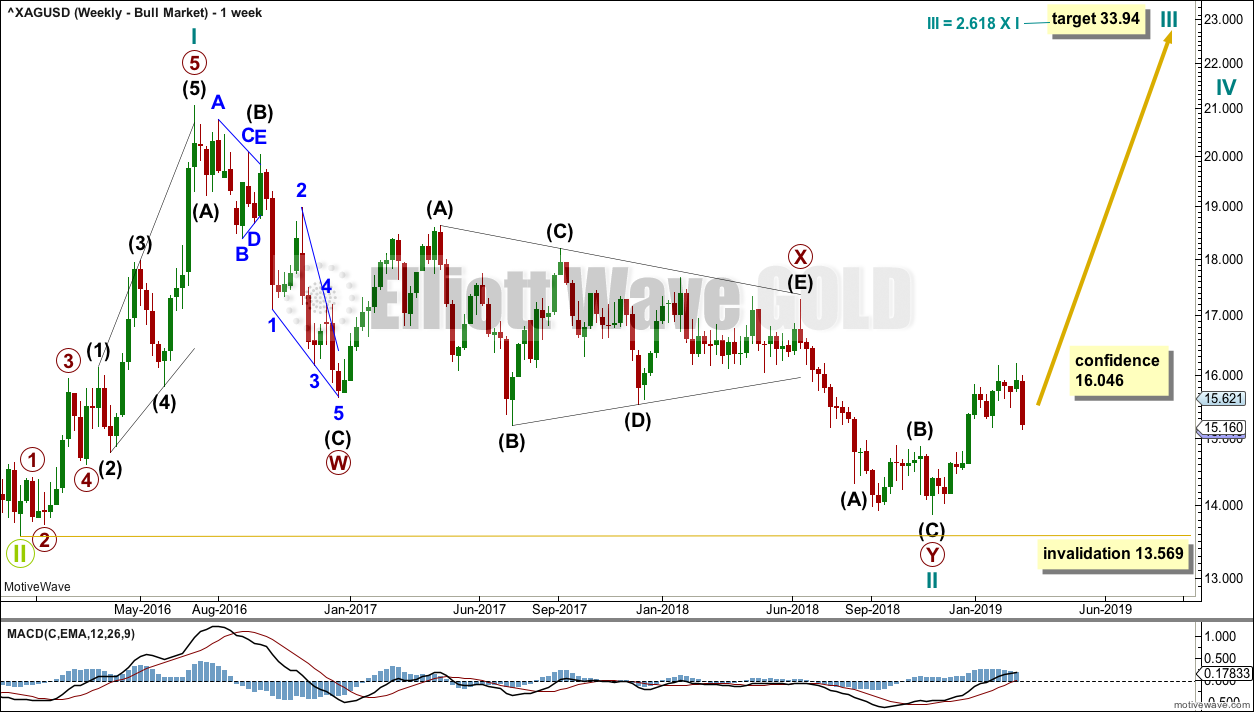
WEEKLY CHART – BULL WAVE COUNT
Click chart to enlarge.
Cycle wave II may be a complete double zigzag. Cycle wave II would be very deep at 0.96 of cycle wave I. This is typical behaviour for the first second wave correction within a new trend for commodities.
If it continues any further, then cycle wave II may not move beyond the start of cycle wave I below 13.569.
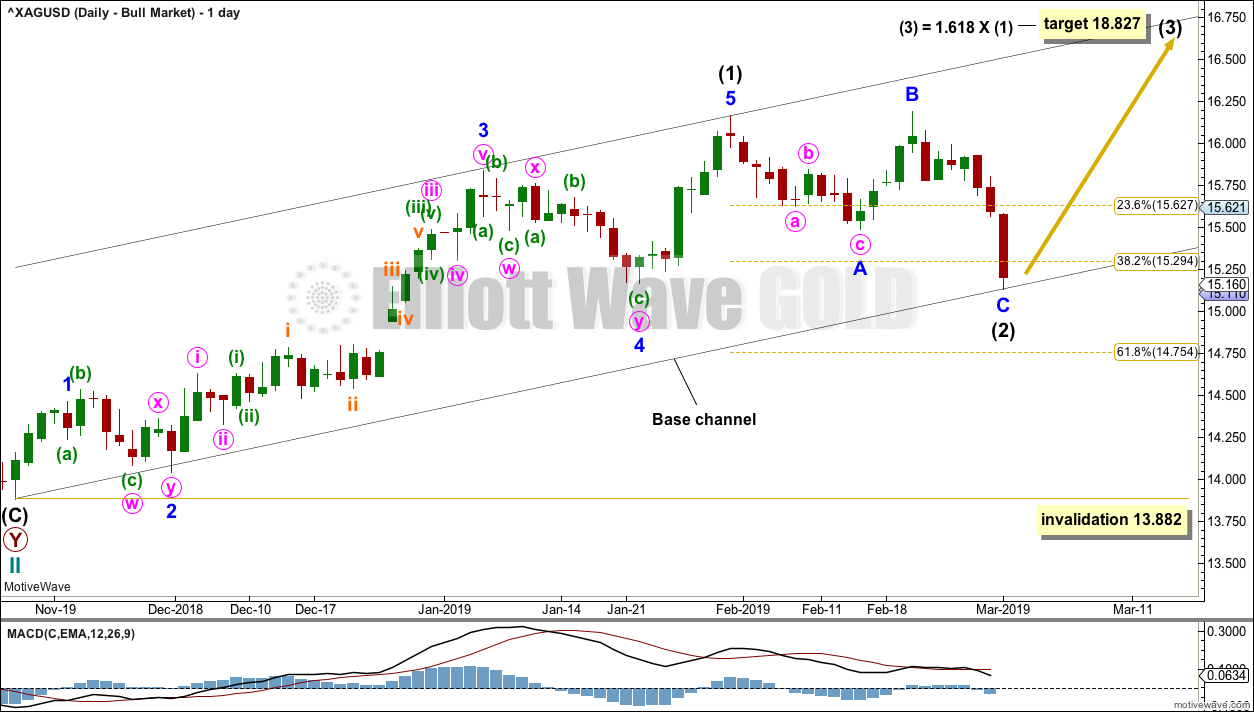
DAILY CHART – BULL WAVE COUNT
Click chart to enlarge.
If cycle wave II is over, then the new trend up for cycle wave III should begin with a five wave structure. This is labelled intermediate wave (1). The structure may now be complete.
Intermediate wave (2) may now be a complete regular flat correction. It is also possible it may continue further as a double combination or a double flat correction.
Intermediate wave (2) may not move beyond the start of intermediate wave (1) below 13.882.
This wave count now expects a third wave upwards for intermediate wave (3) to begin here or very soon.
TECHNICAL ANALYSIS
WEEKLY CHART
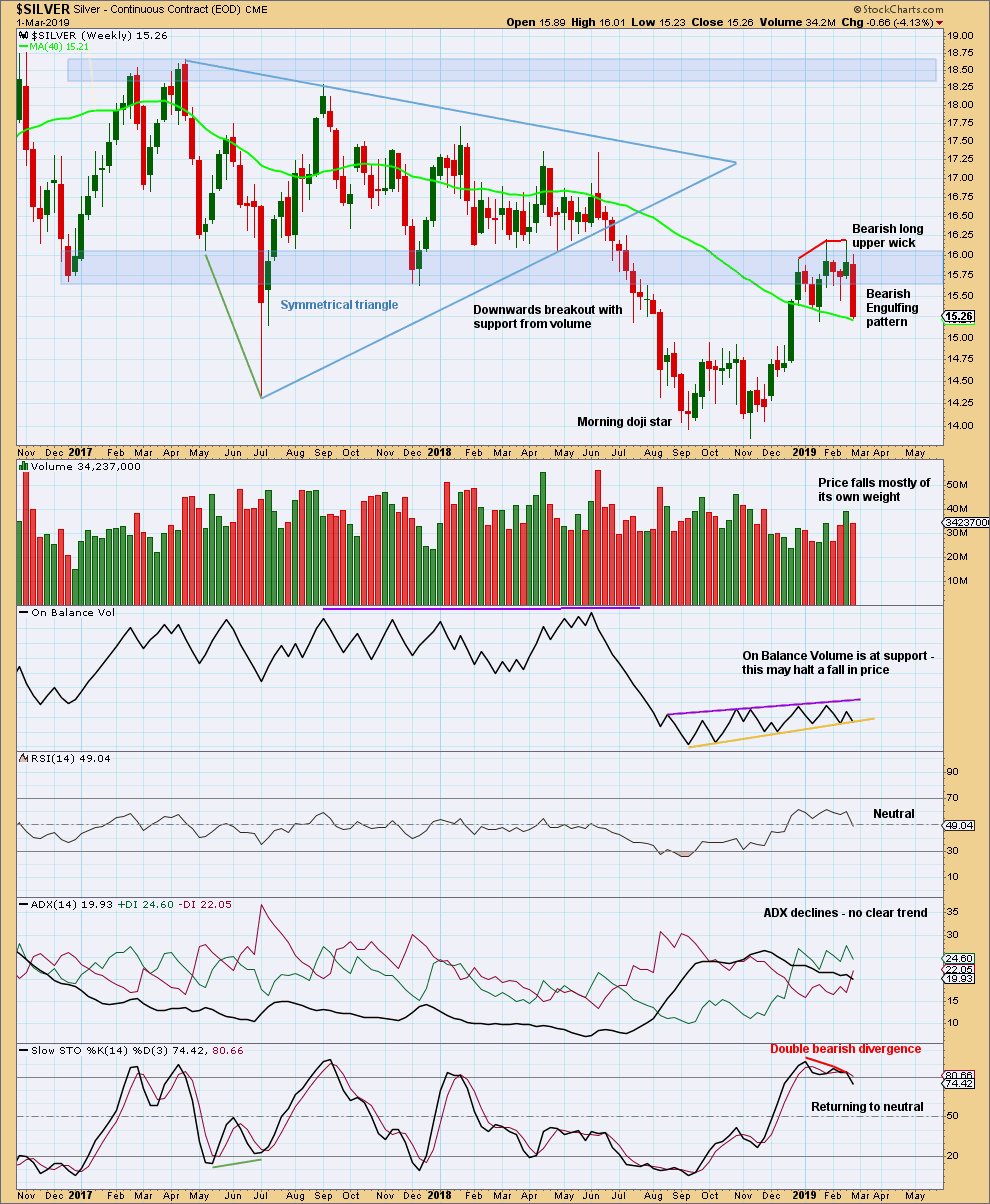
Click chart to enlarge. Chart courtesy of StockCharts.com.
The Bearish Engulfing candlestick pattern this week engulfs the prior seven weekly candlesticks. It is an extremely strong bearish reversal pattern and offers good support to the Triangle Elliott wave count.
Price has closed below support.
DAILY CHART
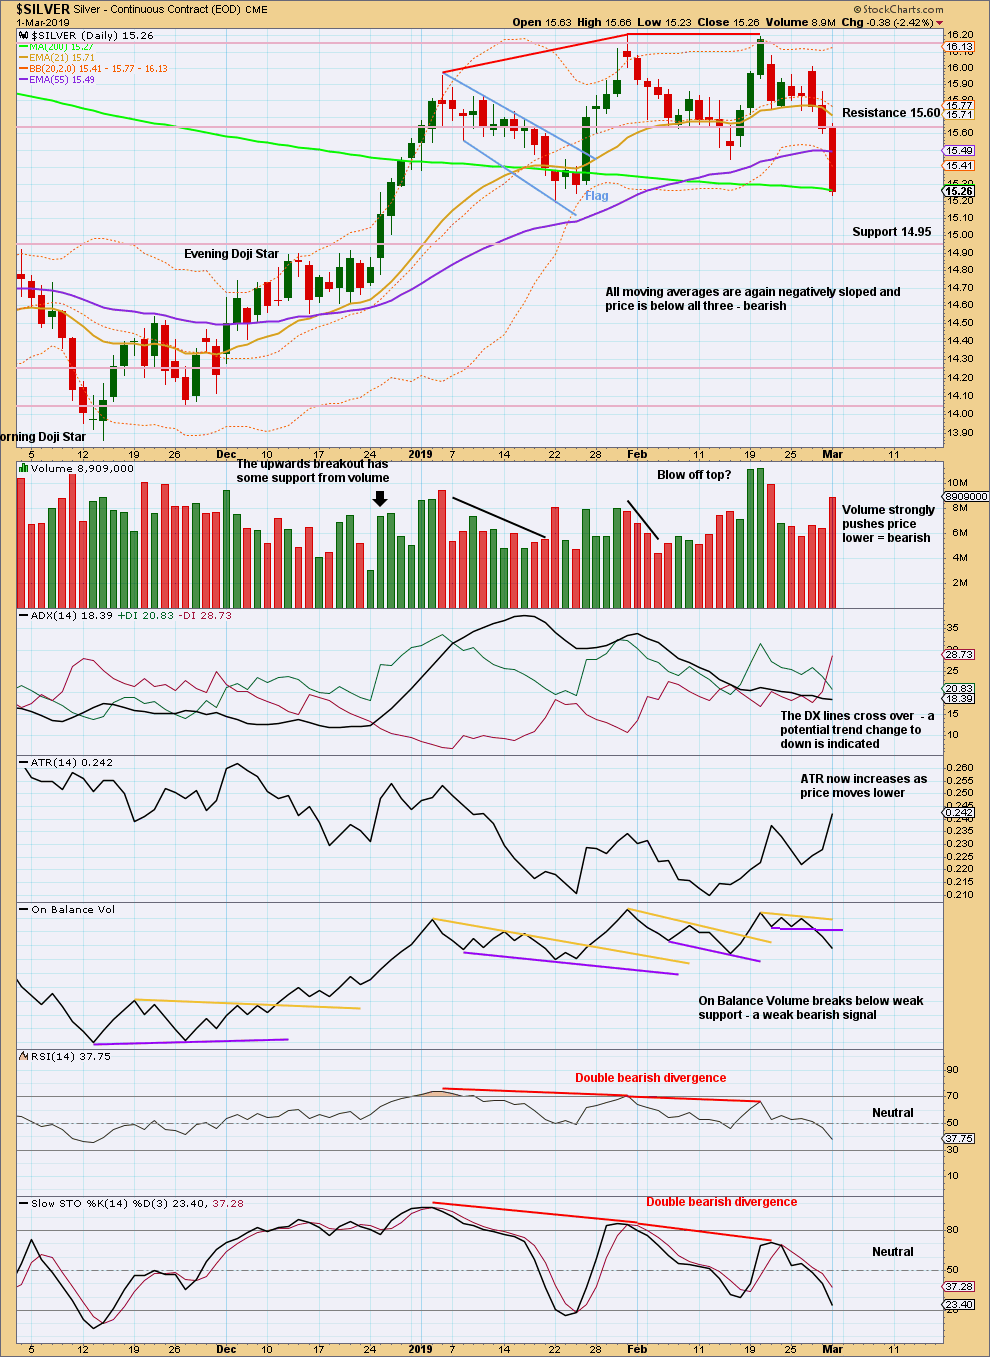
Click chart to enlarge. Chart courtesy of StockCharts.com.
This chart supports the Triangle Elliott wave count.
Look for a possible small consolidation after the strong downwards day of Friday. Next support is about 14.95.
Published @ 01:52 a.m. EST on March 3, 2019.
—
Careful risk management protects your trading account(s).
Follow my two Golden Rules:
1. Always trade with stops.
2. Risk only 1-5% of equity on any one trade.