
A target for the bounce to end was at 15.70. Price did continue higher for the week, but only to 15.517.
Summary: The downwards trend may have resumed from Thursday’s high. A new short-term target is at 13.422.
The long-term target remains at 10.05.
Monthly charts were reviewed here.
New updates to this analysis are in bold.
ELLIOTT WAVE COUNTS
MAIN WAVE COUNT
WEEKLY CHART – TRIANGLE
Click chart to enlarge.
This first wave count has good support from classic technical analysis, so it will be favoured. This wave count looks likely.
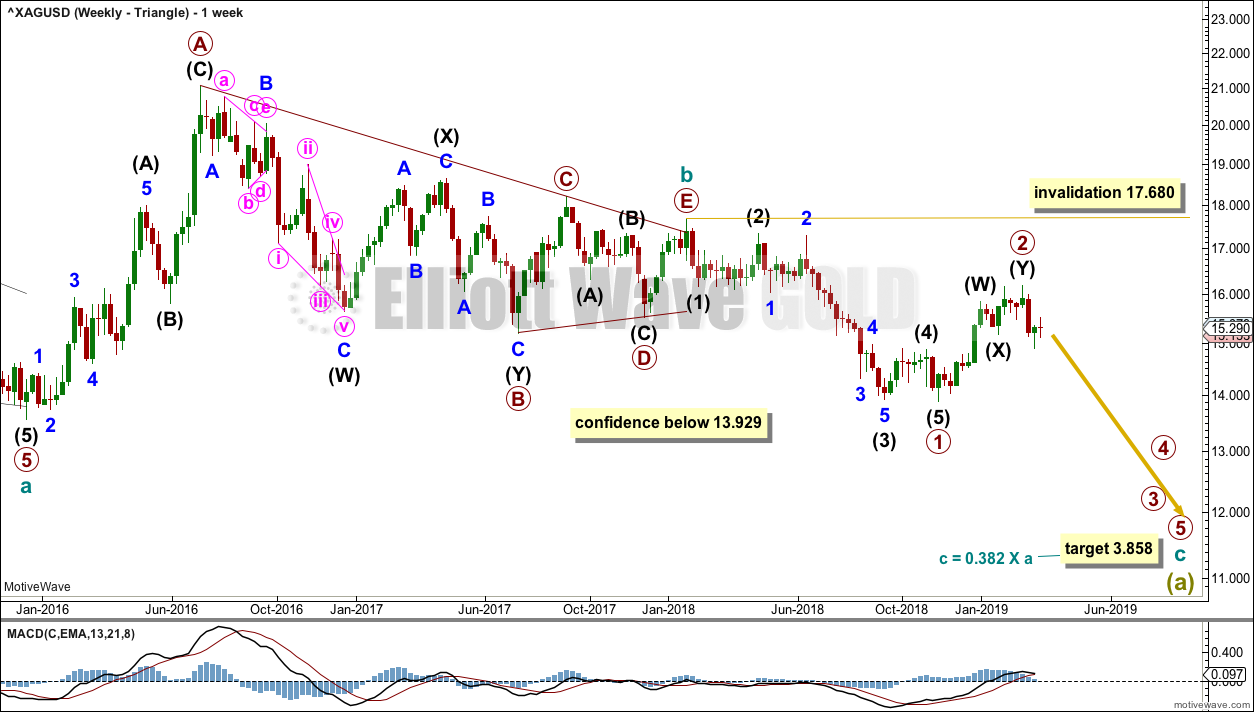
The first wave count expects that the bear market, which began from the April 2011 high, is incomplete.
Cycle wave a is seen as a five wave impulse for this main wave count.
This first weekly chart sees cycle wave b as a now possibly complete regular contracting triangle.
Primary wave E of the triangle may have ended with an overshoot of the A-C trend line.
Within cycle wave c, primary waves 1 and 2 may now both be complete.
If it continues higher, then primary wave 2 may not move beyond the start of primary wave 1 above 17.680.
Cycle wave c needs to move below the end of cycle wave a below 13.569 in order to avoid a truncation.
DAILY CHART – TRIANGLE
Click chart to enlarge.
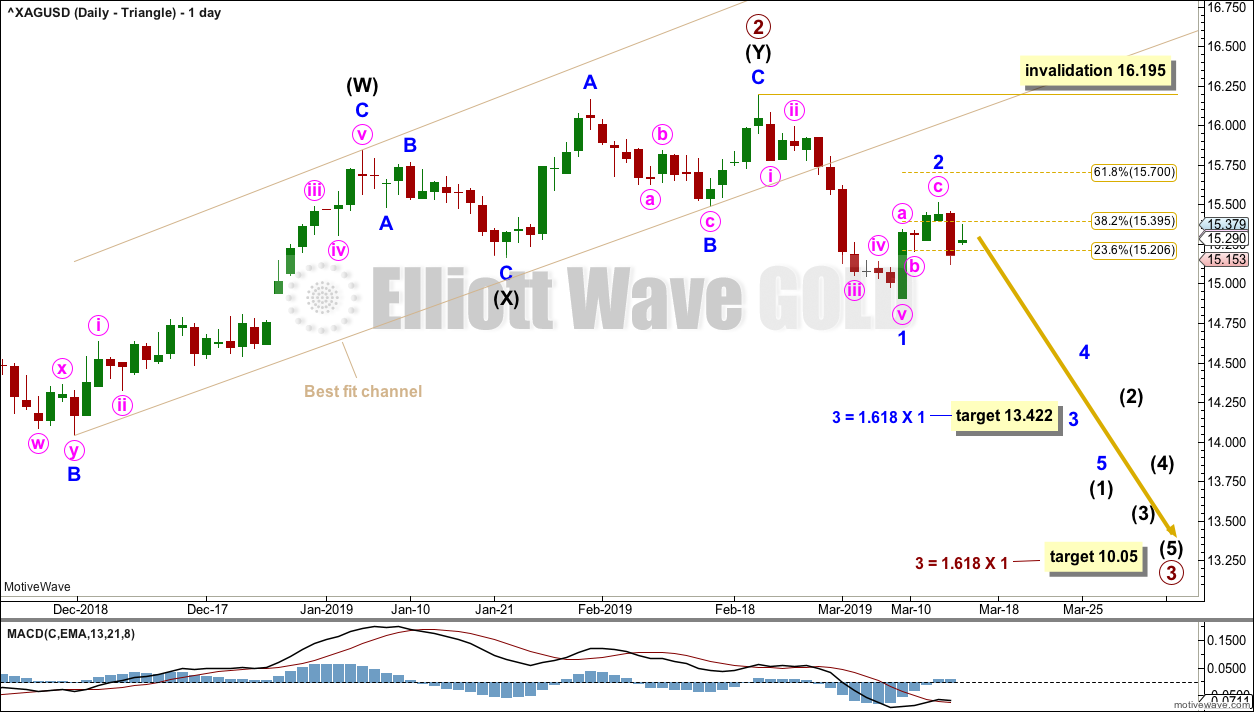
A target is calculated for primary wave 3 to reach the most common Fibonacci ratio to primary wave 1.
Primary wave 3 may only subdivide as an impulse. Within primary wave 3, intermediate wave (1) may be incomplete. Within intermediate wave (1), minor wave 2 may not move beyond the start of minor wave 1 above 16.195.
Minor wave 1 lasted 12 days, just one short of a Fibonacci 13. Minor wave 2 may have been more brief and shallow than expected, lasting only a Fibonacci 3 days and falling short of the 0.618 Fibonacci ratio.
A target is calculated for minor wave 3 that expects it to exhibit the most common Fibonacci ratio to minor wave 1.
ALTERNATE WAVE COUNT
WEEKLY CHART – BULL WAVE COUNT
Click chart to enlarge.
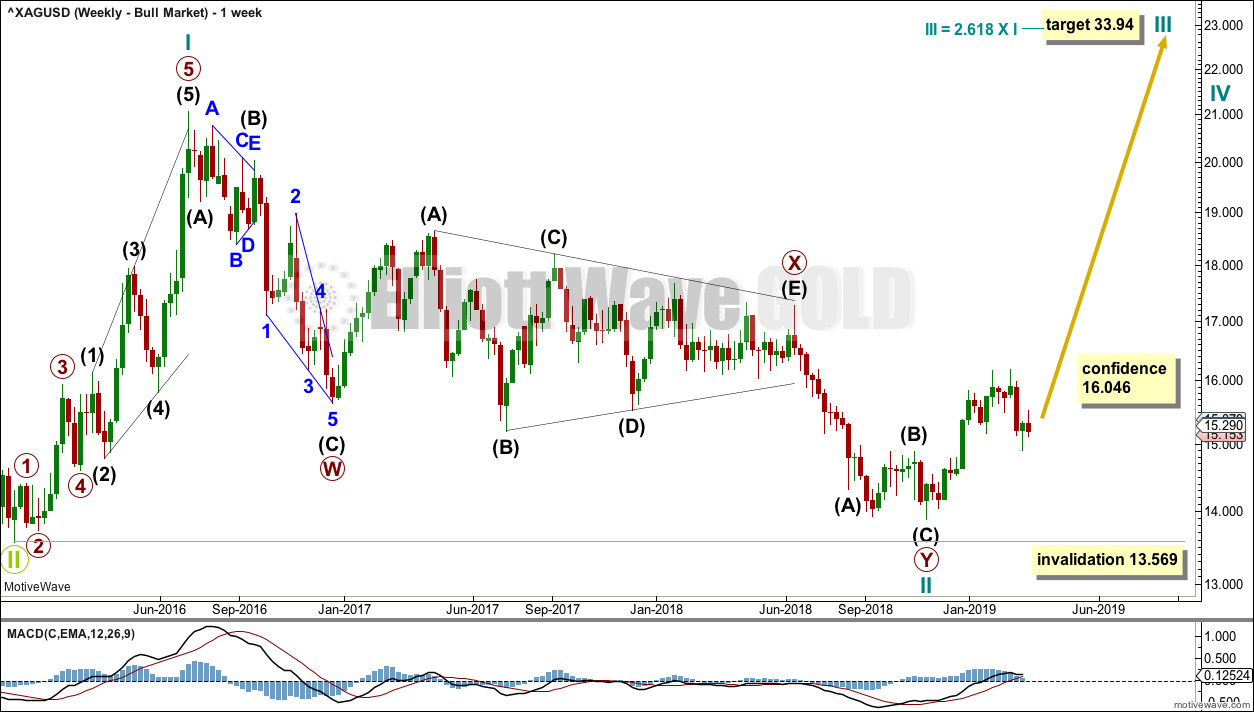
Cycle wave II may be a complete double zigzag. Cycle wave II would be very deep at 0.96 of cycle wave I. This is typical behaviour for the first second wave correction within a new trend for commodities.
If it continues any further, then cycle wave II may not move beyond the start of cycle wave I below 13.569.
DAILY CHART – BULL WAVE COUNT
Click chart to enlarge.
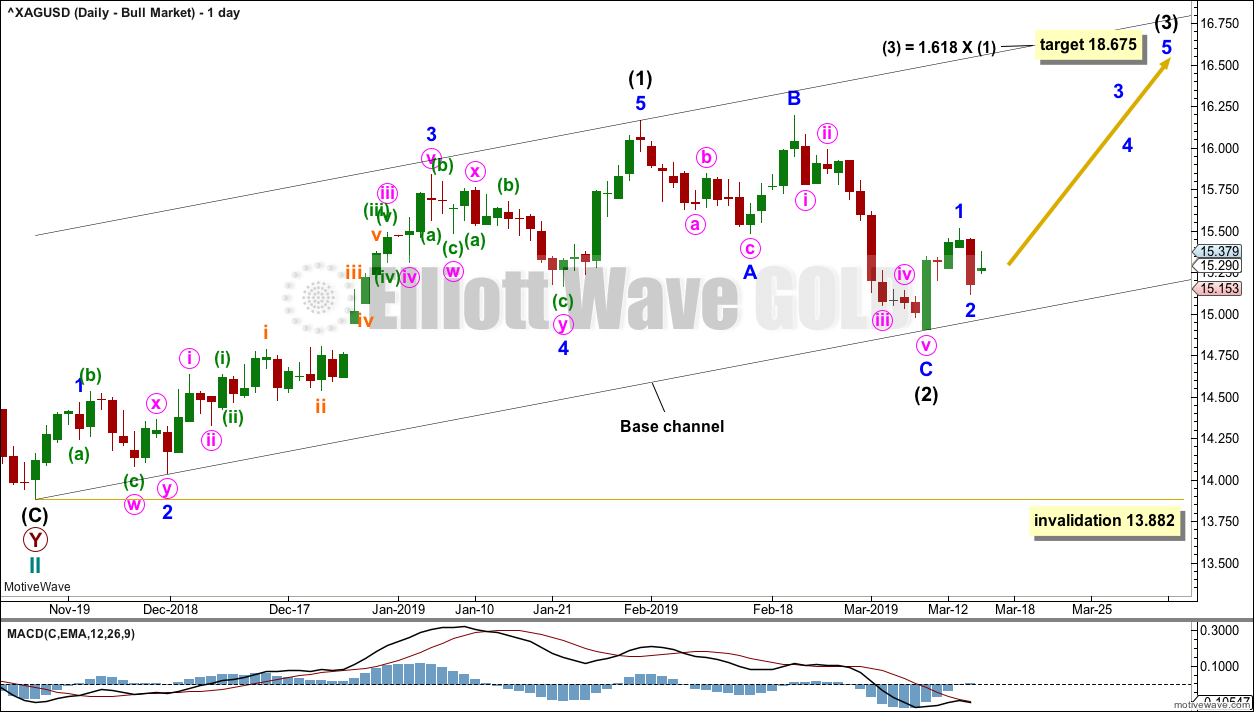
If cycle wave II is over, then the new trend up for cycle wave III should begin with a five wave structure. This is labelled intermediate wave (1). The structure may now be complete.
Intermediate wave (2) may now be a complete regular flat correction. It is also possible it may continue further as a double combination or a double flat correction.
Intermediate wave (2) may not move beyond the start of intermediate wave (1) below 13.882.
This wave count now expects a third wave upwards for intermediate wave (3) is underway.
TECHNICAL ANALYSIS
WEEKLY CHART
Click chart to enlarge. Chart courtesy of StockCharts.com.
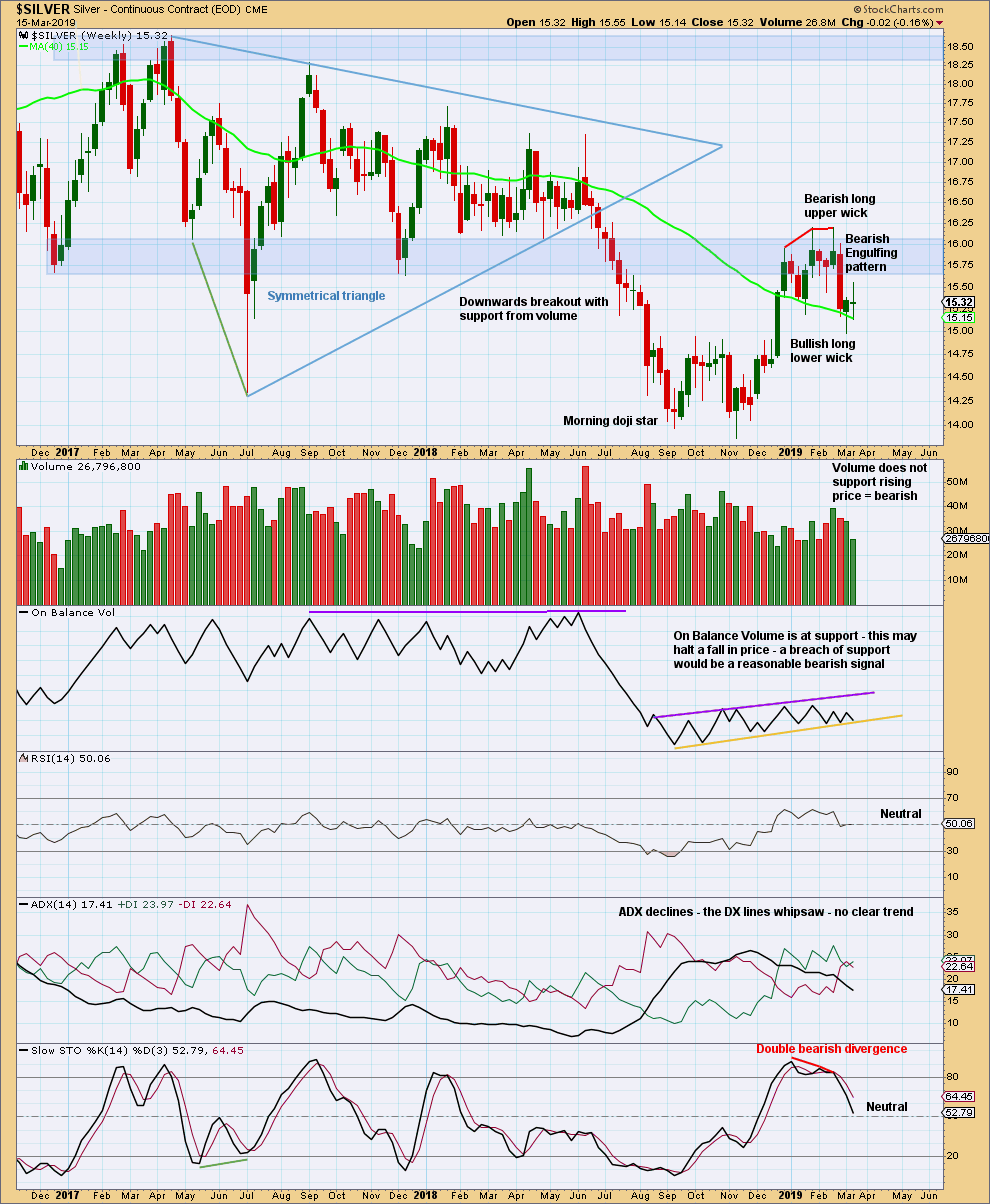
The Bearish Engulfing candlestick pattern engulfs the prior seven weekly candlesticks. It is an extremely strong bearish reversal pattern and offers good support to the Triangle Elliott wave count.
Price has closed below support.
The last weekly candlestick completes as a long legged doji. This puts the trend into neutral. This looks like a possible test of resistance at prior support.
DAILY CHART
Click chart to enlarge. Chart courtesy of StockCharts.com.
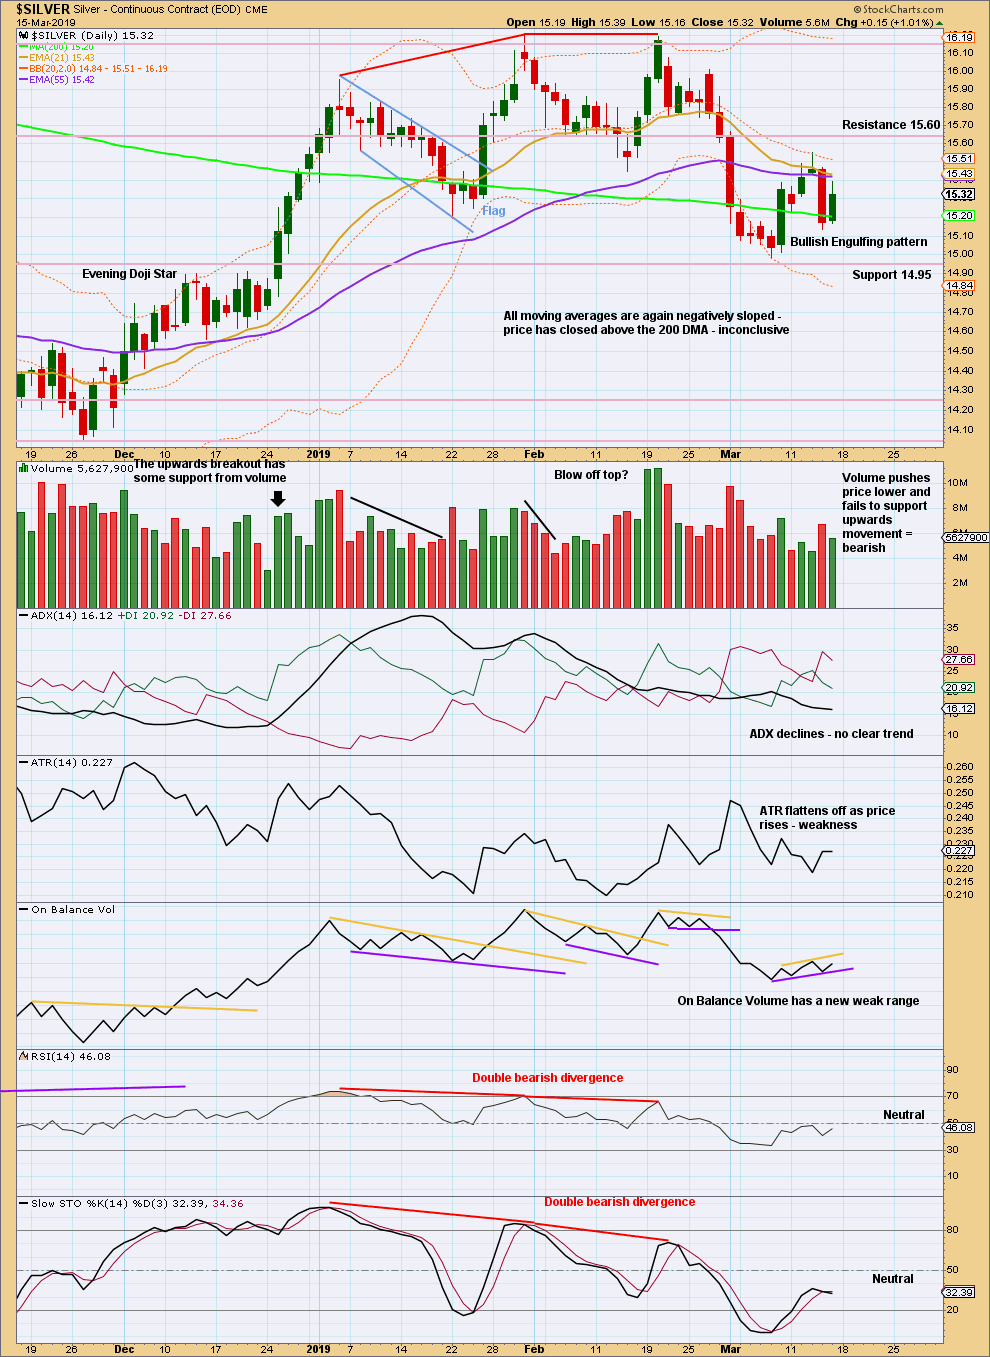
The back test of resistance may have ended, falling a little short of resistance at 15.60. The volume profile suggests it may be over.
Published @ 01:09 a.m. EST on March 10, 2019.
—
Careful risk management protects your trading account(s).
Follow my two Golden Rules:
1. Always trade with stops.
2. Risk only 1-5% of equity on any one trade.