
Price remains within the channel on the daily chart.
Two daily Elliott wave counts are published for members this week.
Summary: While price remains within the channel, assume the trend may remain the same. The target remains at 63.19 to 63.71.
If the blue channel is breached, then expect a third wave down has begun that should make a reasonable new low below 42.37.
There is still weakness in upwards movement; it is possible a high may be in place. It may be best to wait for clarity before having confidence in the next direction of price from here.
The larger picture still sees Oil in a new downwards trend to end reasonably below 26.06.
New updates to this analysis are in bold.
MAIN ELLIOTT WAVE COUNT
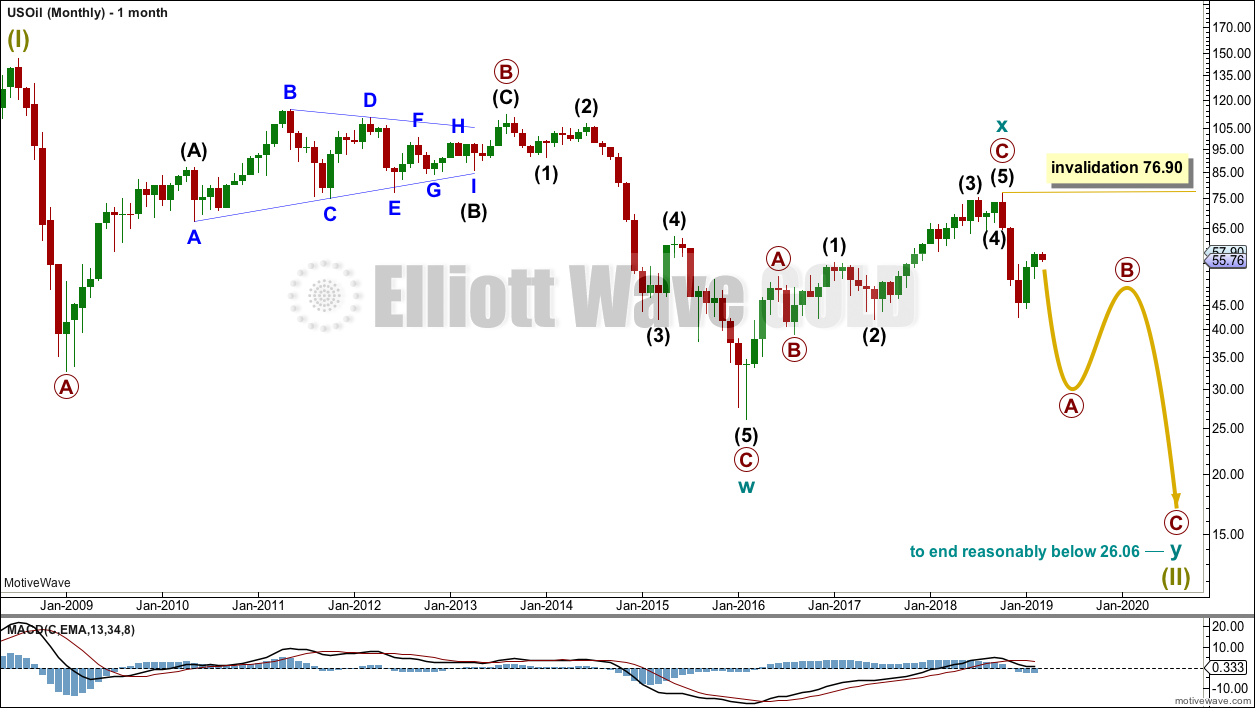
MONTHLY CHART
Click chart to enlarge.
Classic technical analysis favours a bearish wave count for Oil at this time.
The large fall in price from the high in June 2008 to February 2016 is seen as a complete three wave structure. This large zigzag may have been only the first zigzag in a deeper double zigzag.
The first zigzag down is labelled cycle wave w. The double is joined by a now complete three in the opposite direction, a zigzag labelled cycle wave x.
The purpose of a second zigzag in a double is to deepen the correction when the first zigzag does not move price deep enough. Cycle wave y would be expected to move reasonably below the end of cycle wave w to deepen the correction. Were cycle wave y to reach equality with cycle wave w that takes Oil into negative price territory, which is not possible. Cycle wave y would reach 0.618 the length of cycle wave w at $2.33.
A better target calculation would be using the Fibonacci ratios between primary waves A and C within cycle wave y. This cannot be done until both primary waves A and B are complete.
Within cycle wave y, no second wave correction nor B wave may move beyond its start above 76.90.
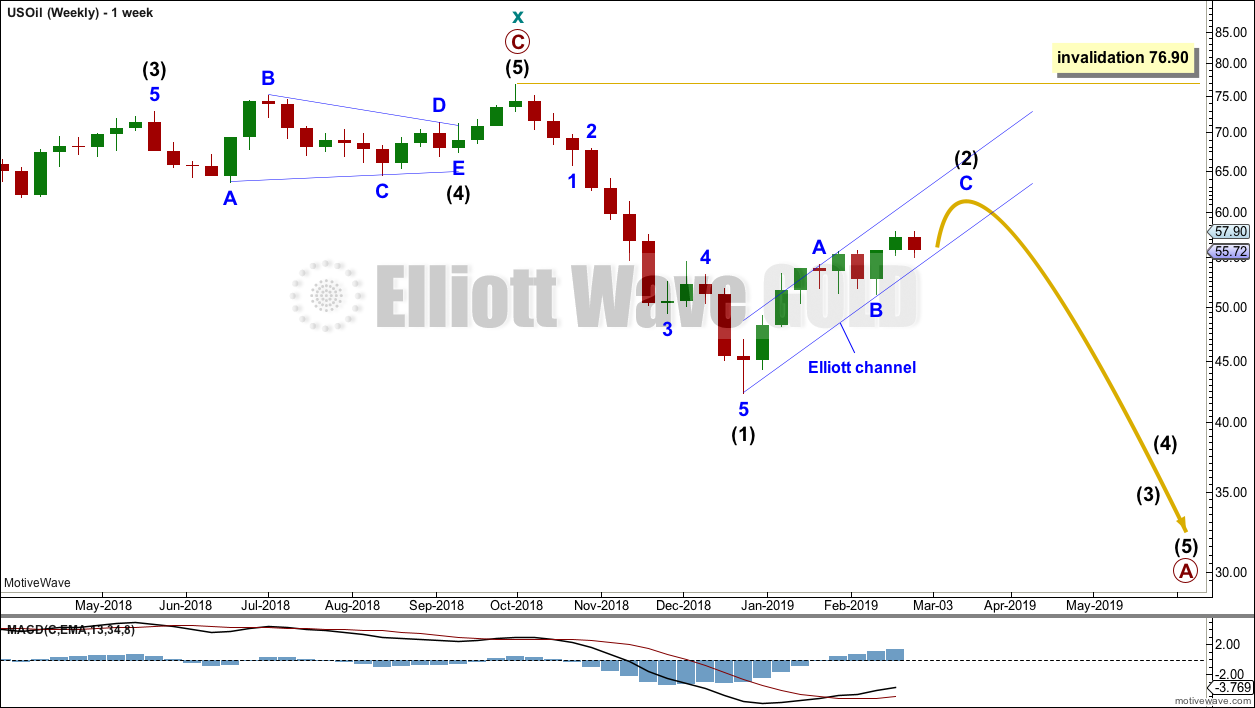
WEEKLY CHART
Click chart to enlarge.
This weekly chart is focussed on the start of cycle wave y.
Cycle wave y is expected to subdivide as a zigzag. A zigzag subdivides 5-3-5. Primary wave A must subdivide as a five wave structure if this wave count is correct.
Within primary wave A, intermediate wave (1) may now be complete. Intermediate wave (2) so far looks like it is unfolding as a zigzag, which is the most common Elliott wave structure for a second wave, and so far it has lasted nine weeks. It is possible that it was complete at this week’s high. If it continues further, it may end in another four weeks to total a Fibonacci thirteen.
Intermediate wave (2) may not move beyond the start of intermediate wave (1) above 76.90.
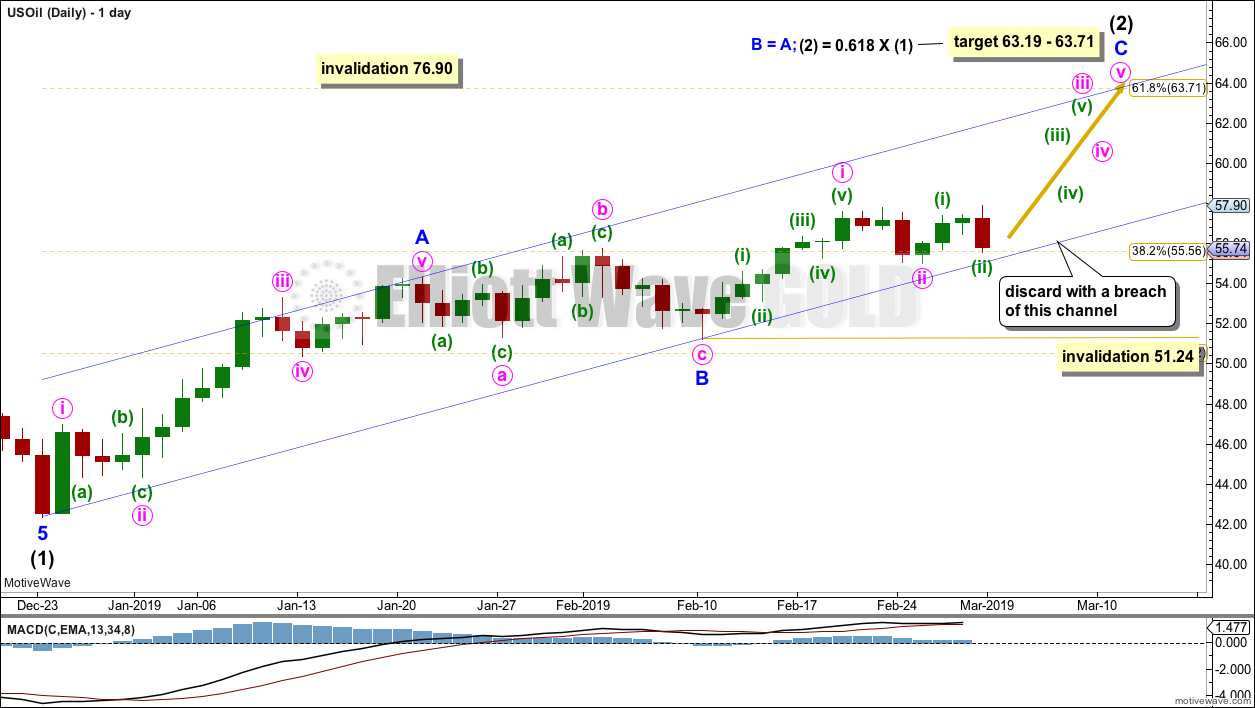
DAILY CHART
Click chart to enlarge.
This is the main wave count, only because we should always assume the trend remains the same until proven otherwise. Assume that this main wave count may be correct while price remains within the blue Elliott channel.
If intermediate wave (2) is unfolding as a zigzag, then within it minor waves A and B may now both be complete.
Another five wave structure upwards for minor wave C may be expected to unfold. Within minor wave C, so far minute waves i and ii may be complete.
The target is now widened to a small zone calculated at two degrees.
The channel is drawn about intermediate wave (2) using Elliott’s technique for a correction. Any pullbacks along the way up within minor wave C may find support about the lower edge of this channel. Minor wave C may end either mid way within the channel or more likely about the upper edge.
A clear breach of the lower edge of the channel by downwards movement (not sideways) would now see this main daily wave count discarded in favour of the alternate below.
Within minor wave C, minute wave ii may not move beyond the start of minute wave i below 51.24.
Intermediate wave (2) may be very deep.
Intermediate wave (2) may not move beyond the start of intermediate wave (1) above 76.90.
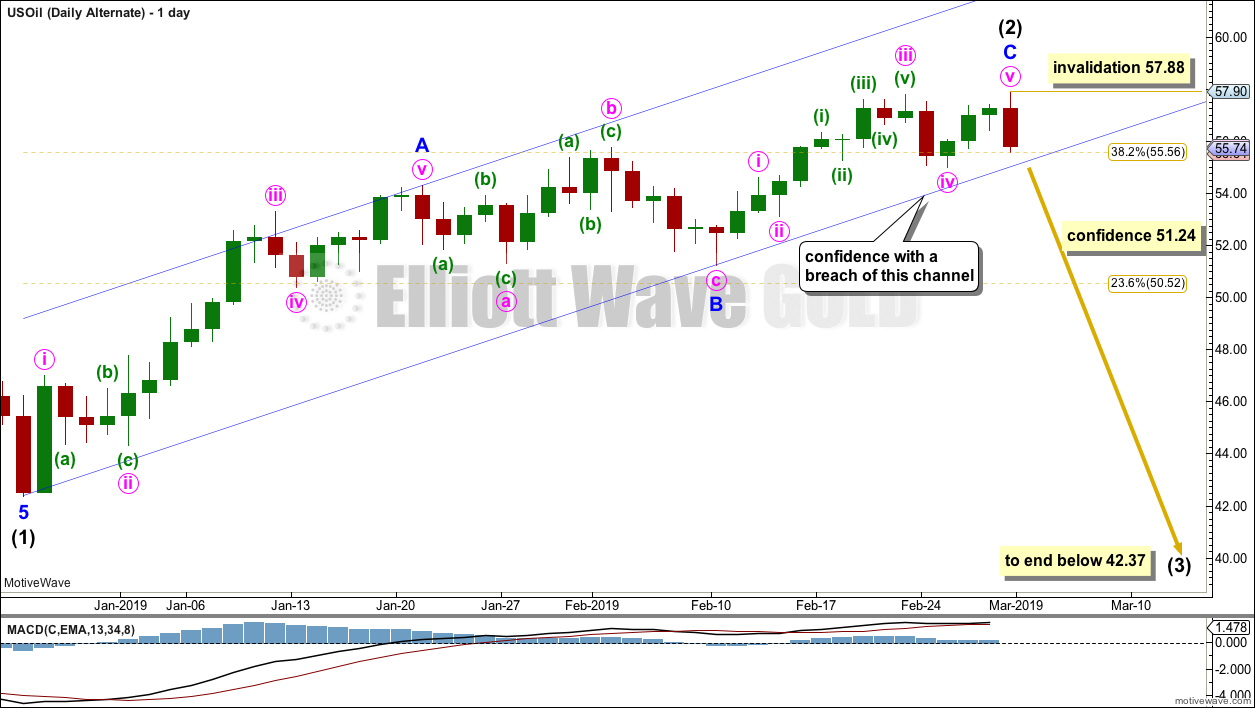
ALTERNATE DAILY CHART
Click chart to enlarge.
It is possible that intermediate wave (2) may be a complete zigzag, ending close to the 0.382 Fibonacci ratio of intermediate wave (1). Confidence in this wave count may be had with a breach of the blue Elliott channel.
Intermediate wave (3) must move beyond the end of intermediate wave (1). Intermediate wave (3) must move far enough below the end of intermediate wave (1) to allow room for intermediate wave (4) to unfold and remain below intermediate wave (1) price territory.
Within intermediate wave (3), no second wave correction may move beyond the start of its first wave above 57.88.
TECHNICAL ANALYSIS
MONTHLY CHART
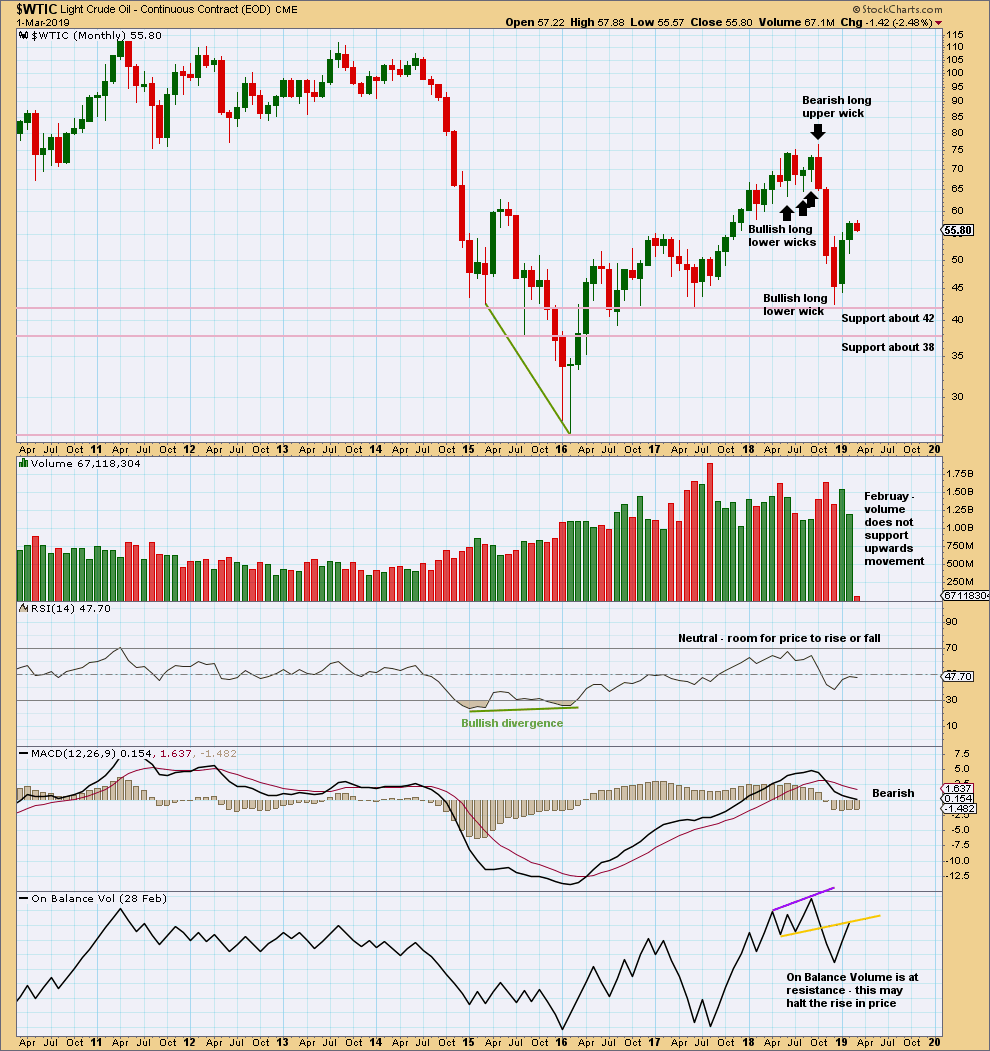
Click chart to enlarge. Chart courtesy of StockCharts.com.
Upwards movement for February lacks support from volume. This bounce may be ending here or very soon.
WEEKLY CHART
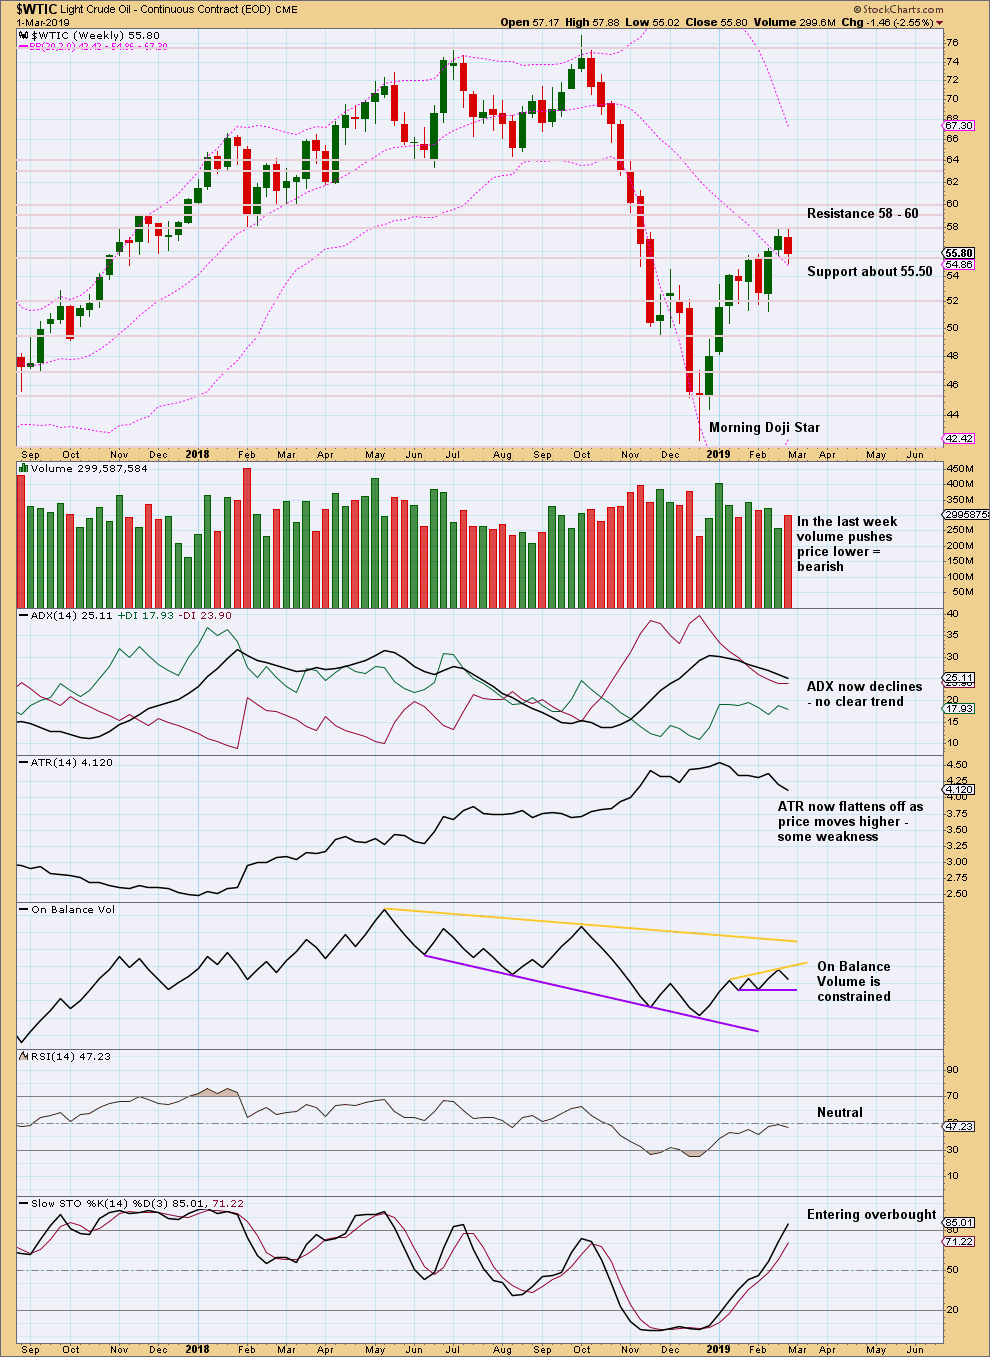
Click chart to enlarge. Chart courtesy of StockCharts.com.
At the weekly chart level, the volume profile is also bearish. This supports the alternate daily Elliott wave count.
The resistance line for On Balance Volume is redrawn.
DAILY CHART

Click chart to enlarge. Chart courtesy of StockCharts.com.
The short-term volume profile is also bearish while price is at resistance. This offers some support to the alternate daily Elliott wave count.
Published @ 07:43 p.m. EST.
—
Careful risk management protects your trading account(s).
Follow my two Golden Rules:
1. Always trade with stops.
2. Risk only 1-5% of equity on any one trade.
Here’s a new idea for US Oil.
Current sideways movement looks like a small triangle may be forming. This may be wave X within a double zigzag. Double zigzags are fairly common corrective structures, particularly for second waves.
The problem now becomes with this idea that minor wave X may not remain contained within the channel that formed about minor wave W. In fact, it may very well breach the channel and that would be not only acceptable but somewhat expected.
Which means that the channel for this idea is not a bottom line.
I’ll be looking at strength within downwards movement if any occurs. If there is any strength then I’ll expect intermediate (2) is over. But if there is reasonable weakness then I’ll consider this idea.
The triangle may yet morph into a double combination. It’s important with Elliott wave triangles to be open to that idea.