
Downwards movement was expected for the week. A lower low and a lower high fits this expectation.
Summary: The downwards trend should now resume. Look out for the possibility of strong downwards momentum ahead. The short-term target is at 13.524.
The long-term target remains at 10.05.
Monthly charts were reviewed here.
New updates to this analysis are in bold.
ELLIOTT WAVE COUNTS
MAIN WAVE COUNT
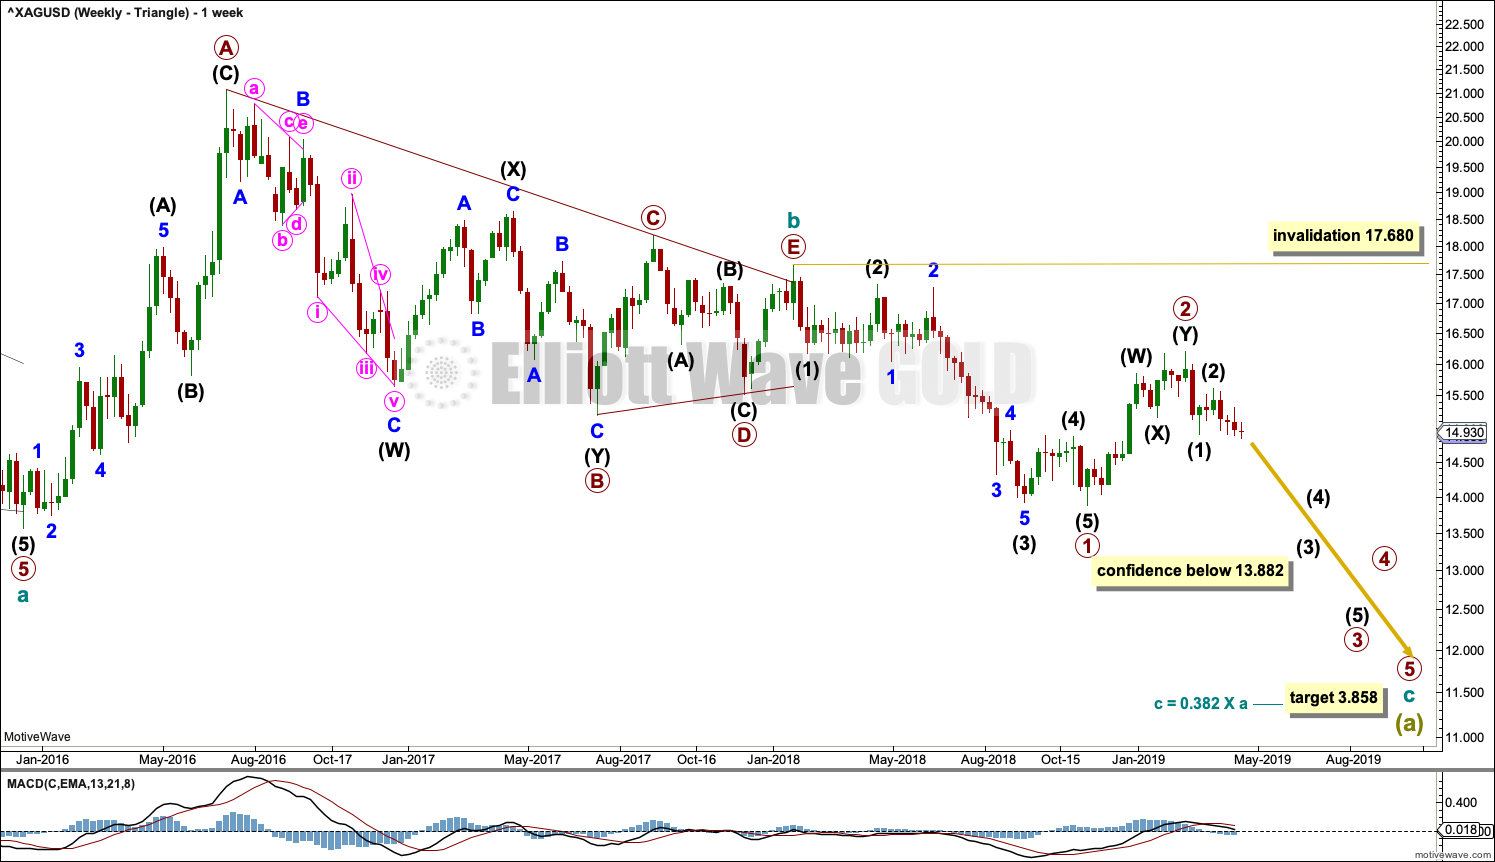
WEEKLY CHART – TRIANGLE
Click chart to enlarge.
This first wave count has good support from classic technical analysis, so it will be favoured. This wave count looks likely.
The first wave count expects that the bear market, which began from the April 2011 high, is incomplete.
Cycle wave a is seen as a five wave impulse for this main wave count.
This first weekly chart sees cycle wave b as a now possibly complete regular contracting triangle.
Primary wave E of the triangle may have ended with an overshoot of the A-C trend line.
Within cycle wave c, primary waves 1 and 2 may now both be complete.
If it continues higher, then primary wave 2 may not move beyond the start of primary wave 1 above 17.680.
Cycle wave c needs to move below the end of cycle wave a below 13.569 in order to avoid a truncation.
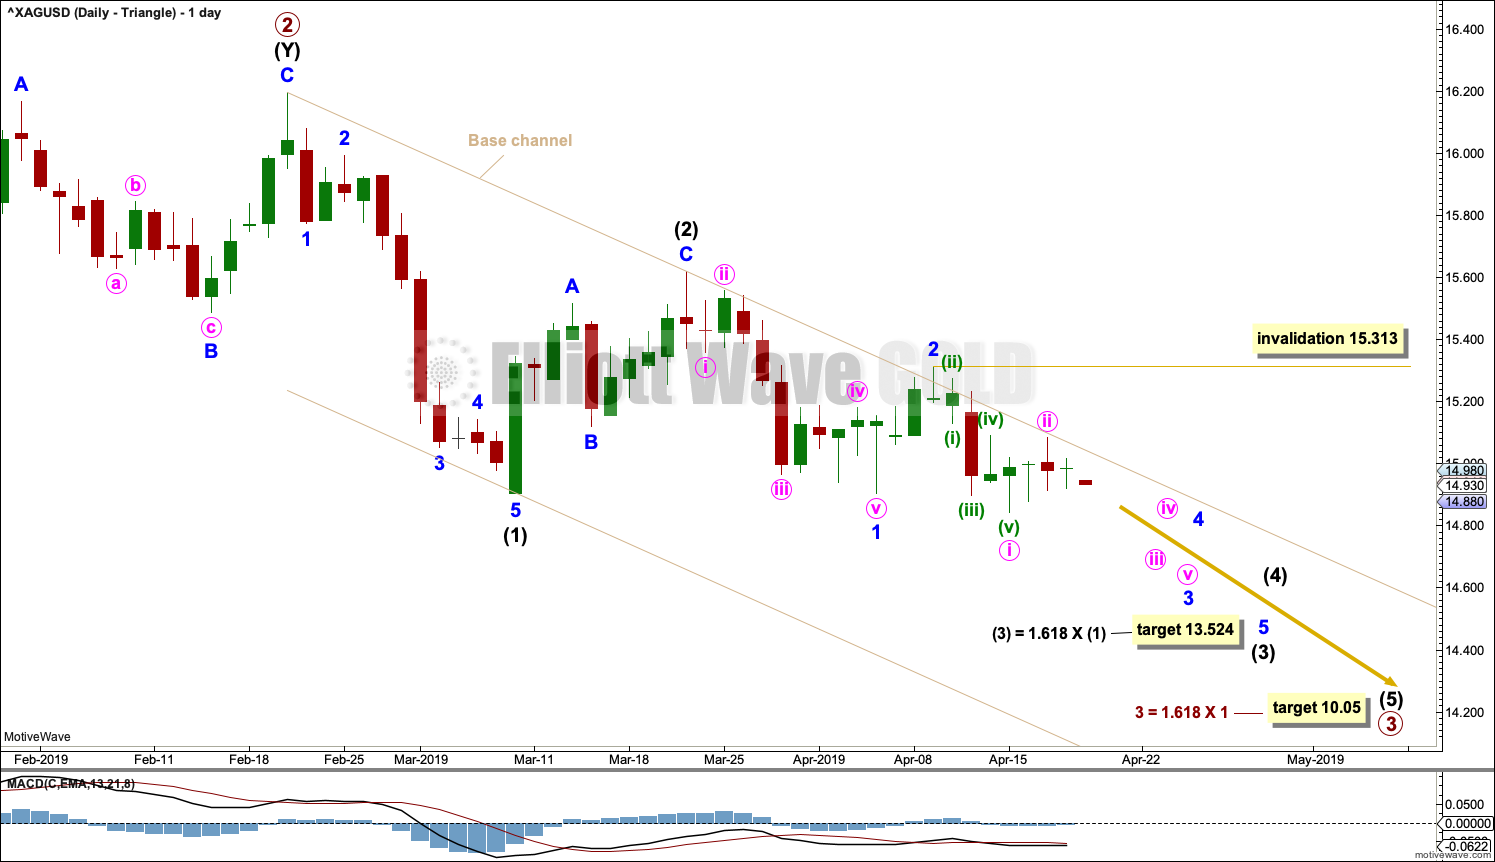
DAILY CHART – TRIANGLE
Click chart to enlarge.
A target is calculated for primary wave 3 to reach the most common Fibonacci ratio to primary wave 1.
A base channel is drawn about the start of primary wave 3. Draw the first trend line of a base channel from the start of the first wave to the end of the second wave, then place a parallel copy on the end of the first wave. In a bear market lower degree second wave corrections may find resistance about the upper edge of the base channel.
Primary wave 3 may only subdivide as an impulse. This week the degree of labelling within primary wave 3 is moved up one degree. Within the impulse, intermediate waves (1) and (2) may be complete.
Intermediate wave (3) may only subdivide as an impulse. Within intermediate wave (3), minor waves 1 and 2 may be complete.
Minor wave 3 may only subdivide as an impulse. Within minor wave 3, minute waves i and ii may be complete. Minute wave ii may have found resistance about the upper edge of the base channel. If it continues any higher, then minute wave ii may not move beyond the start of minute wave i above 15.313.
This wave count now sees a series of four first and second waves complete. A strong increase in downwards momentum may be ahead as the middle and end of third waves unfold.
ALTERNATE WAVE COUNT
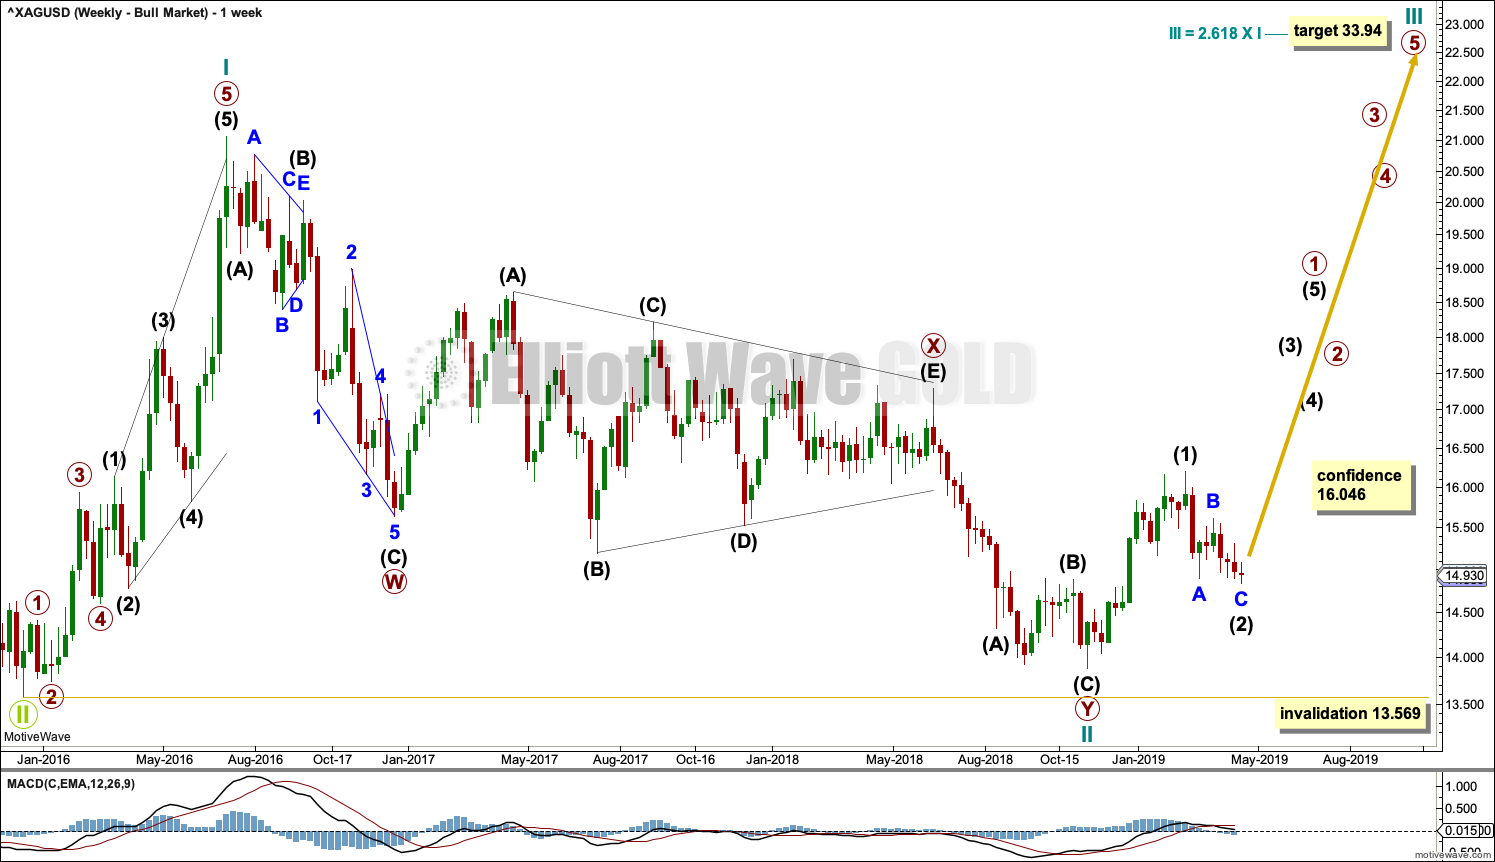
WEEKLY CHART – BULL WAVE COUNT
Click chart to enlarge.
This alternate wave count sees the bear market over for Silver and a new bull market beginning.
Cycle wave II may be a complete double zigzag. Cycle wave II would be very deep at 0.96 of cycle wave I. This is typical behaviour for the first second wave correction within a new trend for commodities.
If it continues any further, then cycle wave II may not move beyond the start of cycle wave I below 13.569.
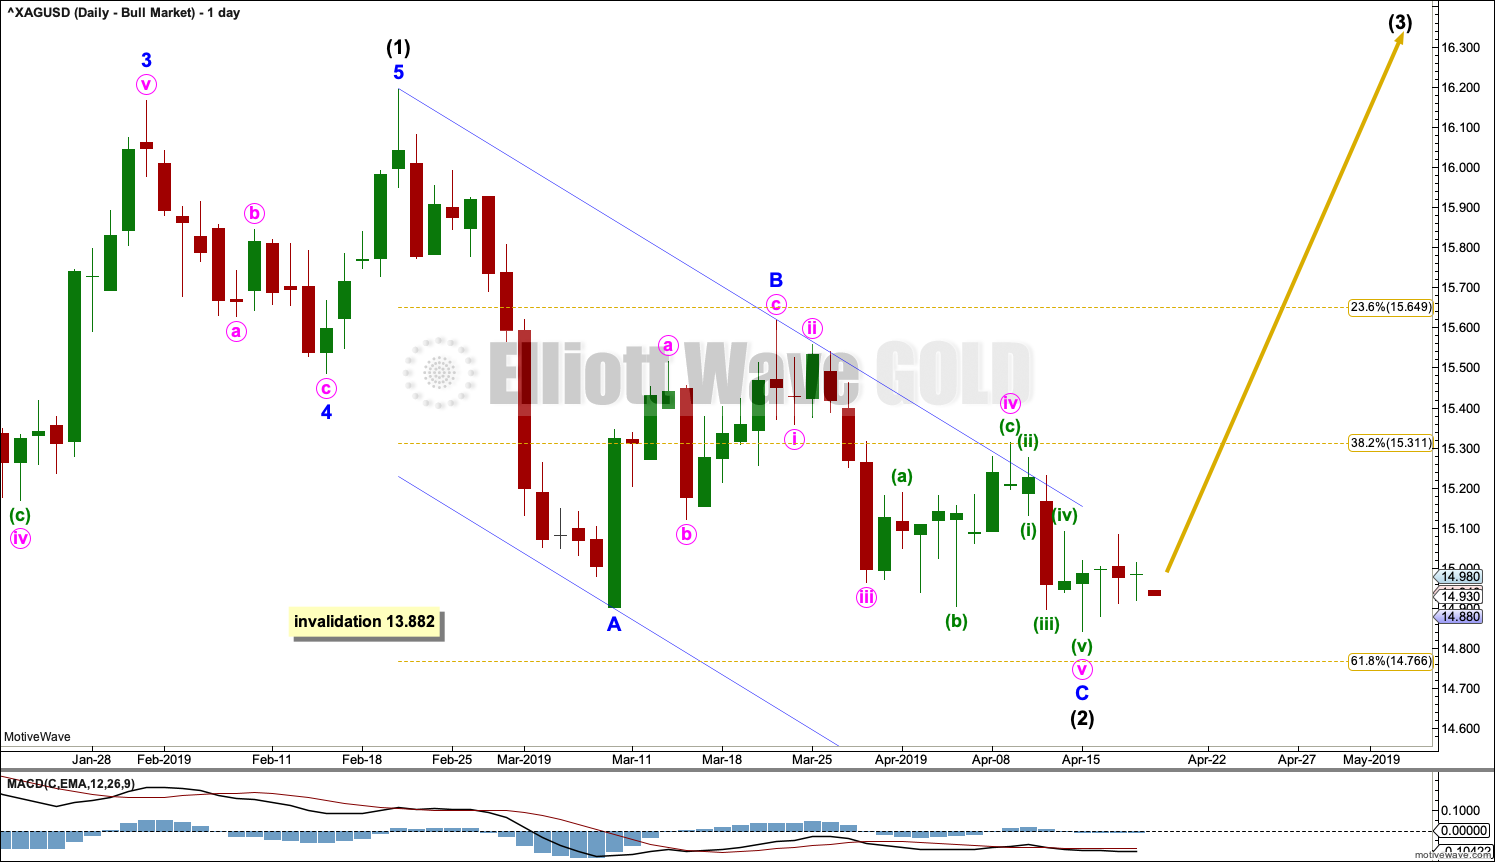
DAILY CHART – BULL WAVE COUNT
Click chart to enlarge.
If cycle wave II is over, then the new trend up for cycle wave III should begin with a five wave structure. This is labelled intermediate wave (1). The structure may now be complete.
Intermediate wave (2) may now be a complete zigzag.
If it continues lower as a double zigzag, then intermediate wave (2) may not move beyond the start of intermediate wave (1) below 13.882.
TECHNICAL ANALYSIS
WEEKLY CHART
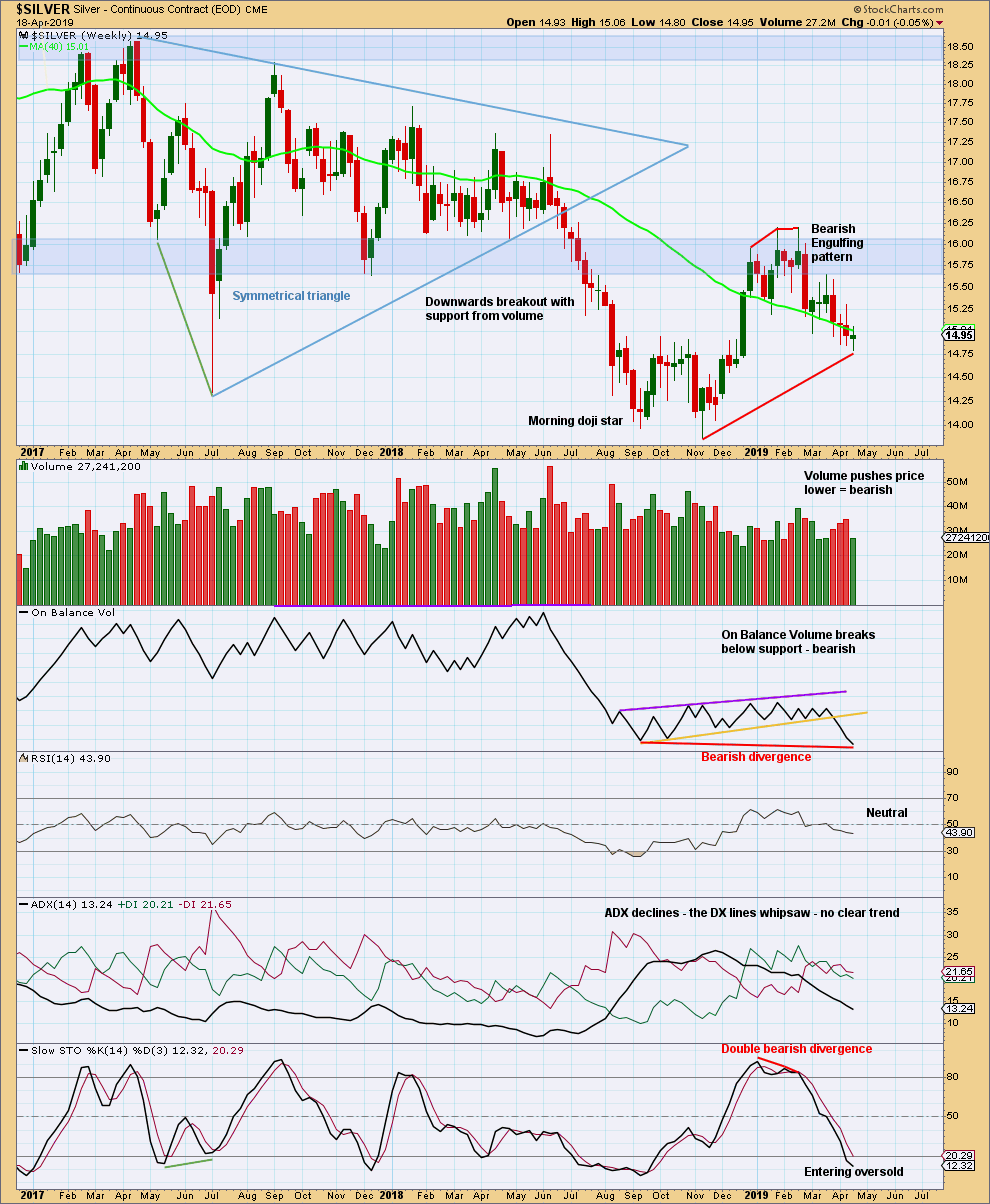
Click chart to enlarge. Chart courtesy of StockCharts.com.
The short-term volume profile remains bearish. This week was a short-trading week, so no conclusions may be drawn from some decline in volume.
DAILY CHART
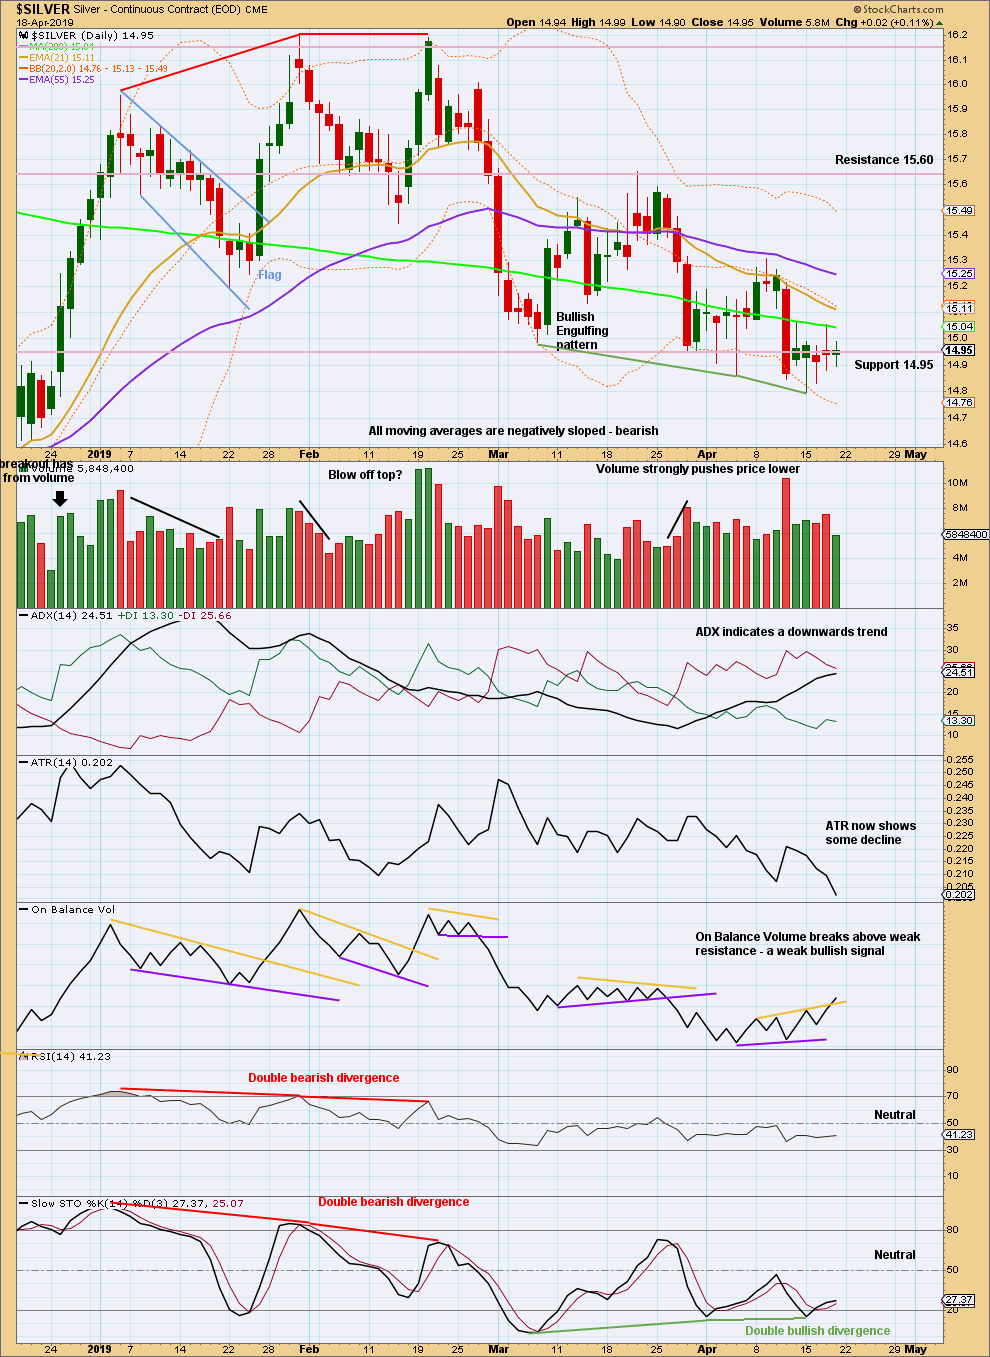
Click chart to enlarge. Chart courtesy of StockCharts.com.
There is now a series of four lower lows and lower highs from the high on the 31st of January. ADX agrees there is a downwards trend in place.
A close below support at 14.95 was unable to be retained this week. A bullish signal from On Balance Volume also suggests there is risk here for a near term bounce within the new downwards trend.
Published @ 12:41 a.m. EST on April 21, 2019.
—
Careful risk management protects your trading account(s).
Follow my two Golden Rules:
1. Always trade with stops.
2. Risk only 1-5% of equity on any one trade.