
Downwards movement was again expected for the week. An outside week completes, with the bounce at the end of the week remaining below the Elliott wave invalidation point.
Summary: A bounce may continue a little higher here. The highest possibility for it to end may be about 15.285. Thereafter, the downwards trend should resume.
The short-term target is at 13.524.
The long-term target remains at 10.05.
Monthly charts were reviewed here.
New updates to this analysis are in bold.
ELLIOTT WAVE COUNTS
MAIN WAVE COUNT
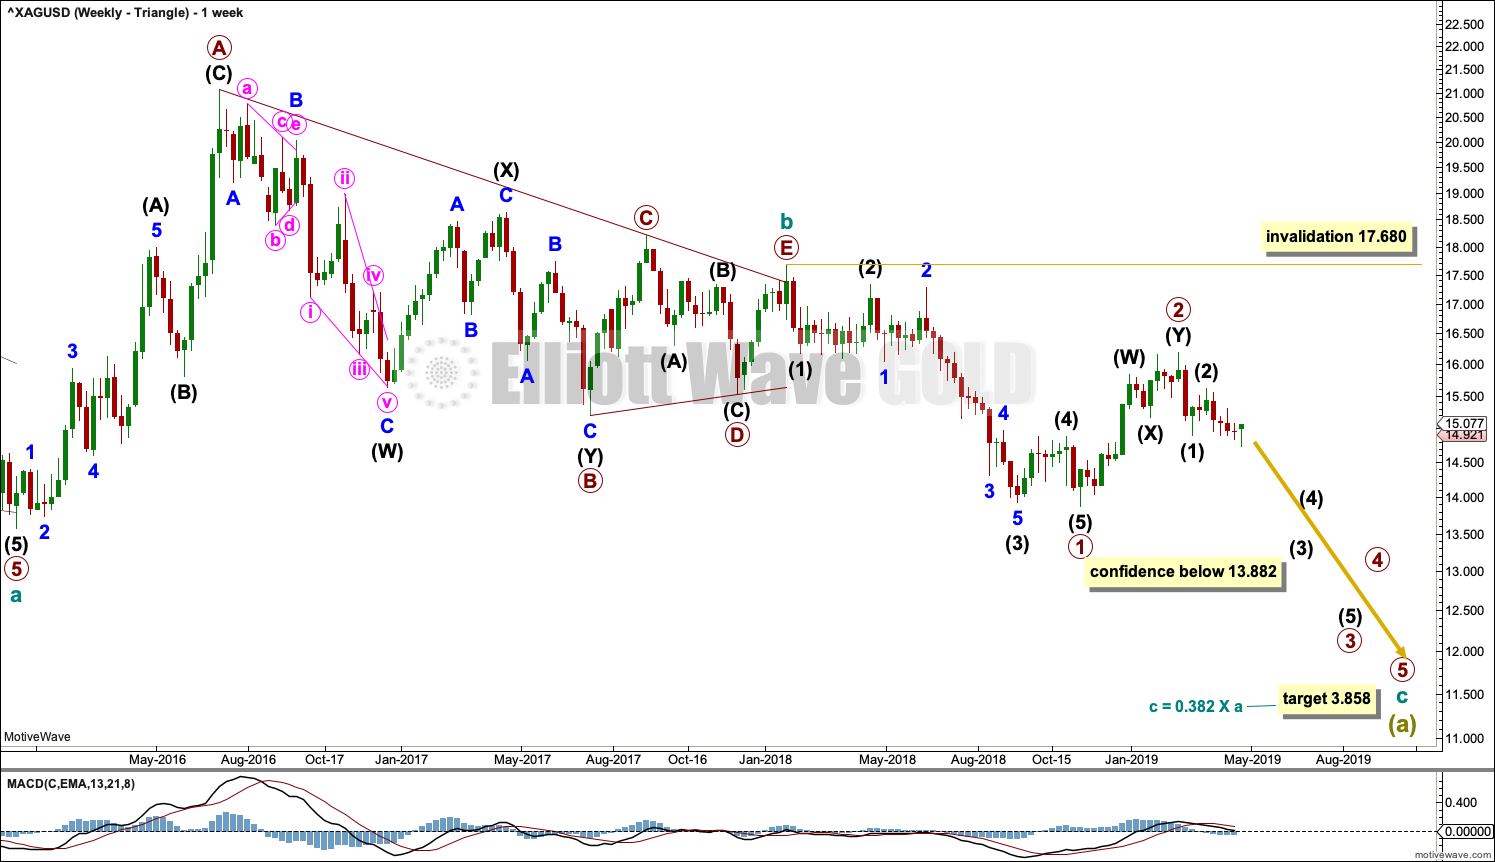
WEEKLY CHART – TRIANGLE
Click chart to enlarge.
This first wave count has good support from classic technical analysis, so it will be favoured. This wave count looks likely.
The first wave count expects that the bear market, which began from the April 2011 high, is incomplete.
Cycle wave a is seen as a five wave impulse for this main wave count.
This first weekly chart sees cycle wave b as a now possibly complete regular contracting triangle.
Primary wave E of the triangle may have ended with an overshoot of the A-C trend line.
Within cycle wave c, primary waves 1 and 2 may now both be complete.
If it continues higher, then primary wave 2 may not move beyond the start of primary wave 1 above 17.680.
Cycle wave c needs to move below the end of cycle wave a below 13.569 in order to avoid a truncation.
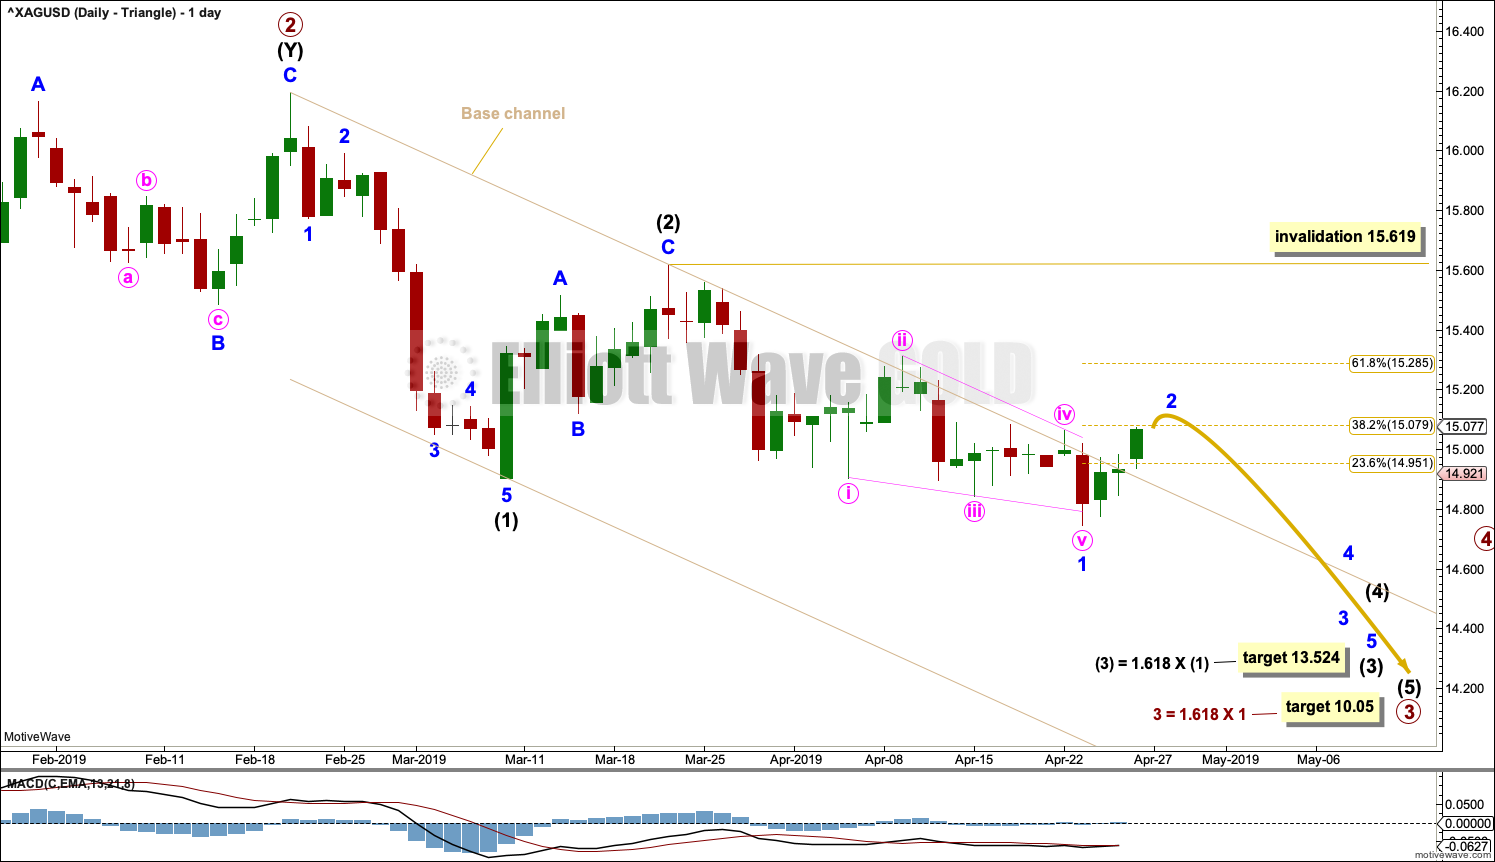
DAILY CHART – TRIANGLE
Click chart to enlarge.
A target is calculated for primary wave 3 to reach the most common Fibonacci ratio to primary wave 1.
The base channel drawn about intermediate waves (1) and (2) is now breached. Base channels most often work to show where lower degree second waves find support or resistance, but not always.
Intermediate wave (3) must subdivide as an impulse. Within intermediate wave (3), minor wave 1 may have been complete at the last low as a leading contracting diagonal.
Following leading diagonals in first wave positions, the next correction is usually fairly deep. Minor wave 2 may end about here, or it may continue higher to end closer to the 0.618 Fibonacci ratio of minor wave 1.
Minor wave 2 may not move beyond the start of minor wave 1 above 15.619.
ALTERNATE WAVE COUNT
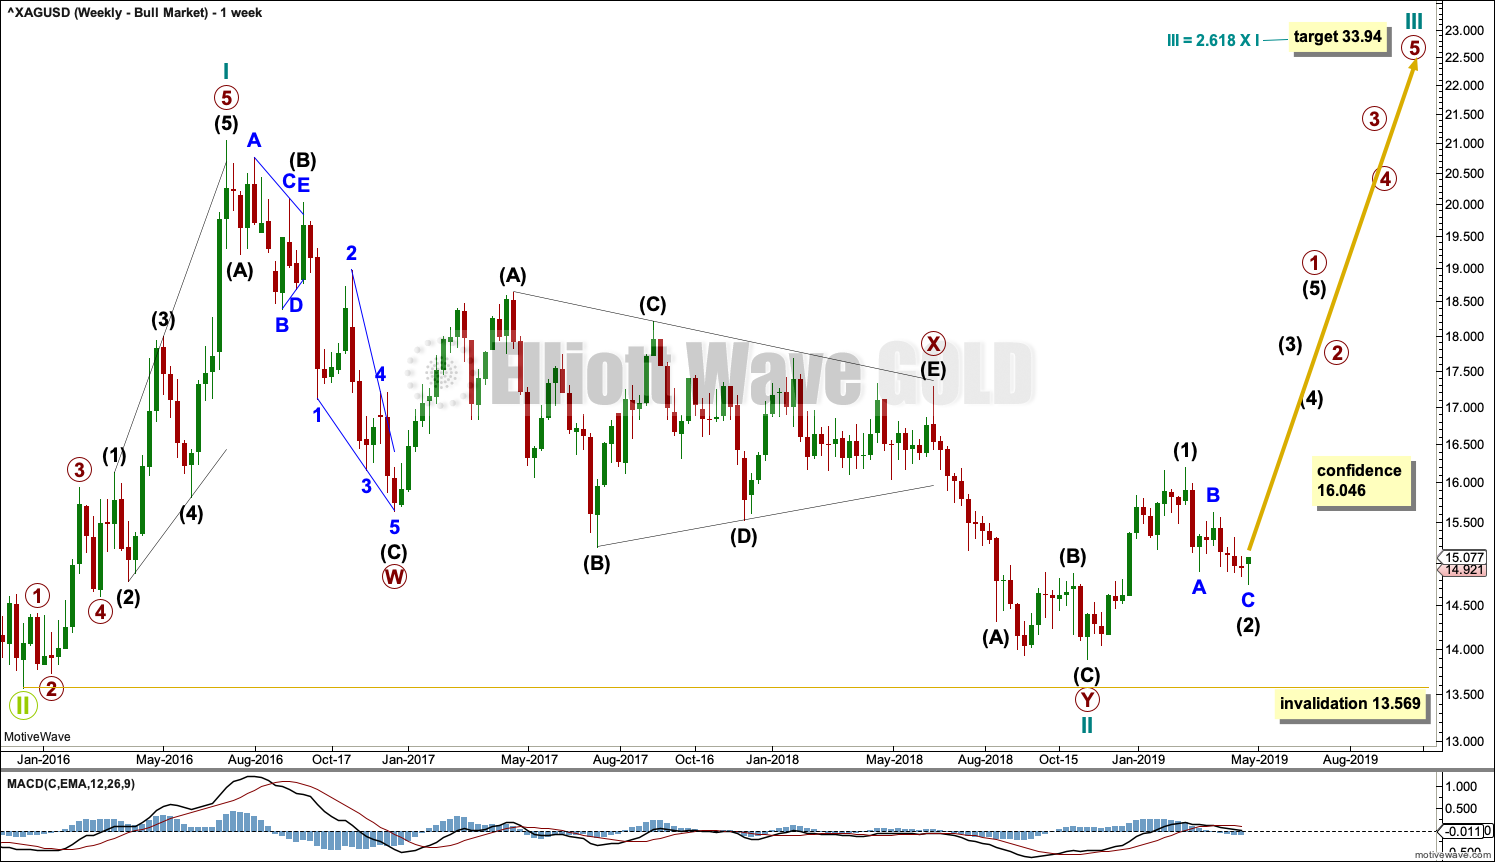
WEEKLY CHART – BULL WAVE COUNT
Click chart to enlarge.
This alternate wave count sees the bear market over for Silver and a new bull market beginning.
Cycle wave II may be a complete double zigzag. Cycle wave II would be very deep at 0.96 of cycle wave I. This is typical behaviour for the first second wave correction within a new trend for commodities.
If it continues any further, then cycle wave II may not move beyond the start of cycle wave I below 13.569.
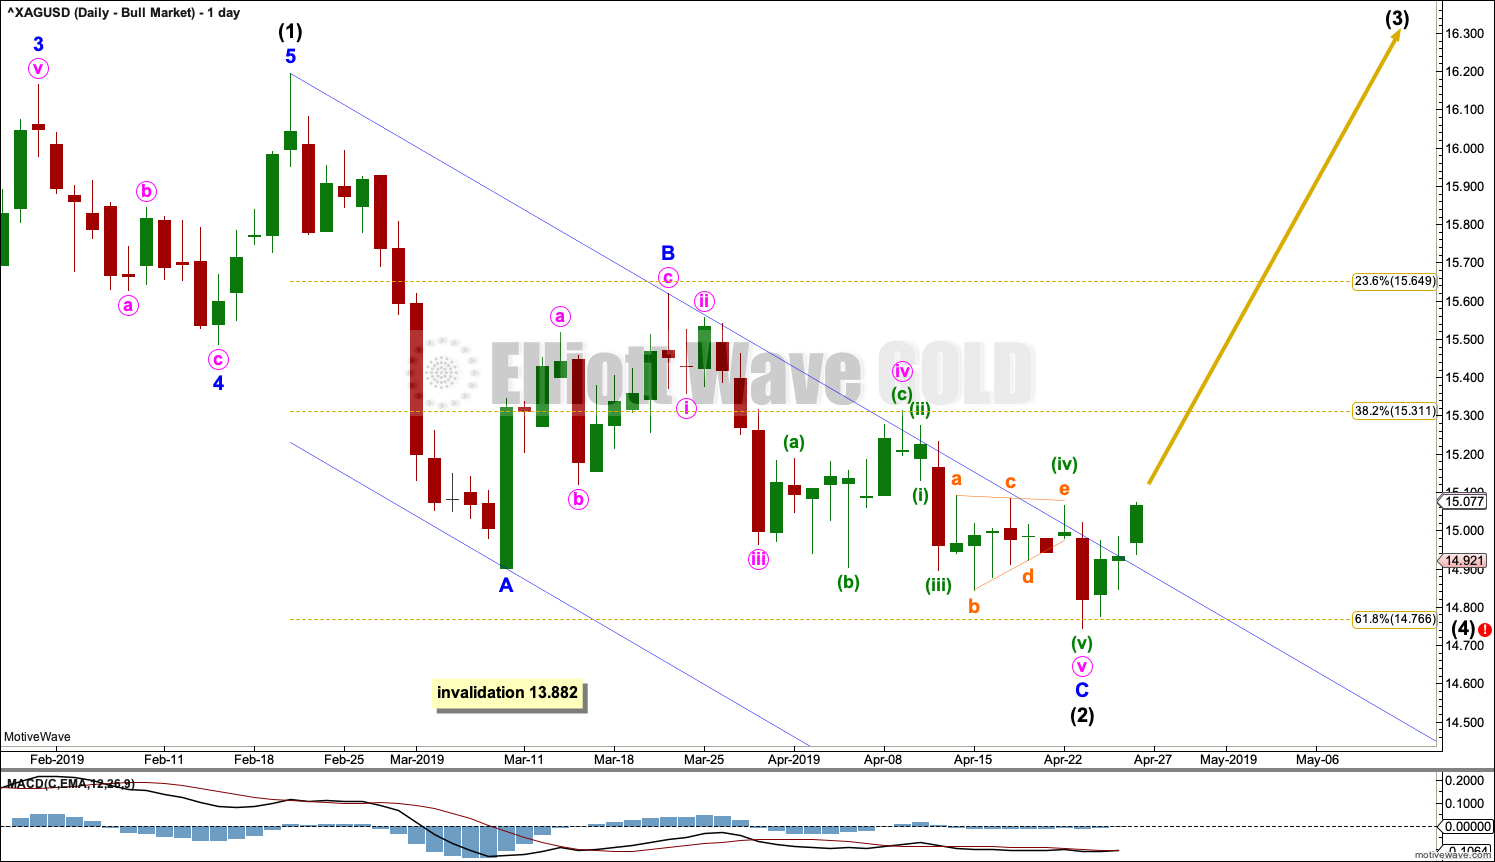
DAILY CHART – BULL WAVE COUNT
Click chart to enlarge.
If cycle wave II is over, then the new trend up for cycle wave III should begin with a five wave structure. This is labelled intermediate wave (1). The structure may now be complete.
Intermediate wave (2) may now be a complete zigzag. Friday’s candlestick has breached the channel about intermediate wave (2) suggesting this downwards wave is over and a new upwards wave has begun.
If it continues lower as a double zigzag, then intermediate wave (2) may not move beyond the start of intermediate wave (1) below 13.882.
TECHNICAL ANALYSIS
WEEKLY CHART
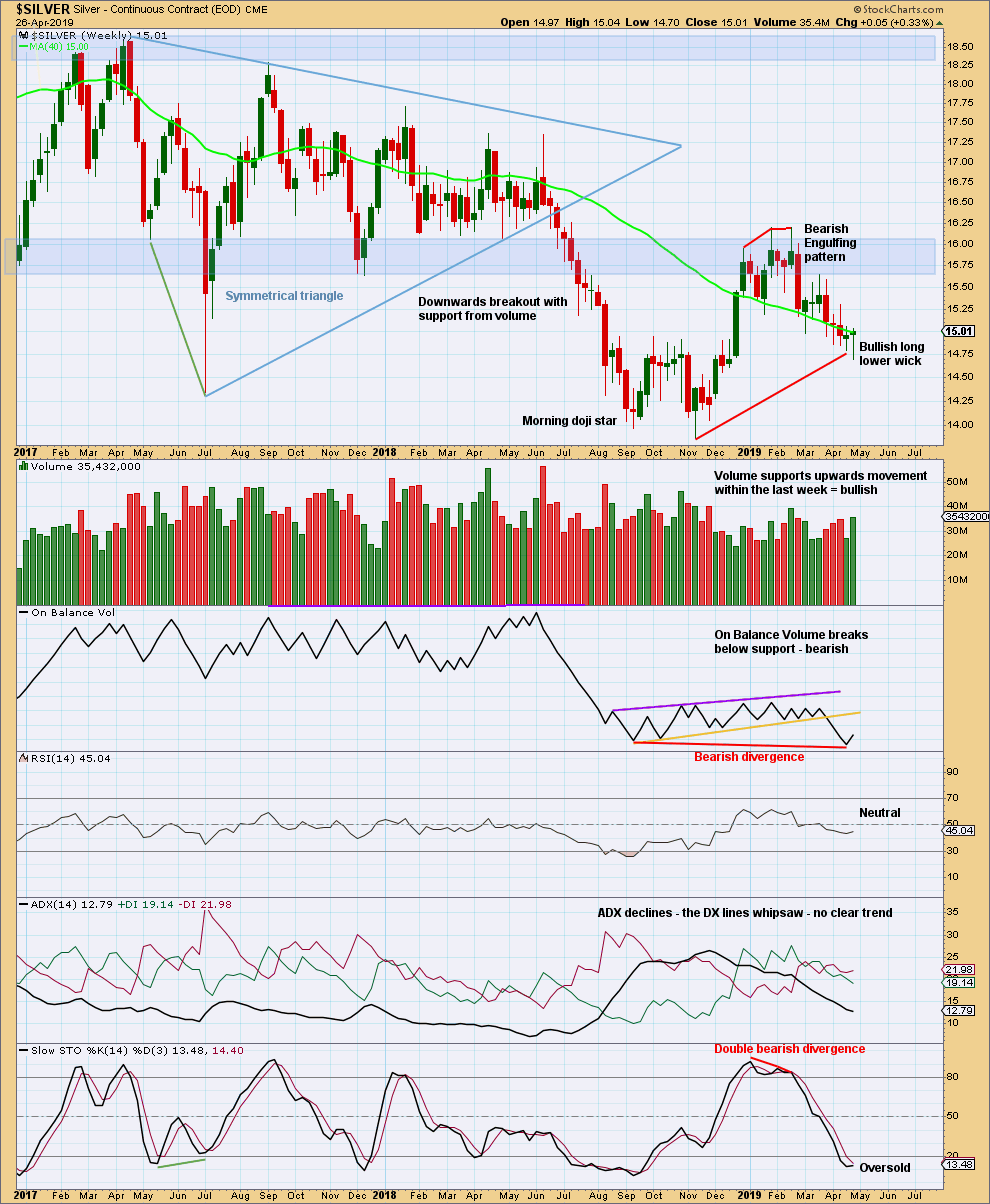
Click chart to enlarge. Chart courtesy of StockCharts.com.
This week completes an outside week that closed green with the balance of volume upwards. Volume supports upwards movement within the week, but it may be better to look inside the week at the daily volume bars to judge the short-term volume profile.
The bullish long lower wick should be given weight in this analysis. It suggests more upwards movement next week.
DAILY CHART
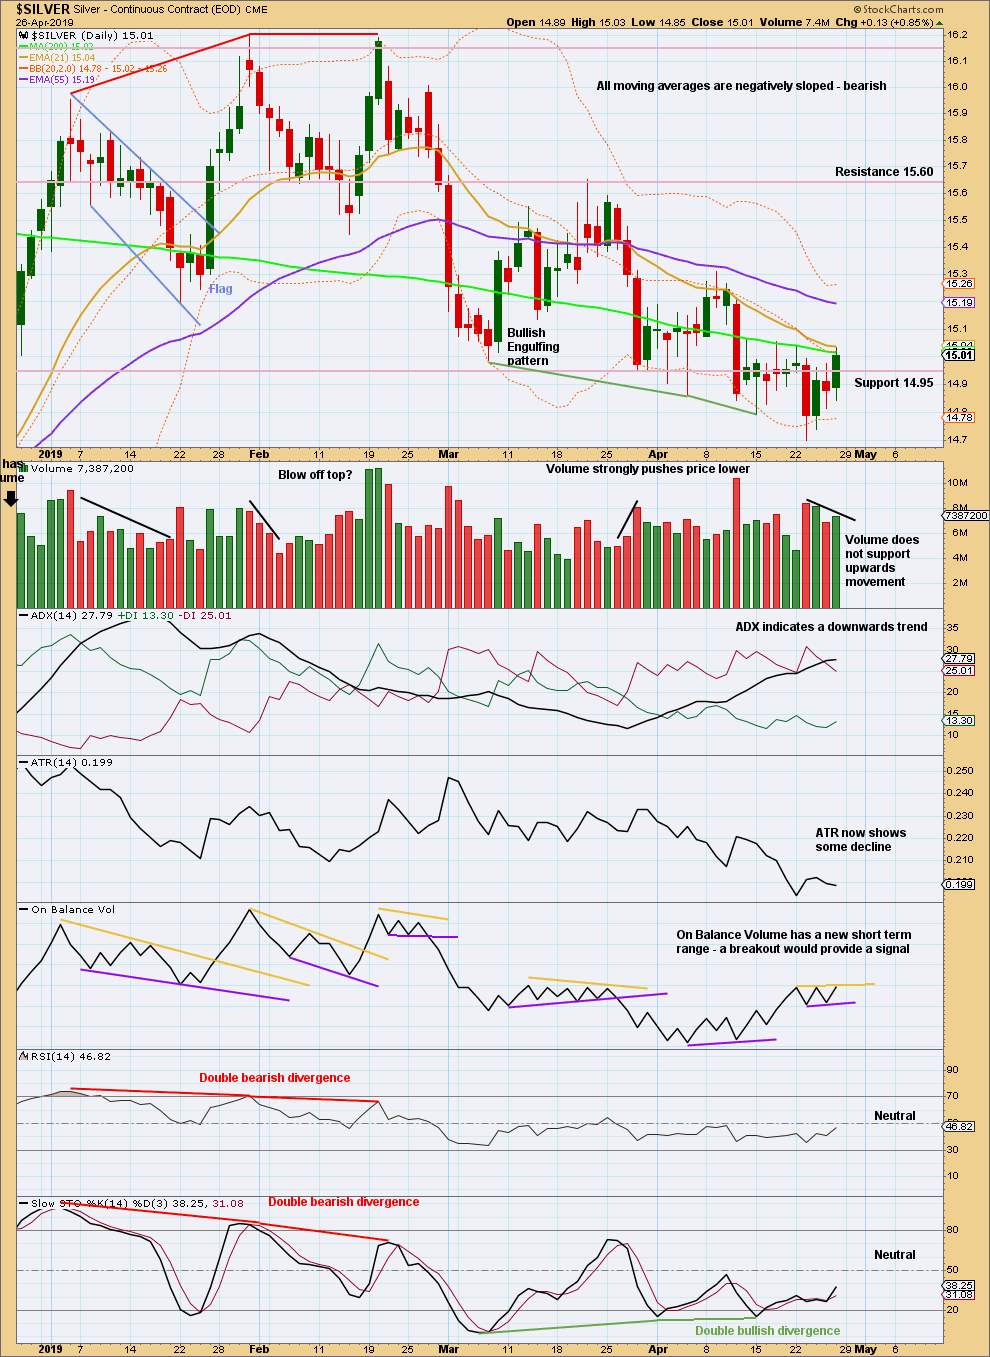
Click chart to enlarge. Chart courtesy of StockCharts.com.
There is now a series of four lower lows and lower highs from the high on the 31st of January. ADX agrees there is a downwards trend in place.
The short-term volume profile is bearish.
A signal here from On Balance Volume would be weak as the new trend lines have not been long held nor often tested.
Published @ 07:06 p.m. EST.
—
Careful risk management protects your trading account(s).
Follow my two Golden Rules:
1. Always trade with stops.
2. Risk only 1-5% of equity on any one trade.