
Last week’s analysis expected more downwards movement for Silver. A lower low and a lower high for the week meet this expectation.
Summary: A small bounce may begin the next week. Thereafter, the downwards trend should resume. The short-term target is at 13.524.
The long-term target remains at 10.05.
Monthly charts were reviewed here.
New updates to this analysis are in bold.
ELLIOTT WAVE COUNTS
MAIN WAVE COUNT
WEEKLY CHART – TRIANGLE
Click chart to enlarge.
This first wave count has good support from classic technical analysis, so it will be favoured. This wave count looks likely.
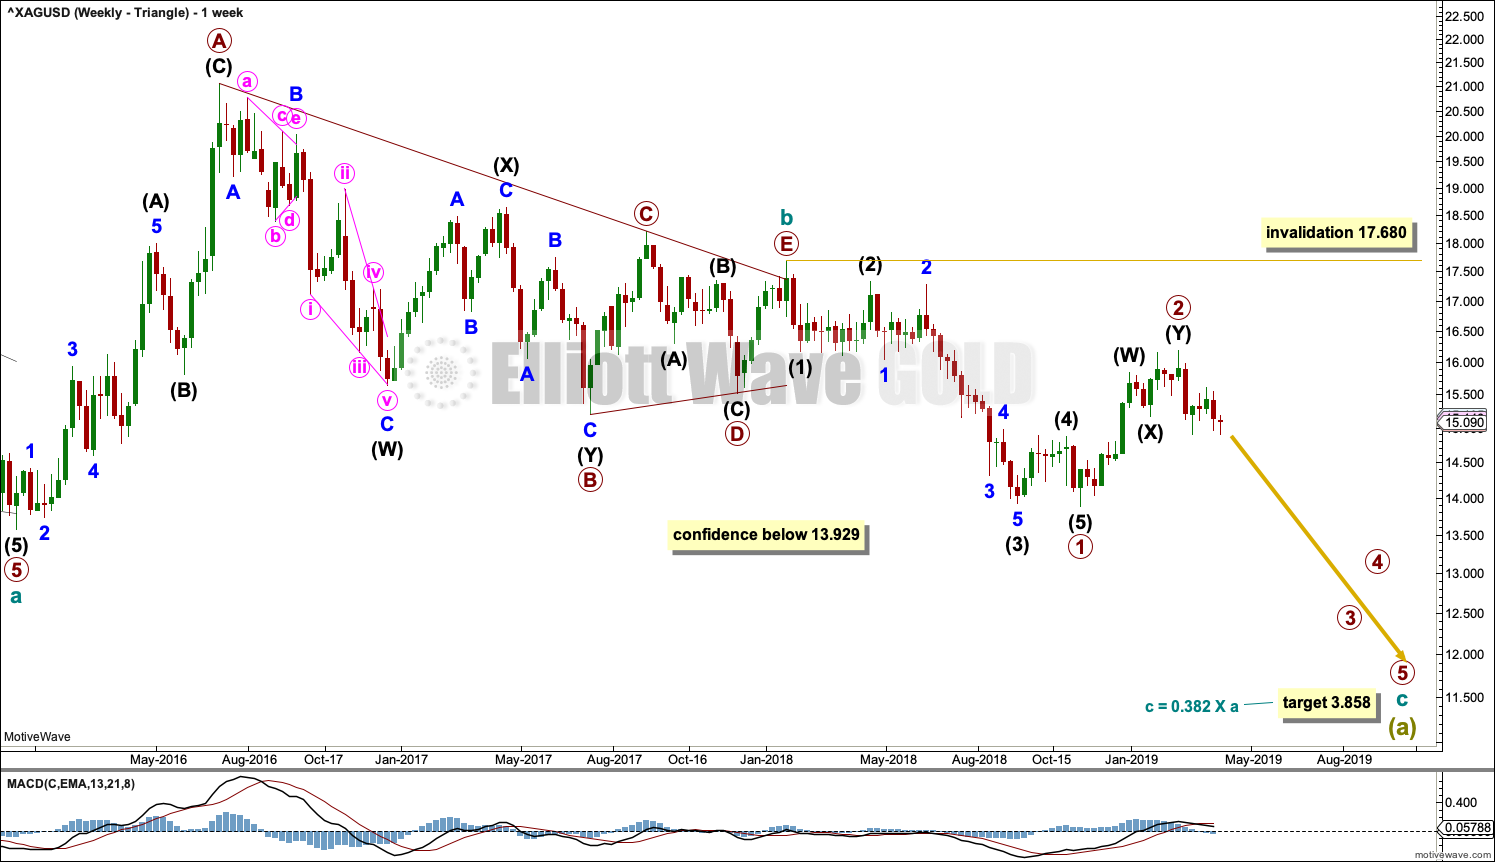
The first wave count expects that the bear market, which began from the April 2011 high, is incomplete.
Cycle wave a is seen as a five wave impulse for this main wave count.
This first weekly chart sees cycle wave b as a now possibly complete regular contracting triangle.
Primary wave E of the triangle may have ended with an overshoot of the A-C trend line.
Within cycle wave c, primary waves 1 and 2 may now both be complete.
If it continues higher, then primary wave 2 may not move beyond the start of primary wave 1 above 17.680.
Cycle wave c needs to move below the end of cycle wave a below 13.569 in order to avoid a truncation.
DAILY CHART – TRIANGLE
Click chart to enlarge.
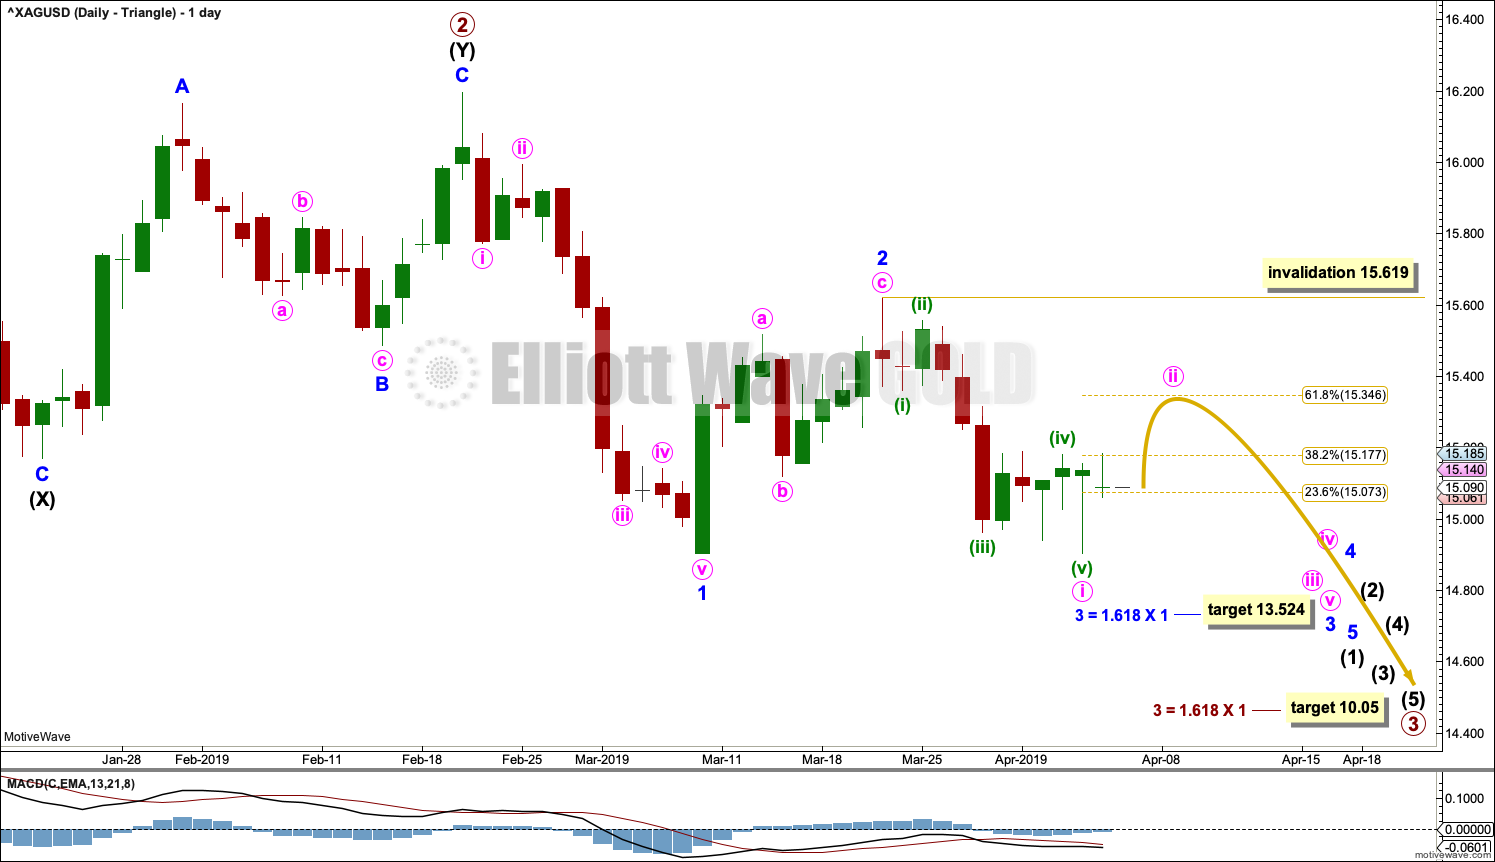
A target is calculated for primary wave 3 to reach the most common Fibonacci ratio to primary wave 1.
Primary wave 3 may only subdivide as an impulse. Within primary wave 3, intermediate wave (1) may be incomplete.
Intermediate wave (1) may be unfolding as an impulse. Within intermediate wave (1), minor waves 1 and 2 may be complete and minor wave 3 must subdivide as an impulse and must move below the end of minor wave 1.
Within minor wave 3, minute wave ii may not move beyond the start of minute wave i above 15.619.
A target is calculated for minor wave 3 that expects it to exhibit the most common Fibonacci ratio to minor wave 1.
ALTERNATE WAVE COUNT
WEEKLY CHART – BULL WAVE COUNT
Click chart to enlarge.
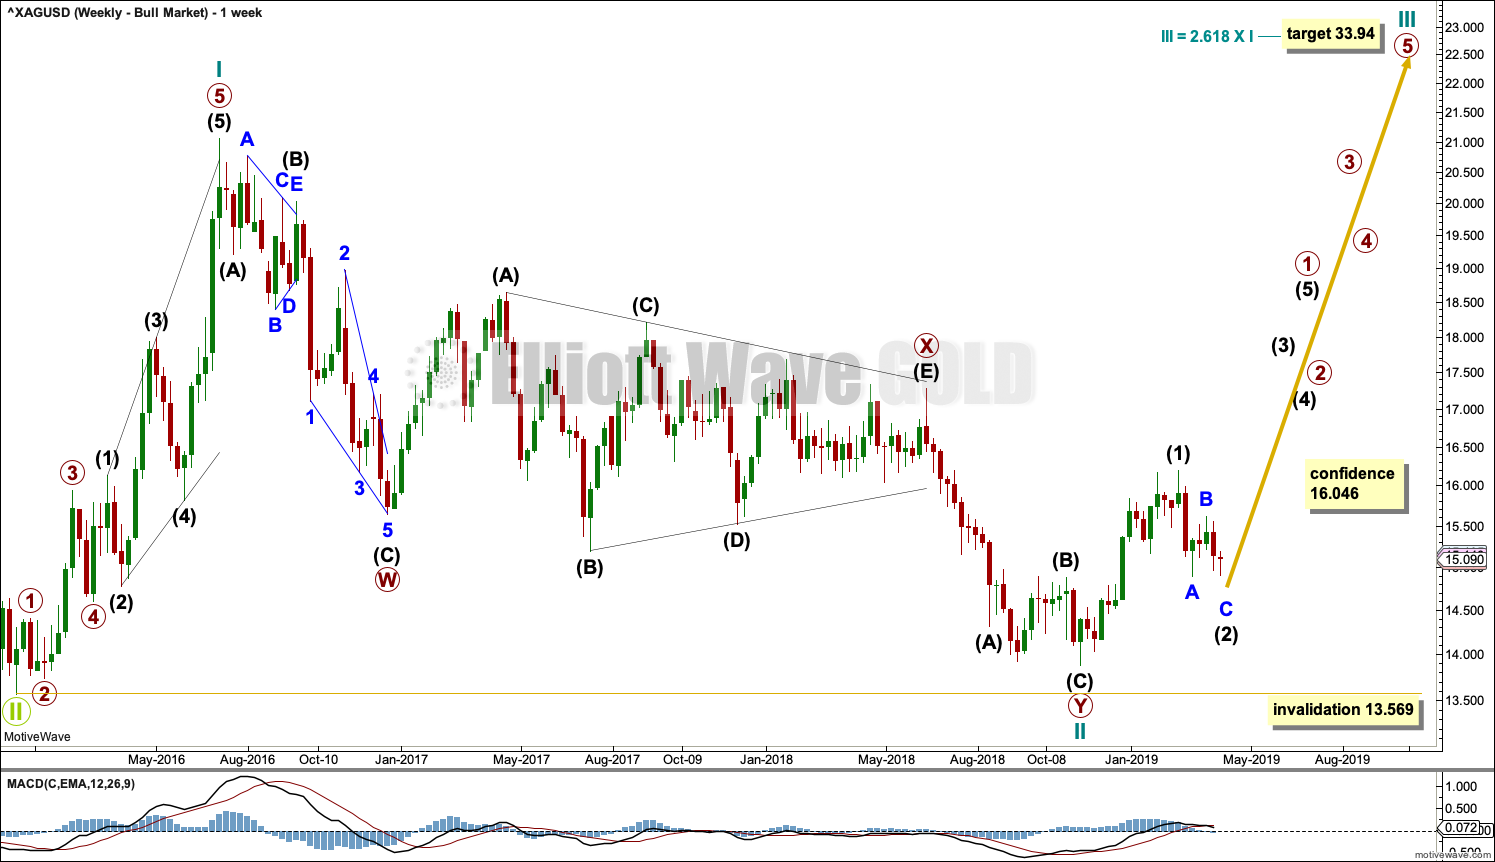
Cycle wave II may be a complete double zigzag. Cycle wave II would be very deep at 0.96 of cycle wave I. This is typical behaviour for the first second wave correction within a new trend for commodities.
If it continues any further, then cycle wave II may not move beyond the start of cycle wave I below 13.569.
DAILY CHART – BULL WAVE COUNT
Click chart to enlarge.
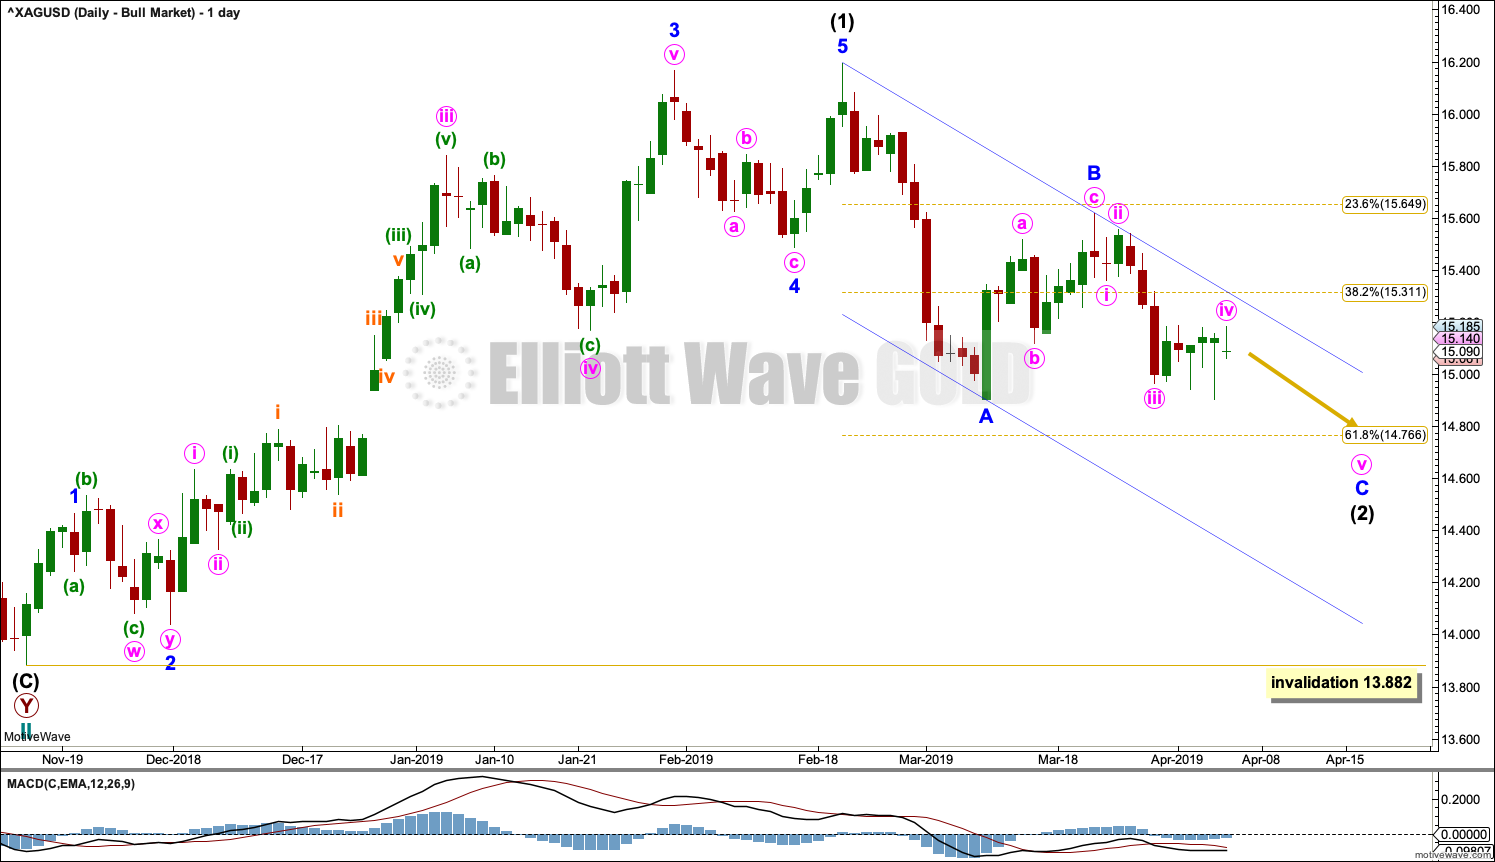
If cycle wave II is over, then the new trend up for cycle wave III should begin with a five wave structure. This is labelled intermediate wave (1). The structure may now be complete.
Intermediate wave (2) may be completing lower as a zigzag.
Intermediate wave (2) may not move beyond the start of intermediate wave (1) below 13.882.
TECHNICAL ANALYSIS
WEEKLY CHART
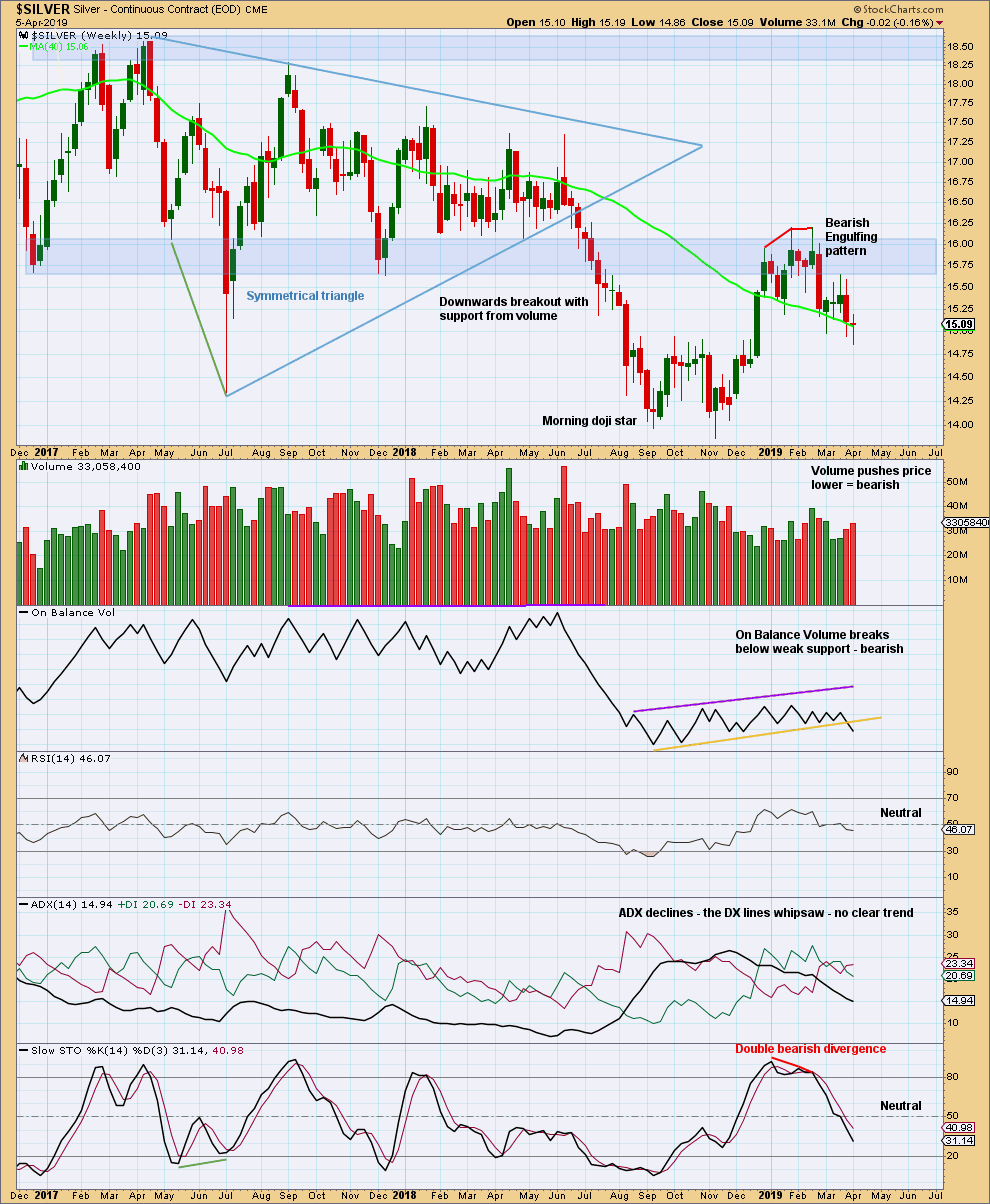
Click chart to enlarge. Chart courtesy of StockCharts.com.
The short-term volume profile and a bearish signal from On Balance Volume suggest more downwards movement next week.
DAILY CHART
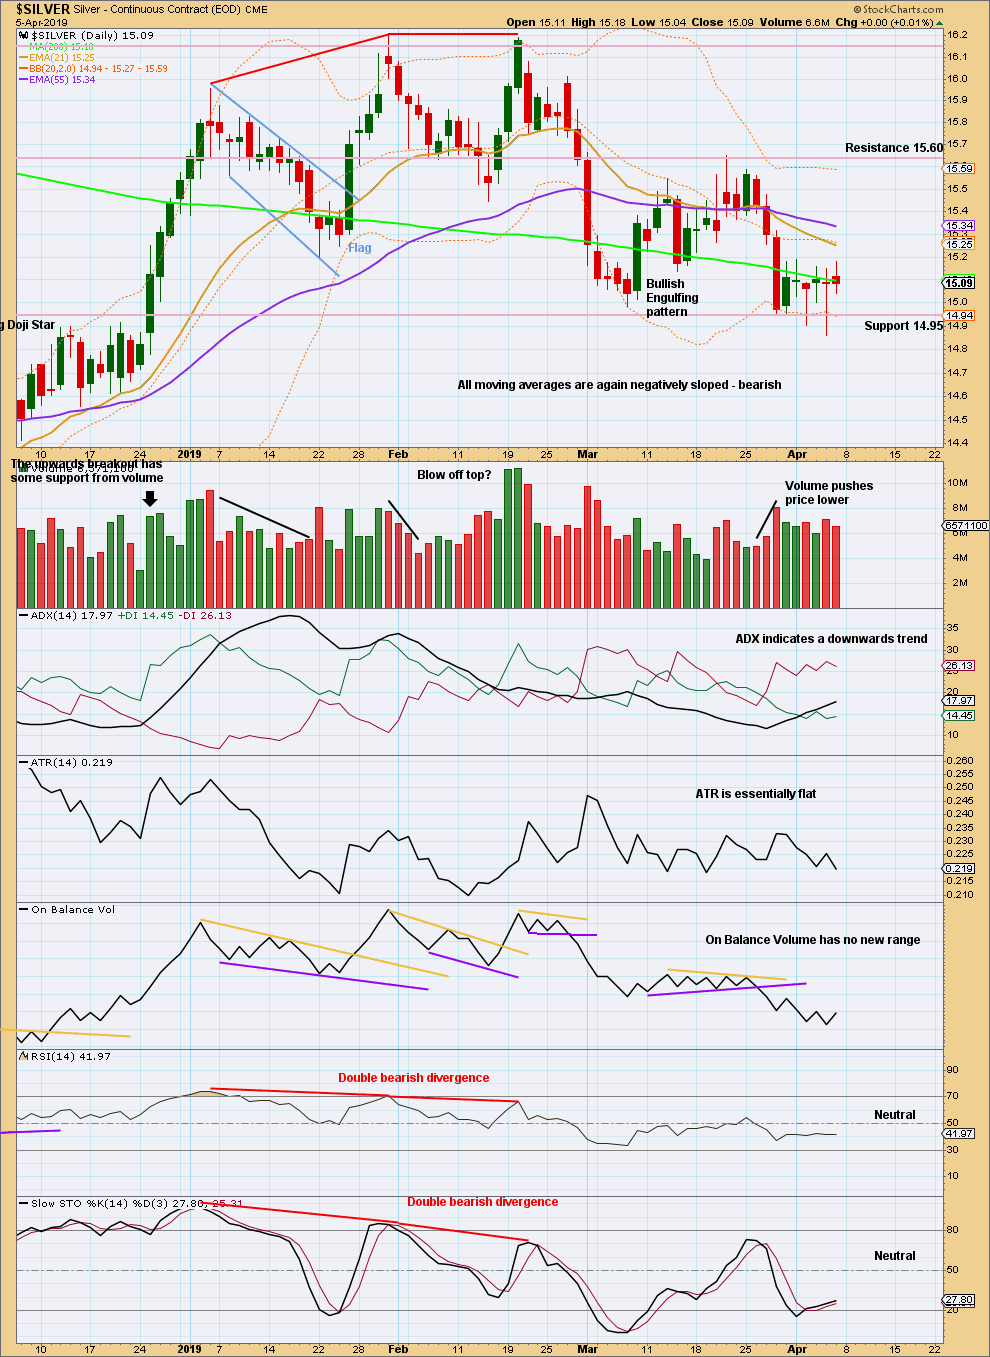
Click chart to enlarge. Chart courtesy of StockCharts.com.
Price remains range bound with support about 14.95 and resistance about 15.60. A close below 14.95 would be a downwards breakout that does not need support from volume for confidence; but if volume does support it, then more confidence may be had.
Published @ 08:09 p.m. EST on April 6, 2019.
—
Careful risk management protects your trading account(s).
Follow my two Golden Rules:
1. Always trade with stops.
2. Risk only 1-5% of equity on any one trade.