
Overall, more downwards movement was expected for the main Elliott wave count. This is mostly what has happened, although the week closed as an outside week.
Summary: The main Elliott wave count expects downwards movement from here, but the short-term volume profile is very bullish and there is a strong Bullish Engulfing candlestick pattern on the daily chart. There is risk here that a bounce may continue higher; next resistance is about 15.60 to 15.65.
The short-term target is at 13.524.
The long-term target remains at 10.05.
Monthly charts were reviewed here.
ELLIOTT WAVE COUNTS
MAIN WAVE COUNT
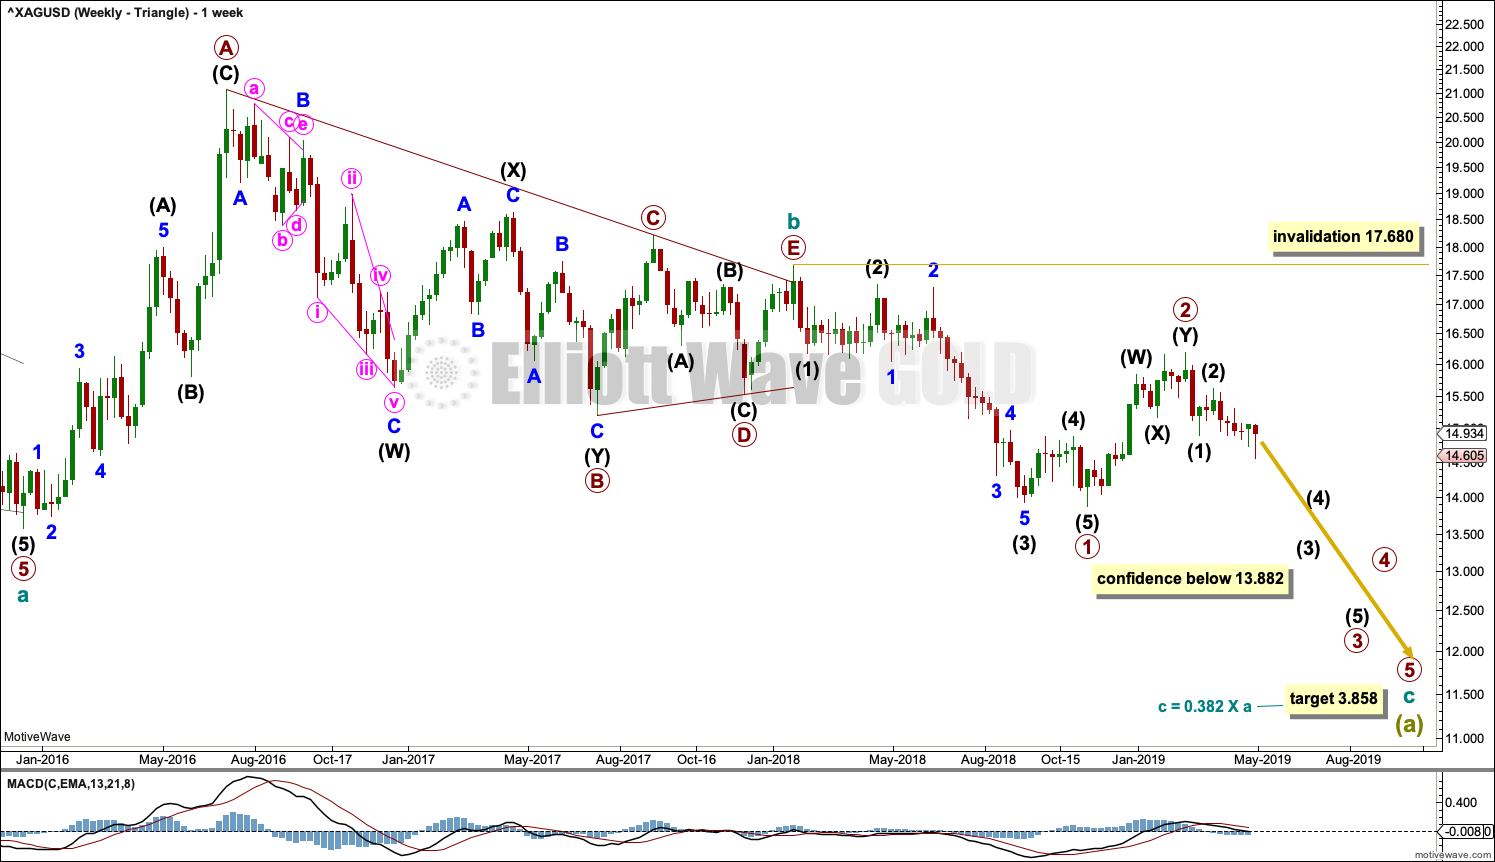
WEEKLY CHART – TRIANGLE
Click chart to enlarge.
This first wave count has good support from classic technical analysis, so it will be favoured. This wave count looks likely.
The first wave count expects that the bear market, which began from the April 2011 high, is incomplete.
Cycle wave a is seen as a five wave impulse for this main wave count.
This first weekly chart sees cycle wave b as a now possibly complete regular contracting triangle.
Primary wave E of the triangle may have ended with an overshoot of the A-C trend line.
Within cycle wave c, primary waves 1 and 2 may now both be complete.
If it continues higher, then primary wave 2 may not move beyond the start of primary wave 1 above 17.680.
Cycle wave c needs to move below the end of cycle wave a below 13.569 in order to avoid a truncation.
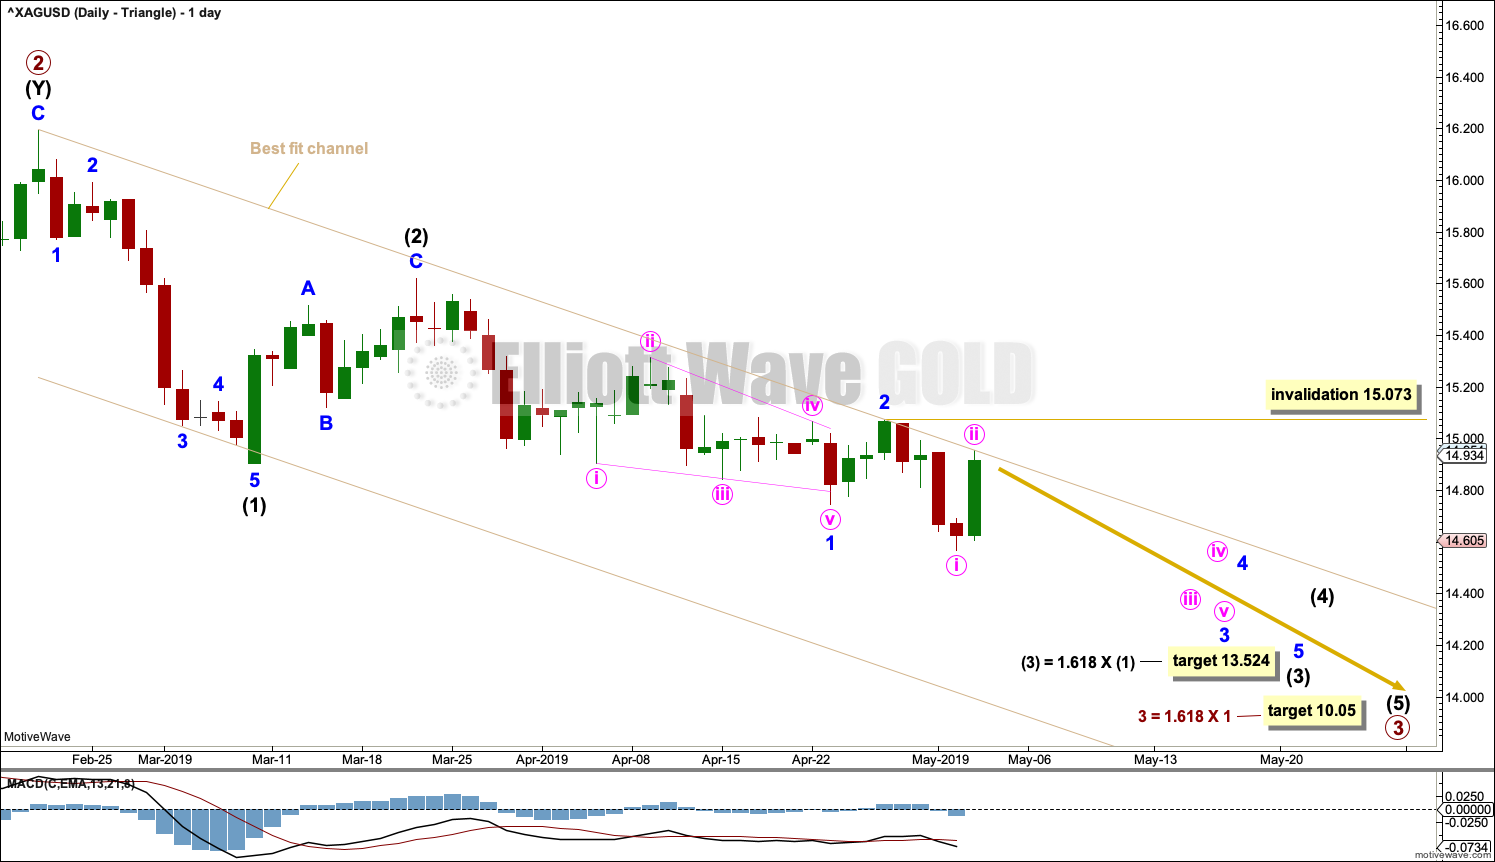
DAILY CHART – TRIANGLE
Click chart to enlarge.
A target is calculated for primary wave 3 to reach the most common Fibonacci ratio to primary wave 1.
Intermediate wave (3) must subdivide as an impulse. Within intermediate wave (3), minor wave 1 may have been complete at the last low as a leading contracting diagonal.
The channel is this week adjusted as a best fit. If the upper edge continues to provide resistance, then the bounce for Friday may be over.
Minute wave ii may not move beyond the start of minute wave i above 15.073.
ALTERNATE WAVE COUNT
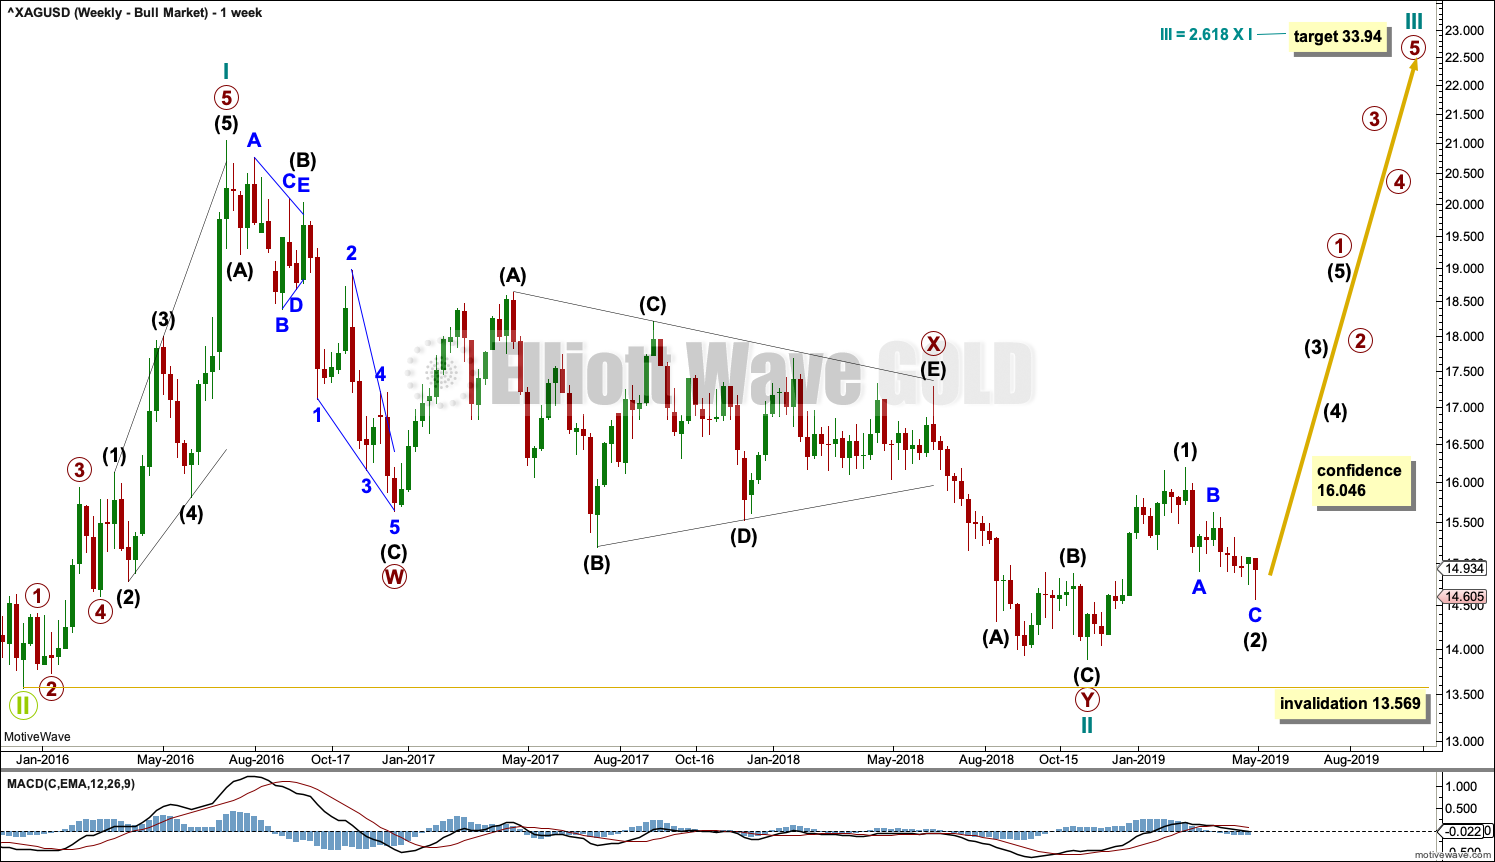
WEEKLY CHART – BULL WAVE COUNT
Click chart to enlarge.
This alternate wave count sees the bear market over for Silver and a new bull market beginning.
Cycle wave II may be a complete double zigzag. Cycle wave II would be very deep at 0.96 of cycle wave I. This is typical behaviour for the first second wave correction within a new trend for commodities.
If it continues any further, then cycle wave II may not move beyond the start of cycle wave I below 13.569.
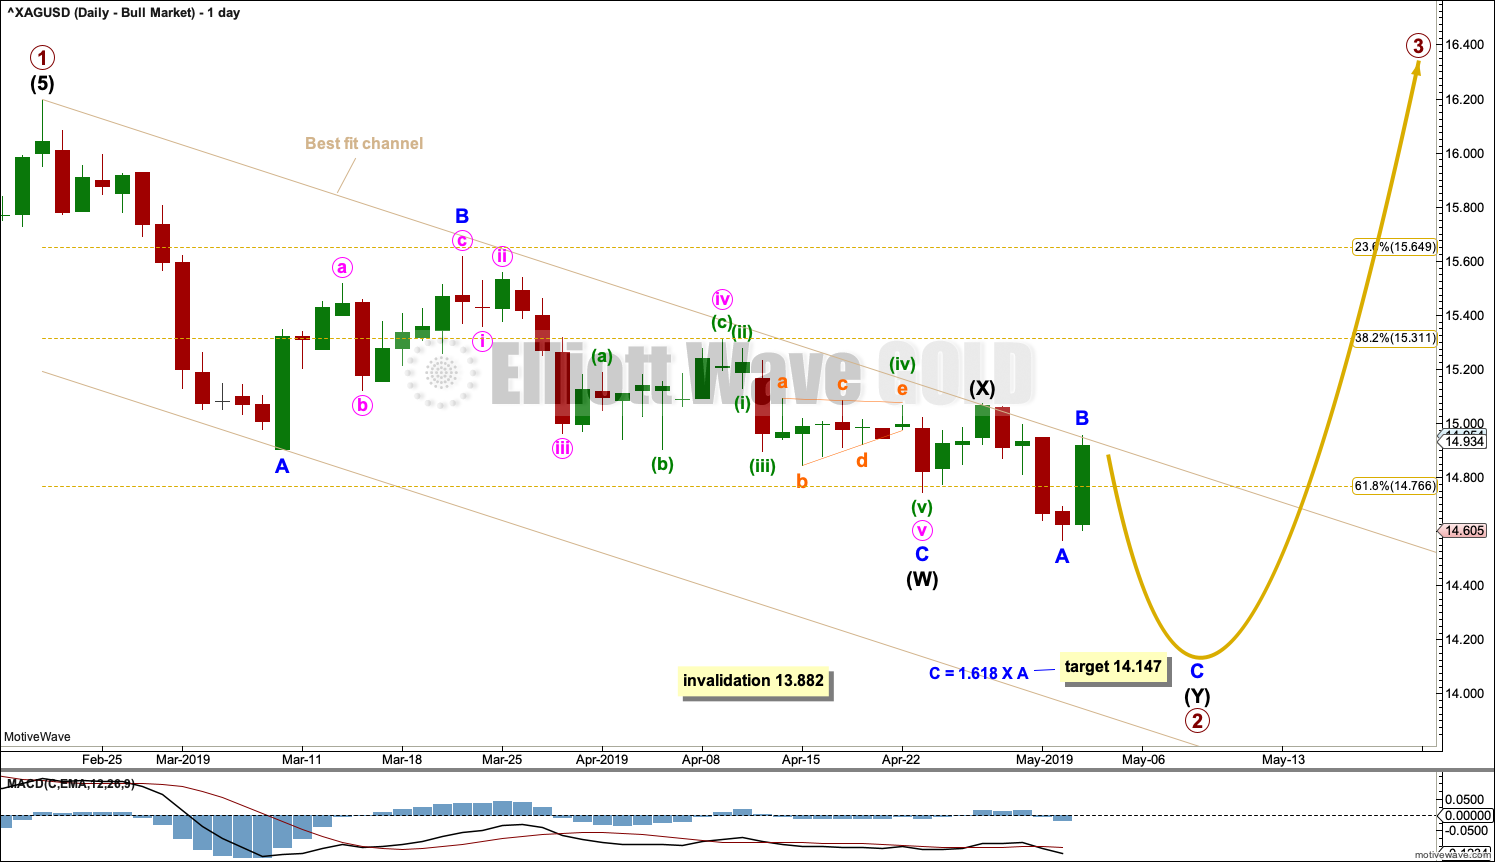
DAILY CHART – BULL WAVE COUNT
Click chart to enlarge.
If cycle wave II is over, then the new trend up for cycle wave III should begin with a five wave structure. This is labelled intermediate wave (1). The structure may now be complete.
Intermediate wave (2) may now be continuing lower as a double zigzag. A target is calculated for the second zigzag to end.
Intermediate wave (2) may not move beyond the start of intermediate wave (1) below 13.882.
The best fit channel is drawn in the same way on both daily charts.
TECHNICAL ANALYSIS
WEEKLY CHART
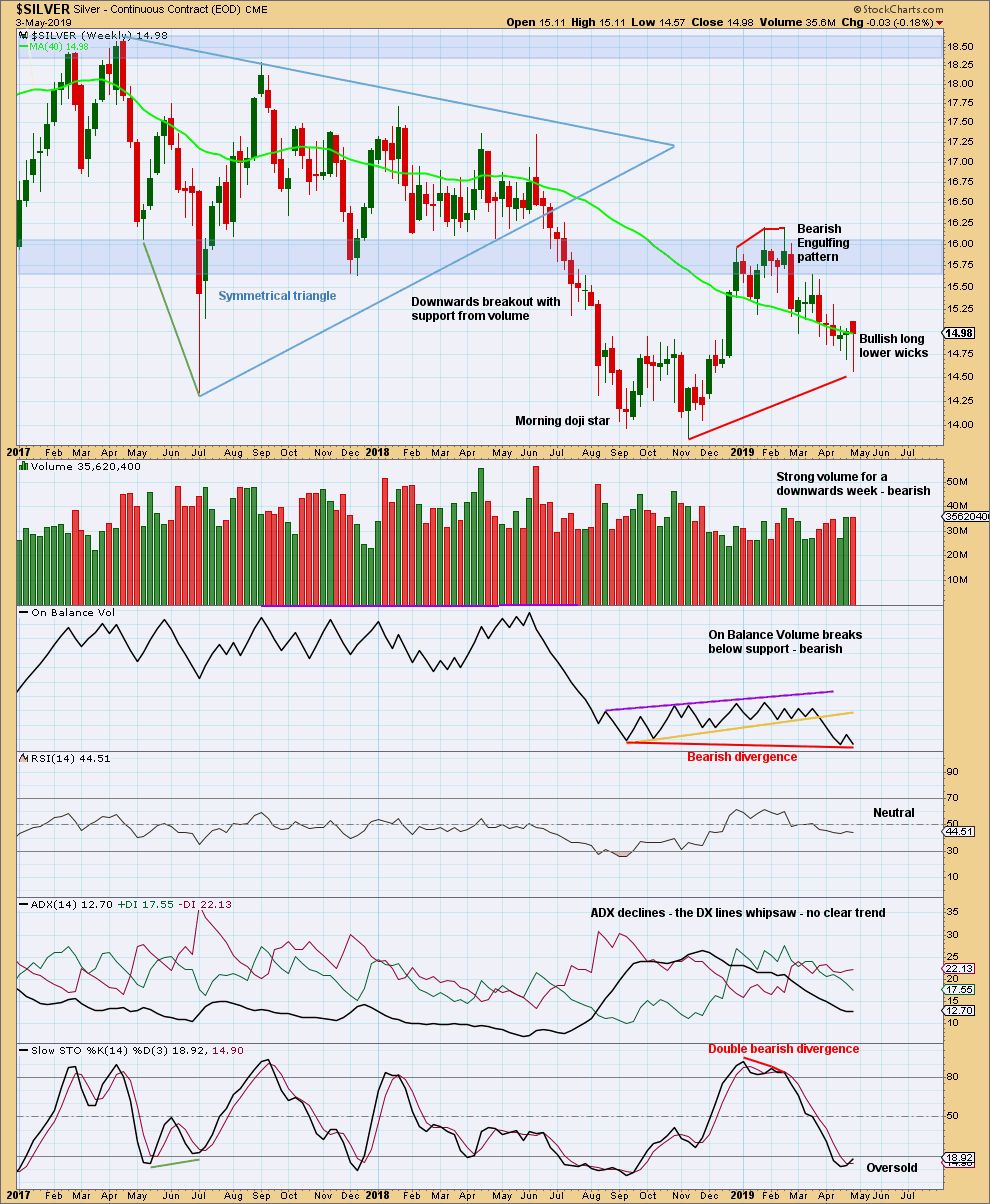
Click chart to enlarge. Chart courtesy of StockCharts.com.
Volume remains relatively heavy. Volume this week is only slightly lighter than the prior week.
The bullish long lower wicks do not support the main Elliott wave count. They suggest a bounce may unfold here, which may find final resistance about the lower edge of the next blue shaded zone, about 15.65.
DAILY CHART
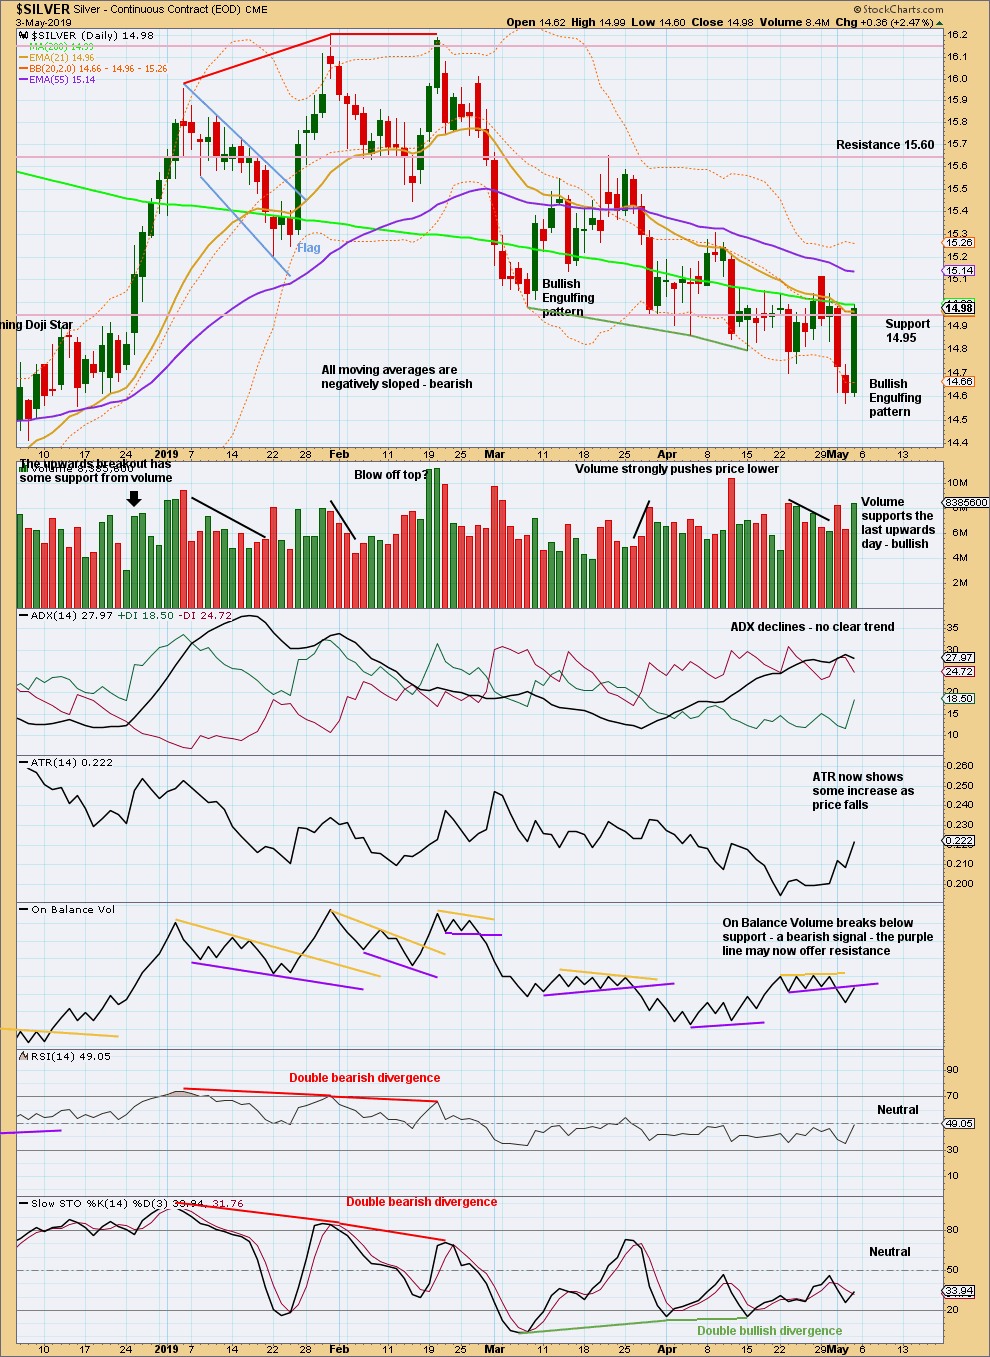
Click chart to enlarge. Chart courtesy of StockCharts.com.
There is now a series of multiple lower lows and lower highs from the high on the 31st of January. ADX no longer agrees there is a downwards trend in place.
The Bullish Engulfing candlestick pattern is a strong one and it has good support from volume. The bounce may continue higher here; next resistance is about 15.60.
Published @ 09:52 p.m. EST on May 5, 2019.
—
Careful risk management protects your trading account(s).
Follow my two Golden Rules:
1. Always trade with stops.
2. Risk only 1-5% of equity on any one trade.
—
New updates to this analysis are in bold.