
An inside week closes red. Downwards movement was expected for this week, which is mostly what has happened.
Summary: The short-term target is at 13.524. Look for bounces to continue to find resistance at the upper edge of the best fit channel on daily charts.
The long-term target remains at 10.05.
The short-term volume profile remains bullish. This does not support the Elliott wave count and remains a cause for concern. Manage risk carefully.
Monthly charts were reviewed here.
ELLIOTT WAVE COUNTS
MAIN WAVE COUNT
WEEKLY CHART – TRIANGLE
Click chart to enlarge.
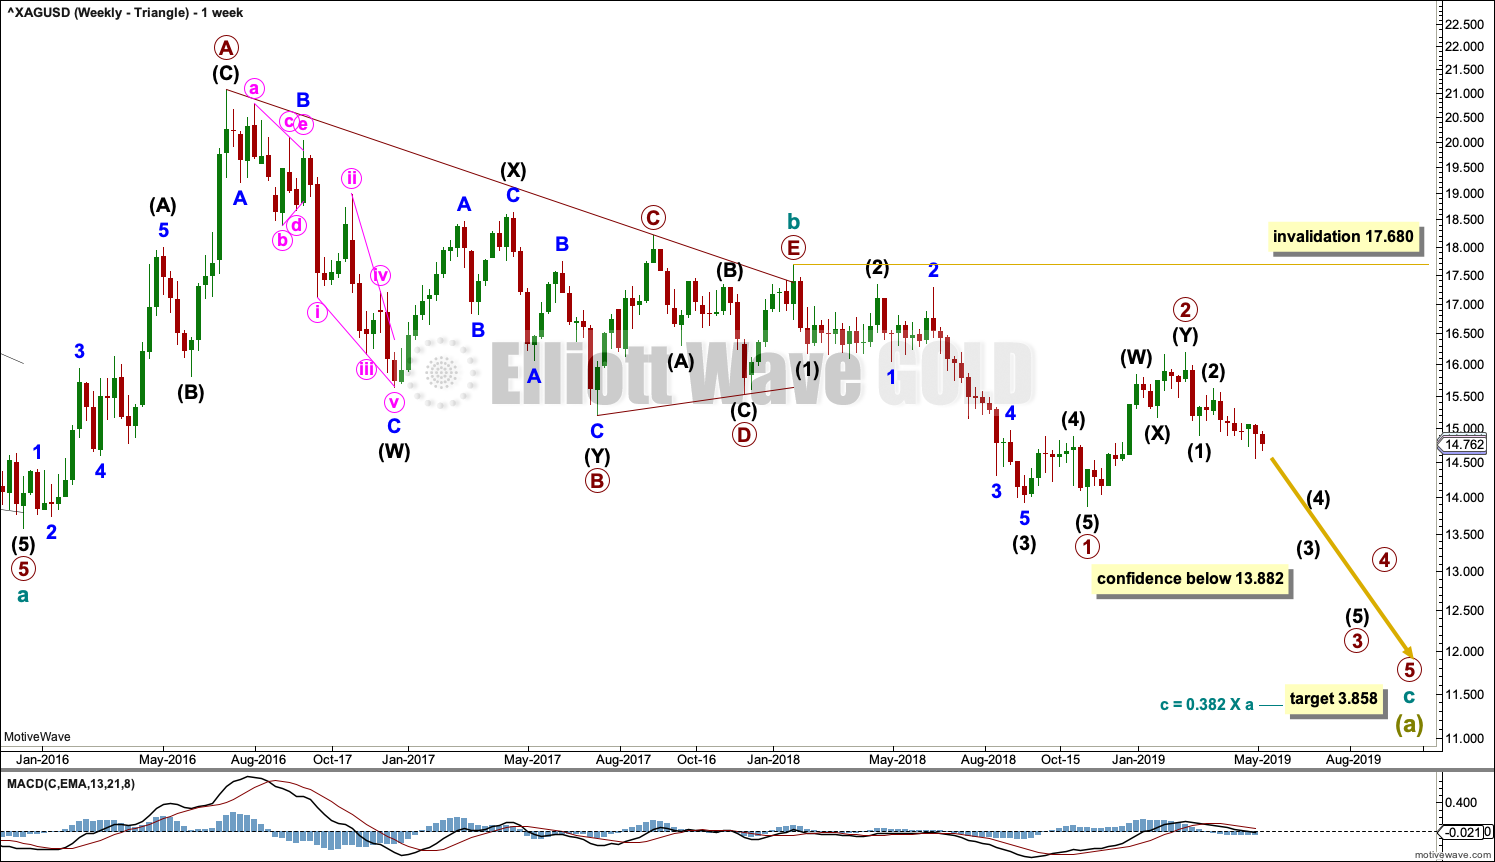
The basic Elliott wave structure is five steps forward followed by three steps back. At this time, it is expected that Silver is within a very large three steps back pattern that began at the all time high in April 2011.
Three steps back are almost always labelled in Elliott wave as A-B-C. This Elliott wave count expects that wave A is incomplete, and this is labelled Super Cycle wave (a).
The Elliott wave structure for Super Cycle wave (a) may be a zigzag. Zigzags subdivide 5-3-5. Within this zigzag, cycle waves a and b may be complete. Cycle wave c must subdivide as a five wave Elliott wave structure, most likely an impulse.
Within the impulse of cycle wave c, if primary wave 2 continues higher, it may not move beyond the start of primary wave 1 above 17.680.
Within the zigzag of Super Cycle wave (a), it would be extremely likely for cycle wave c to move below the end of cycle wave a at 13.569 to avoid a truncation. The target would see this achieved.
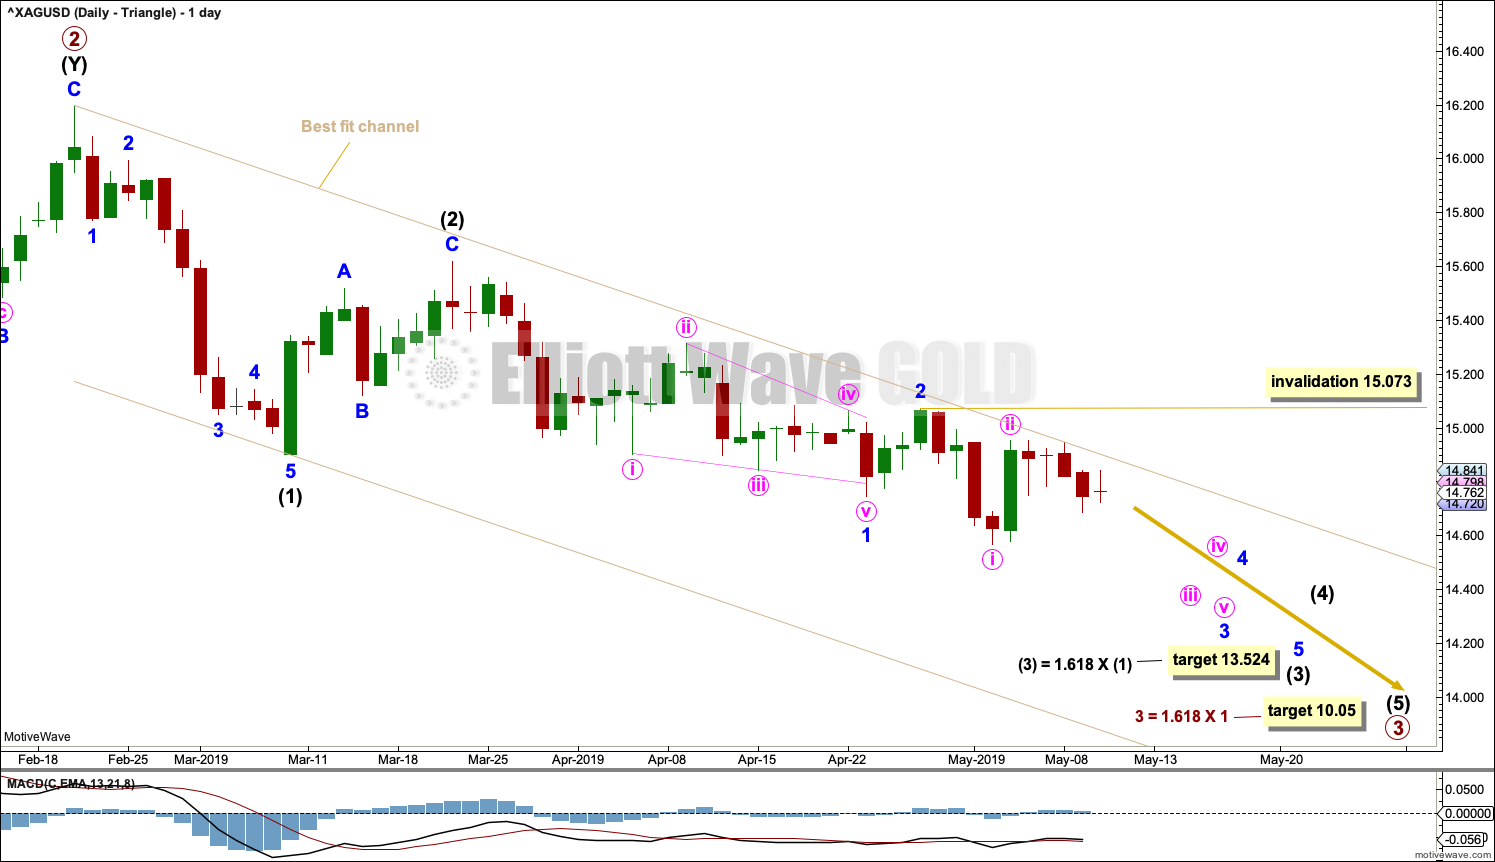
The daily chart below focusses on price movement from the end of primary wave 2.
DAILY CHART – TRIANGLE
Click chart to enlarge.
Primary wave 3 may only subdivide as a five wave impulse. Within this impulse, intermediate waves (1) and (2) may be complete.
Intermediate wave (3) may only subdivide as a five wave impulse. Within this impulse, minor waves 1 and 2 may be complete.
Minor wave 3 may only subdivide as a five wave impulse. Within this impulse, if minute wave ii continues any higher, it may not move beyond the start of minute wave i above 15.073.
The best fit channel is slightly adjusted this week to show where recent daily candlesticks have found resistance. The upper edge may continue to provide resistance for bounces along the way down.
Targets are calculated for both of intermediate wave (3) and primary wave 3. The targets expect these third waves to exhibit the most common Fibonacci ratio to their counterpart first waves.
ALTERNATE WAVE COUNT
WEEKLY CHART – BULL WAVE COUNT
Click chart to enlarge.
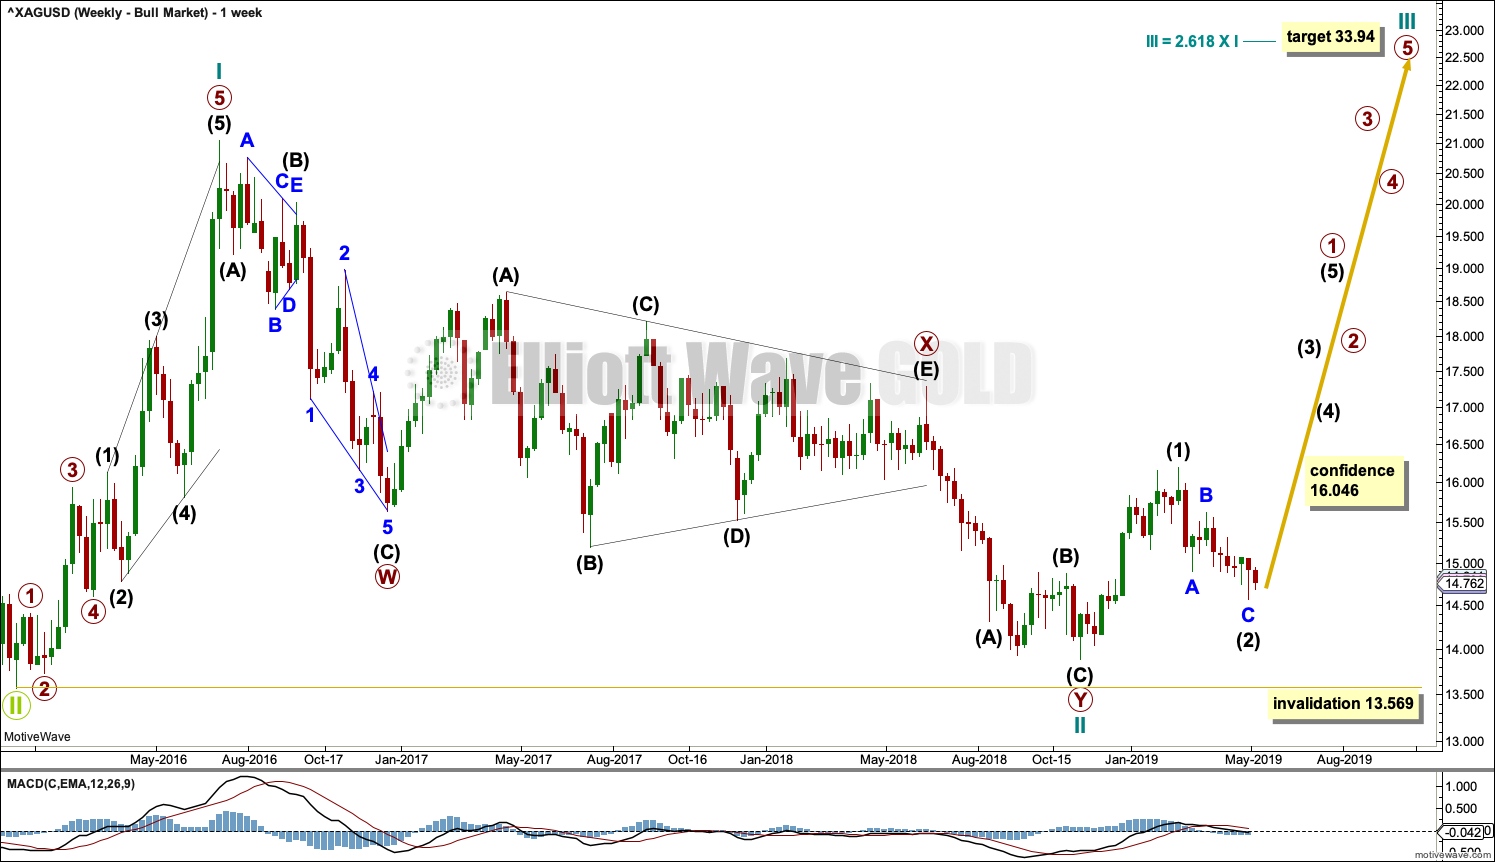
This alternate Elliott wave count sees the three steps back pattern as complete and a new bull market beginning for Silver at the low in December 2015.
A new bull market should begin with a five wave structure upwards. This is labelled cycle wave I.
Following five steps forward should be three steps back. This is labelled cycle wave II. The Elliott wave corrective structure of cycle wave II is labelled as a double zigzag, which is a fairly common structure.
If it continues any further, then cycle wave II may not move beyond the start of cycle wave I below 13.569.
DAILY CHART – BULL WAVE COUNT
Click chart to enlarge.
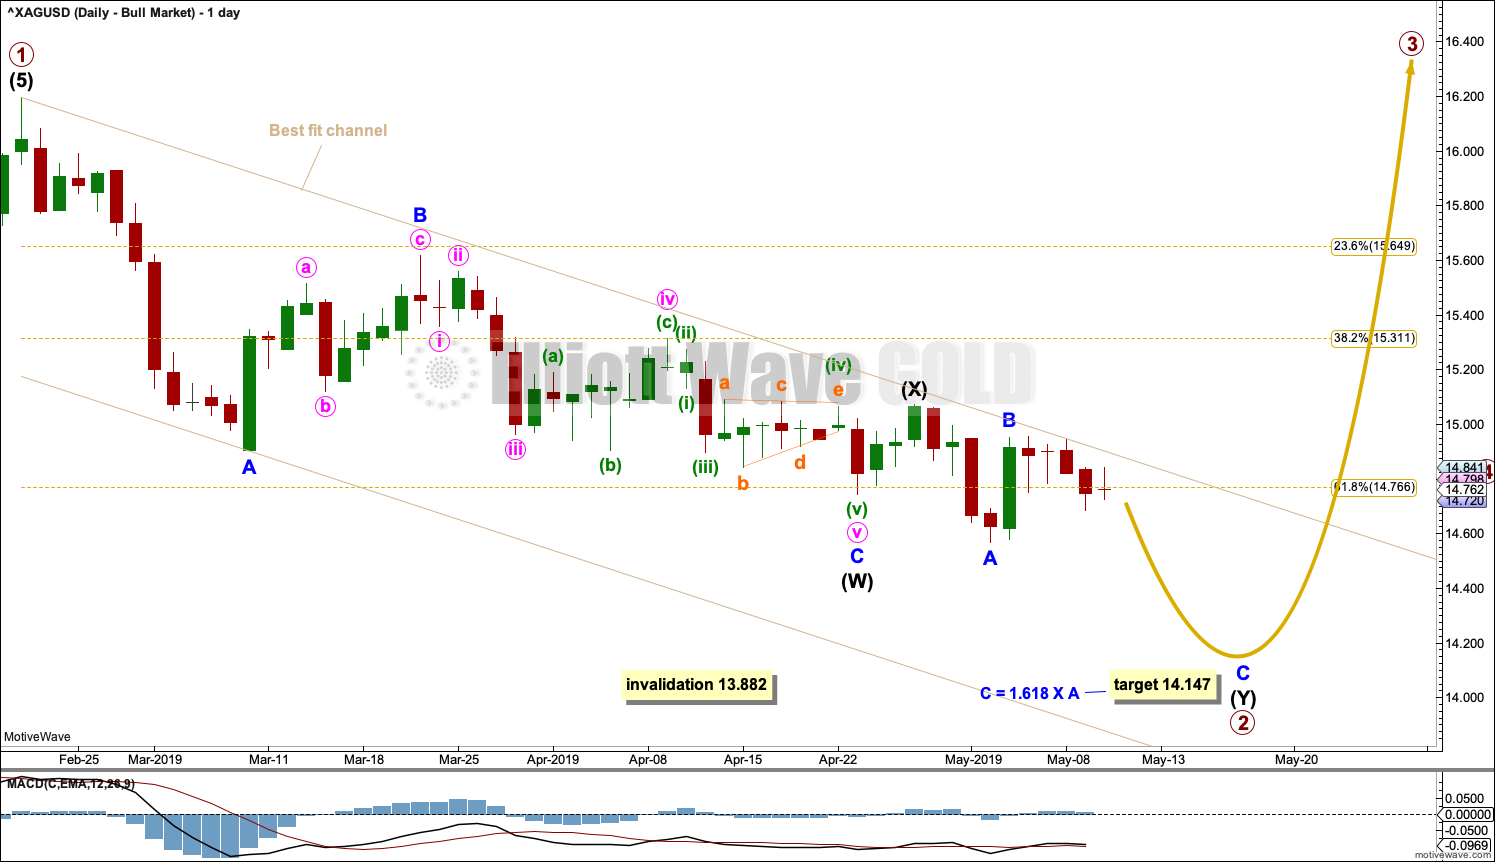
If cycle wave II is over, then the new trend up for cycle wave III should begin with a five wave structure. This is labelled primary wave 1. The structure may now be complete.
Five steps up should be followed by three steps back, labelled primary wave 2. Primary wave 2 may now be continuing lower as a double zigzag. A target is calculated for the second zigzag to end.
Primary wave 2 may not move beyond the start of primary wave 1 below 13.882.
The best fit channel is drawn in the same way on both daily charts.
TECHNICAL ANALYSIS
WEEKLY CHART
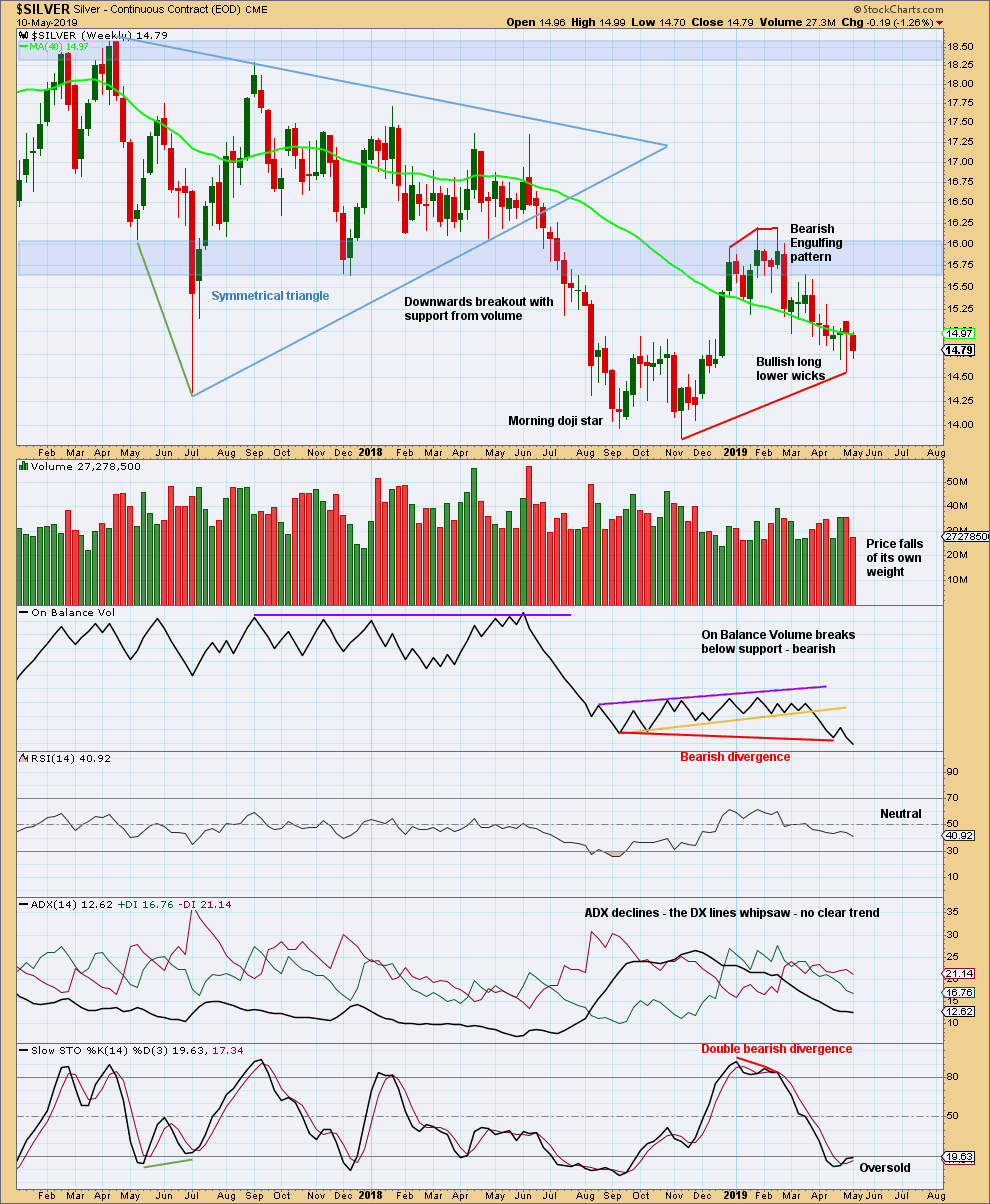
Click chart to enlarge. Chart courtesy of StockCharts.com.
An inside week closes red with the balance of volume downwards. Price fell of its own weight this week.
DAILY CHART
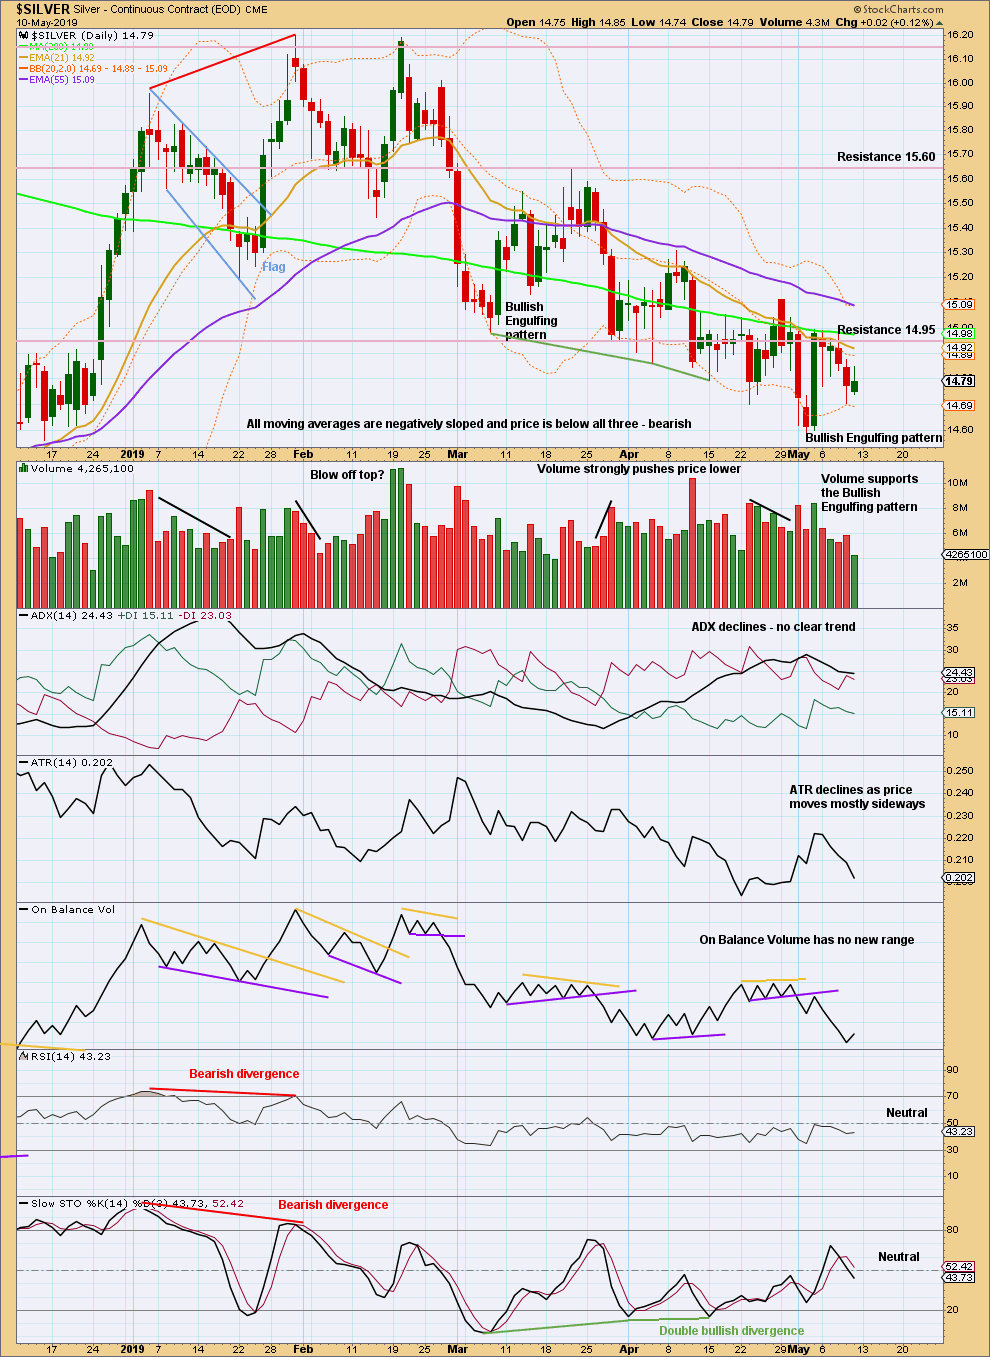
Click chart to enlarge. Chart courtesy of StockCharts.com.
There is now a series of multiple lower lows and lower highs from the high on the 31st of January. However, the short-term volume profile remains bullish, and the Bullish Engulfing candlestick remains a strong warning that a bounce here may continue.
Published @ 10:58 p.m. EST on May 12, 2019.
—
Careful risk management protects your trading account(s).
Follow my two Golden Rules:
1. Always trade with stops.
2. Risk only 1-5% of equity on any one trade.
—
New updates to this analysis are in bold.