
A relatively shallow bounce was expected to continue this week. A slightly higher high and a slightly higher low overall fits this expectation.
Summary: A sideways consolidation for a fourth wave may continue next week. It may find resistance about the upper edge of the Elliott channel. The bounce should not move above 60.04.
If price does come up to touch the upper edge of the channel, that may be used as an entry opportunity to join the downwards trend.
When this bounce or consolidation is complete, then a target may be calculated for the fifth wave down to end. That cannot be done yet.
The final target is now calculated at 10.72.
MAIN ELLIOTT WAVE COUNT
MONTHLY CHART
Click chart to enlarge.
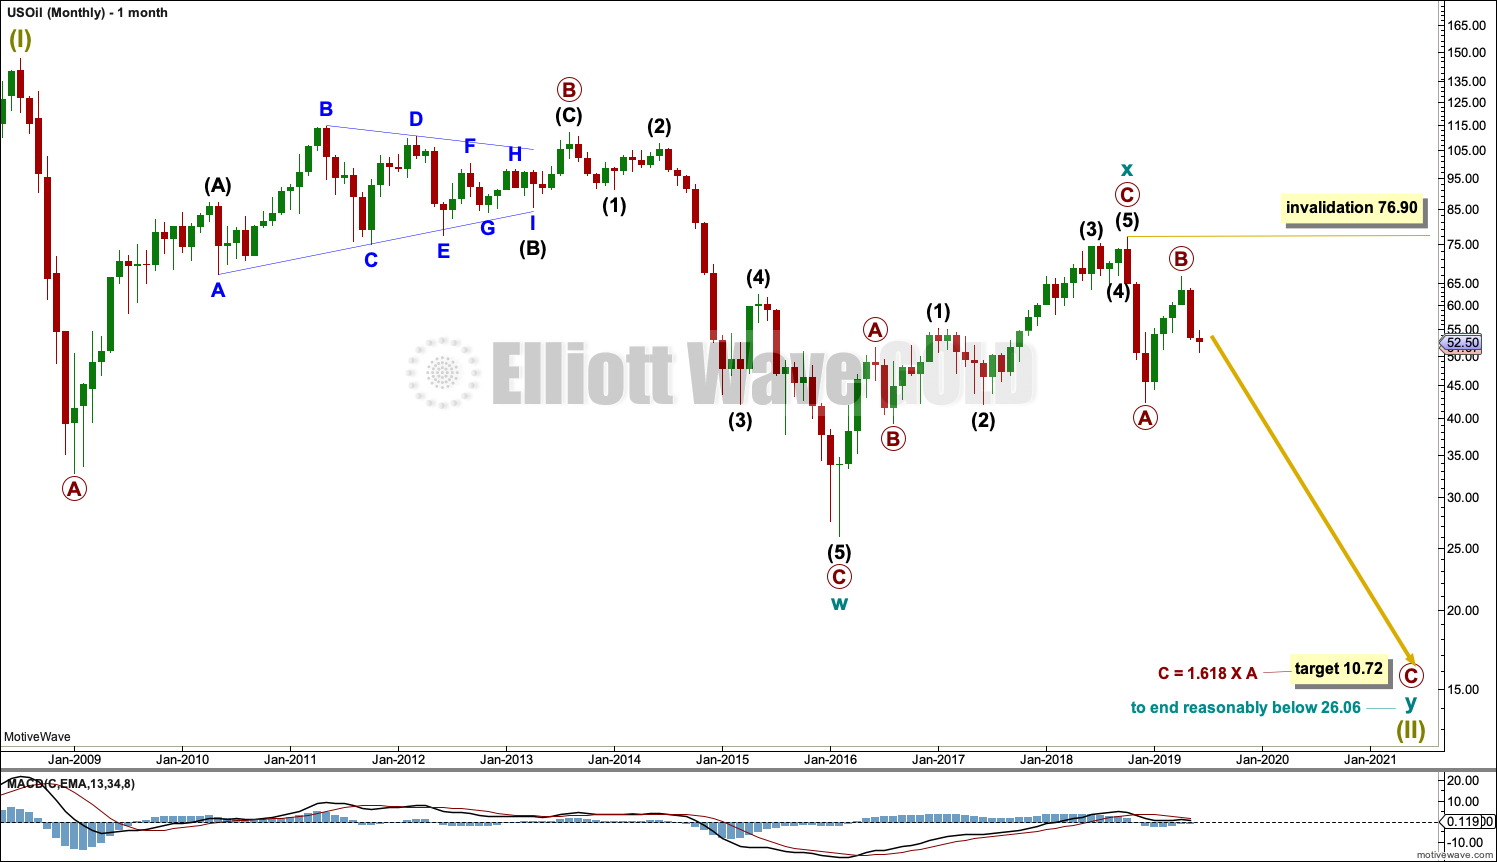
The basic Elliott wave structure is five steps forward and three steps back. This Elliott wave count expects that US Oil is still within a three steps back pattern, which began in July 2008. The Elliott wave count expects that the bear market for US Oil continues.
This Elliott wave corrective structure is a double zigzag, which is a fairly common structure. The correction is labelled Super Cycle wave (II).
The first zigzag in the double is complete and labelled cycle wave y. The double is joined by a three in the opposite direction labelled cycle wave x, which subdivides as a zigzag. The second zigzag in the double may now have begun, labelled cycle wave w.
The purpose of a second zigzag in a double zigzag is to deepen the correction when the first zigzag does not move price deep enough. To achieve this purpose cycle wave y may be expected to move reasonably below the end of cycle wave w at 26.06. The target calculated would see this expectation met.
Cycle wave y is expected to subdivide as a zigzag, which subdivides 5-3-5.
Cycle wave w lasted 7.6 years and cycle wave x lasted 2.7 years. Cycle wave y may be expected to last possibly about a Fibonacci 5 or 8 years.
If it continues higher, then primary wave B may not move beyond the start of primary wave A above 76.90.
WEEKLY CHART
Click chart to enlarge.
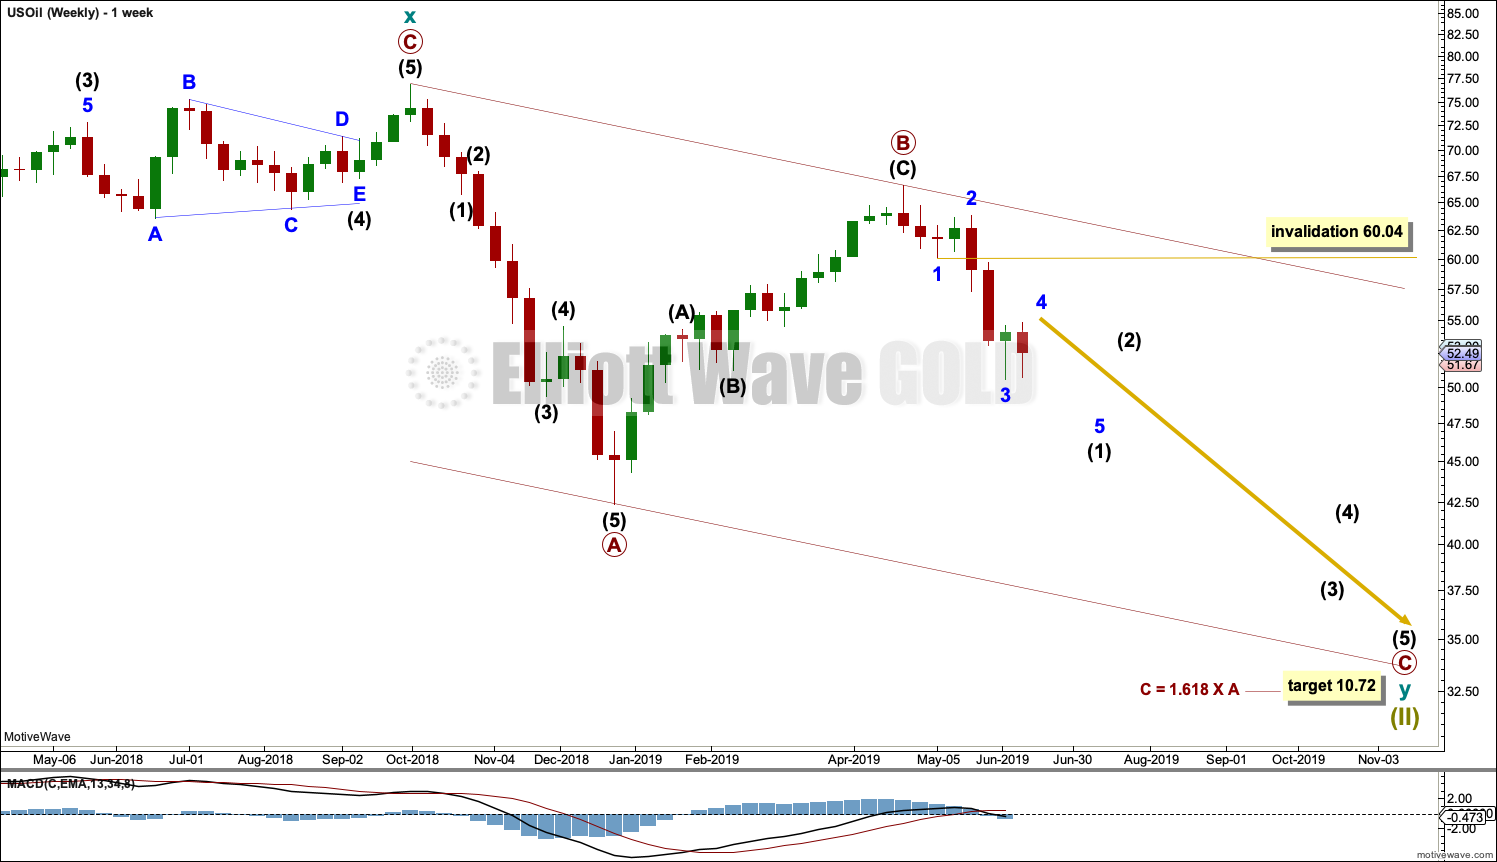
This weekly chart is focussed on the start of cycle wave y.
Cycle wave y is expected to subdivide as a zigzag. A zigzag subdivides 5-3-5. Primary wave A must subdivide as a five wave structure if this wave count is correct.
Primary wave A may be a complete five wave impulse at the last low.
Primary wave B may now be a complete single zigzag at the last high.
Primary wave C may have just begun. Primary wave C must subdivide as a five wave structure.
Primary wave A lasted 12 weeks, just one short of a Fibonacci 13.
Primary wave C may be longer in time as well as price. If cycle wave y lasts a Fibonacci 5 years, then primary wave C within it may take as long as a Fibonacci 233 weeks.
Intermediate wave (1) within primary wave C may be subdividing as an impulse. Within the impulse, minor wave 4 may not move into minor wave 1 price territory above 60.04.
Draw a channel about the zigzag of primary wave y using Elliott’s technique for a correction. Draw the first trend line from the start of primary wave A to the end of primary wave B, then place a parallel copy on the end of primary wave A. The upper edge of this channel may show where bounces along the way down find resistance. The lower edge of the channel may provide support.
When intermediate wave (1) is complete, then a bounce for intermediate wave (2) may be a multi-week bounce that may find resistance at the upper edge of the Elliott channel.
DAILY CHART
Click chart to enlarge.
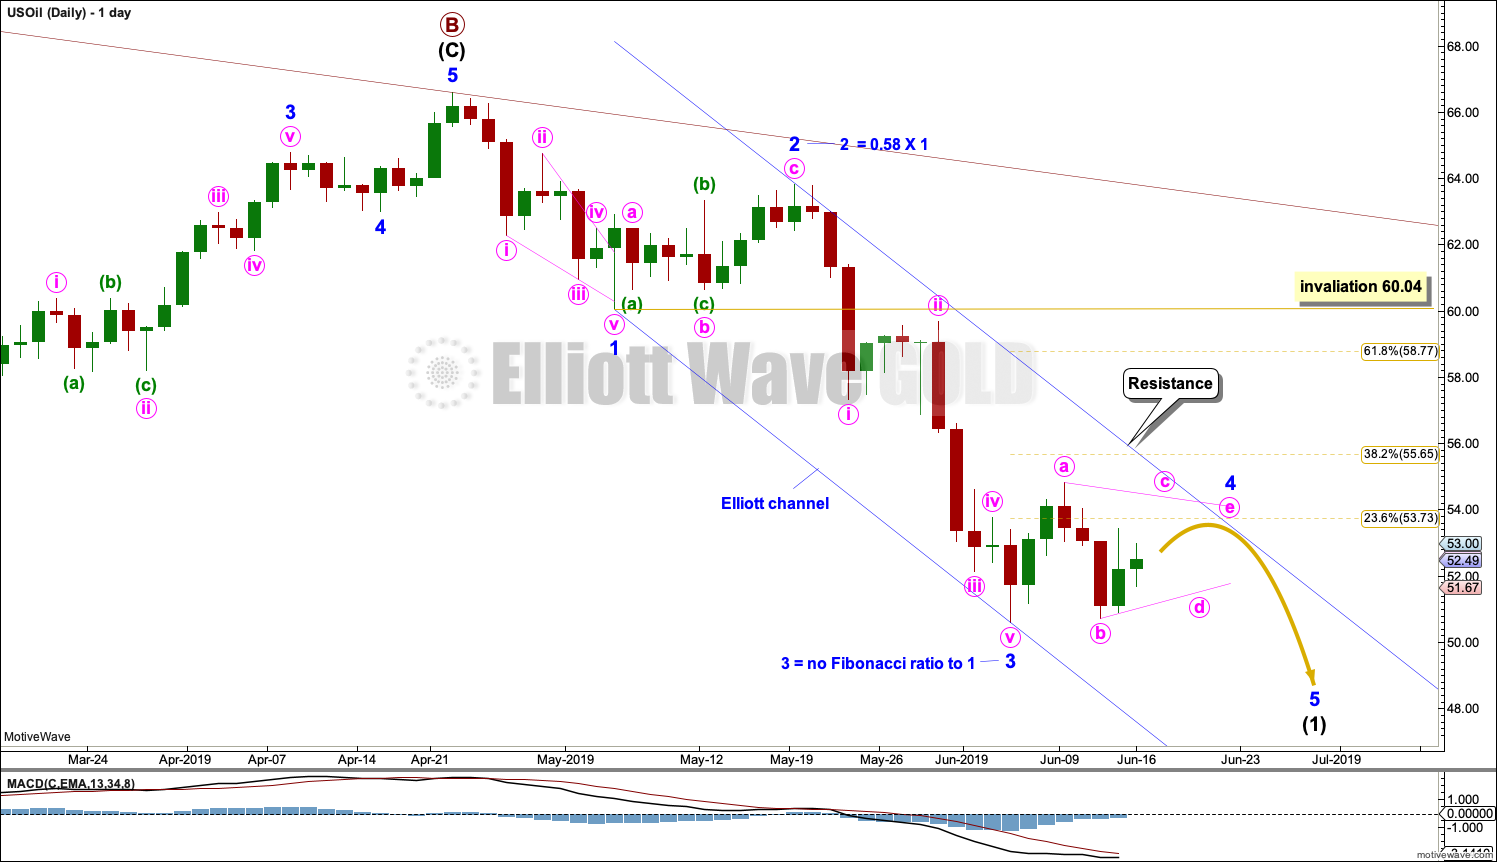
Note that monthly and weekly charts are on a semi-log scale, but this daily chart is on an arithmetic scale. This makes a slight difference to trend channels.
The daily chart focusses on the structure of intermediate wave (1) within primary wave C.
Intermediate wave (1) may be unfolding as an impulse. Within intermediate wave (1), minor waves 1 through to 3 may be complete. Minor wave 3 shows an increase in downwards momentum beyond that of minor wave 1. This wave count fits with MACD.
Minor wave 2 was a relatively deep zigzag lasting 10 sessions. Minor wave 4 may exhibit alternation as a shallow flat, combination or triangle. Minor wave 4 may last about two weeks, or it may be longer lasting as sideways corrections do tend to be longer lasting than zigzags.
This week minor wave 4 is labelled as a possible regular contracting triangle, which is the most common Elliott wave triangle. However, as minor wave 4 continues sideways this labelling may change; it may be relabelled as a flat or combination.
Minor wave 4 may find resistance about the upper edge of the blue Elliott channel. Draw this channel with the first trend line from the ends of minor waves 1 to 3, then place a parallel copy on the end of minor wave 2.
Minor wave 3 did not exhibit a Fibonacci ratio to minor wave 1. Minor wave 5 would be likely to exhibit a Fibonacci ratio to either of minor waves 1 or 3, with equality in length with minor wave 1 at $6.55 the most likely. When minor wave 4 is complete and the start of minor wave 5 is know, then the Fibonacci ratio may be applied to calculate a target for minor wave 5 to end. That cannot be done yet.
DAILY CHART ALTERNATE
Click chart to enlarge.
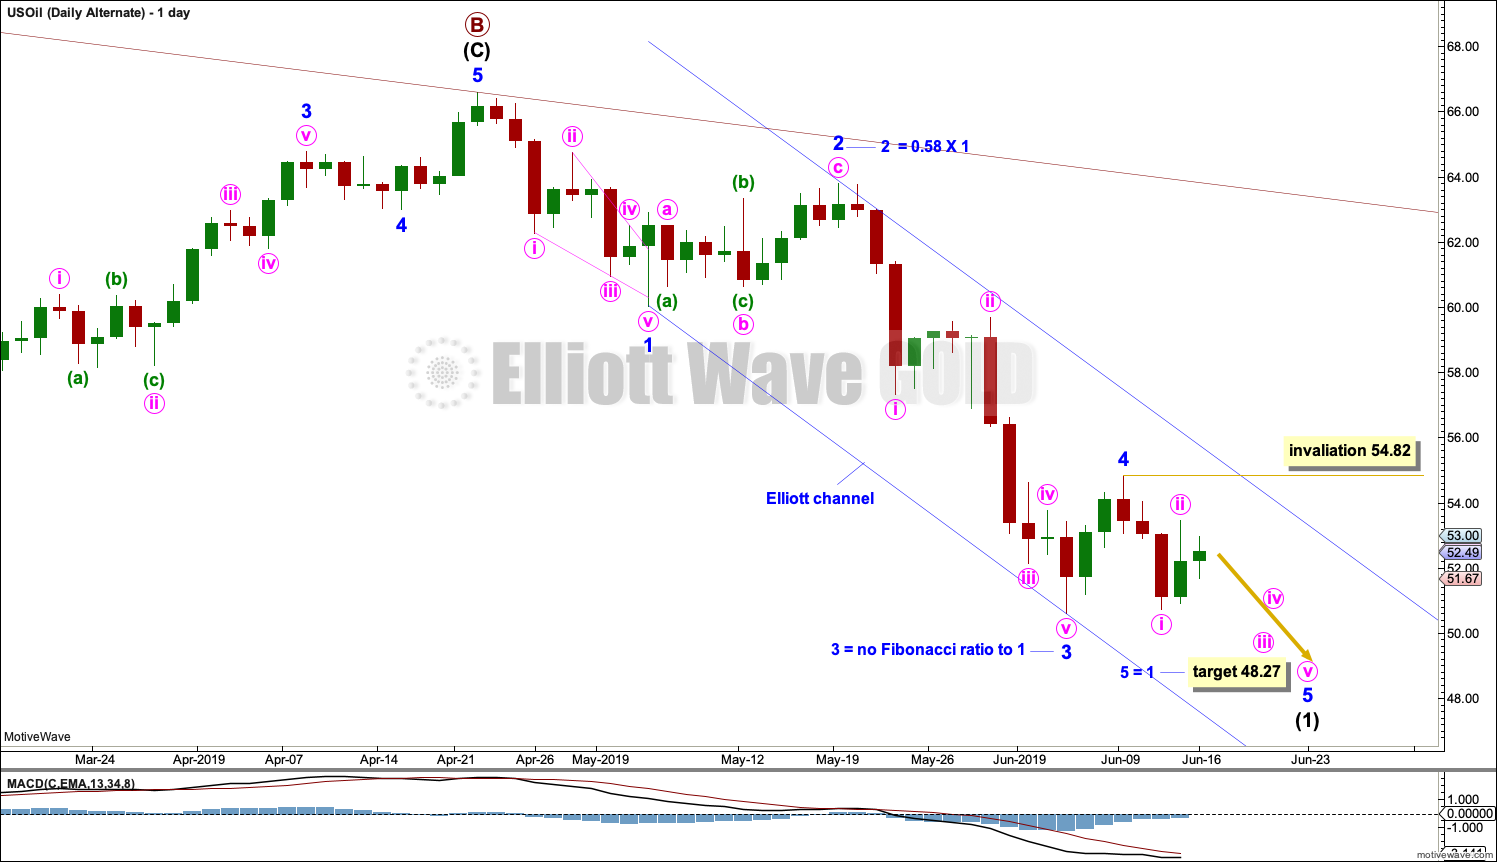
It is possible that minor wave 4 may be a relatively brief and shallow zigzag. The proportion between minor waves 2 and 4 for this wave count is not very good. This reduces the probability, so it is labelled as an alternate.
A target is calculated for minor wave 5 to end. Within minor wave 5, minute wave ii may not move beyond the start of minute wave i above 54.82.
For confidence this wave count requires a downwards breakout that should show some strength either with increased volume, ATR or very strong momentum.
TECHNICAL ANALYSIS
MONTHLY CHART
Click chart to enlarge. Chart courtesy of StockCharts.com.
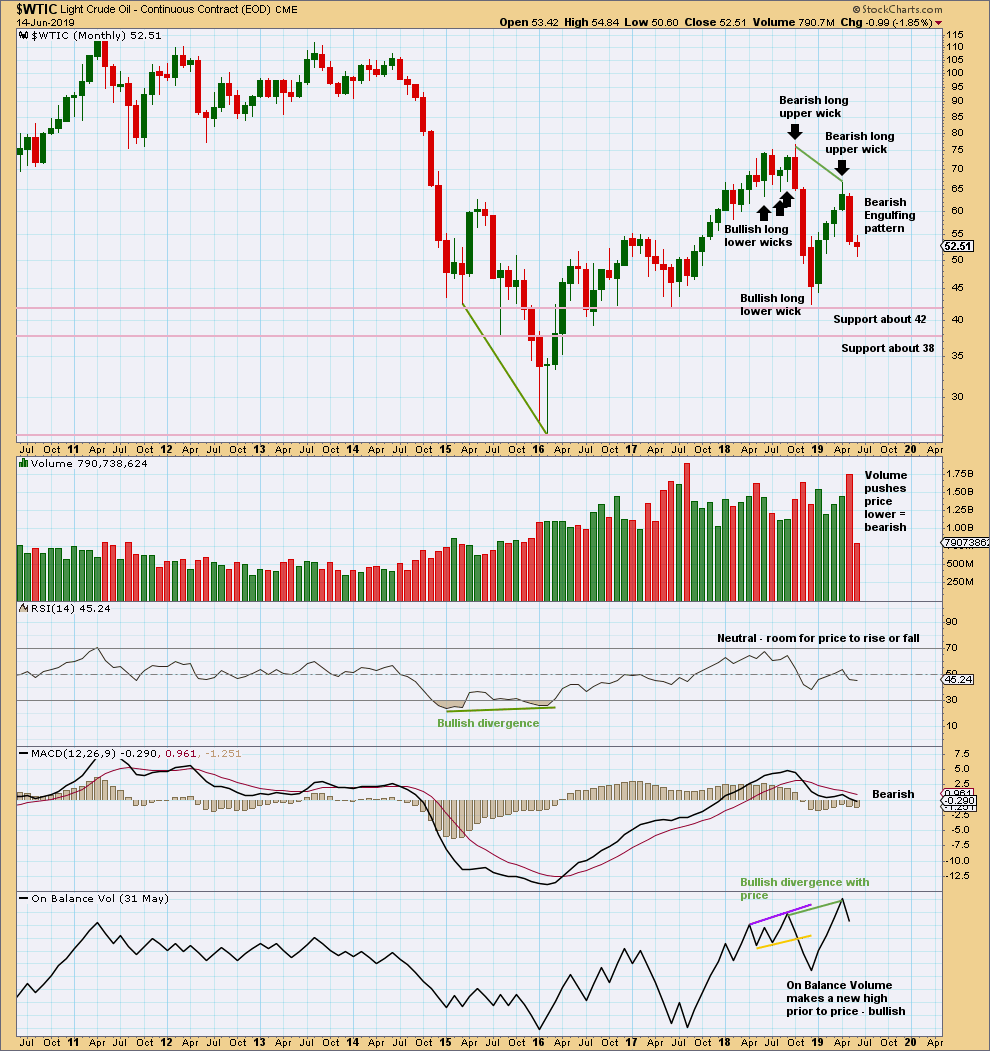
May has closed with a strong Bearish Engulfing candlestick pattern, which has strong support from volume. This supports the Elliott wave count.
WEEKLY CHART
Click chart to enlarge. Chart courtesy of StockCharts.com.
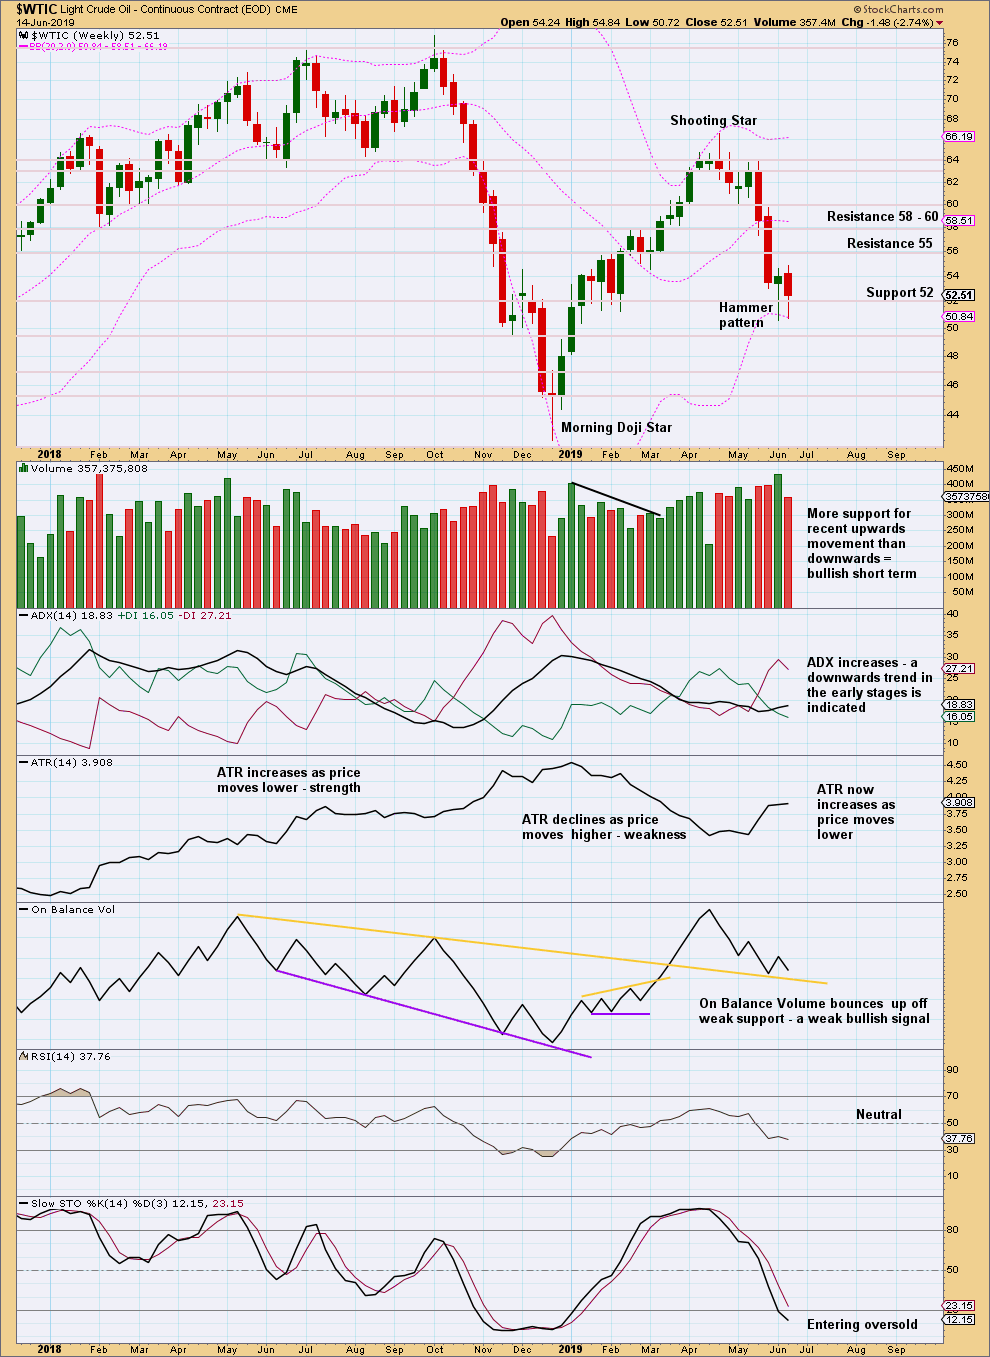
Two weekly candlesticks with long lower wicks looks bullish at least for the short term. The larger trend is down. Bounces and consolidations should be expected to be counter trend movements, until proven otherwise.
DAILY CHART
Click chart to enlarge. Chart courtesy of StockCharts.com.
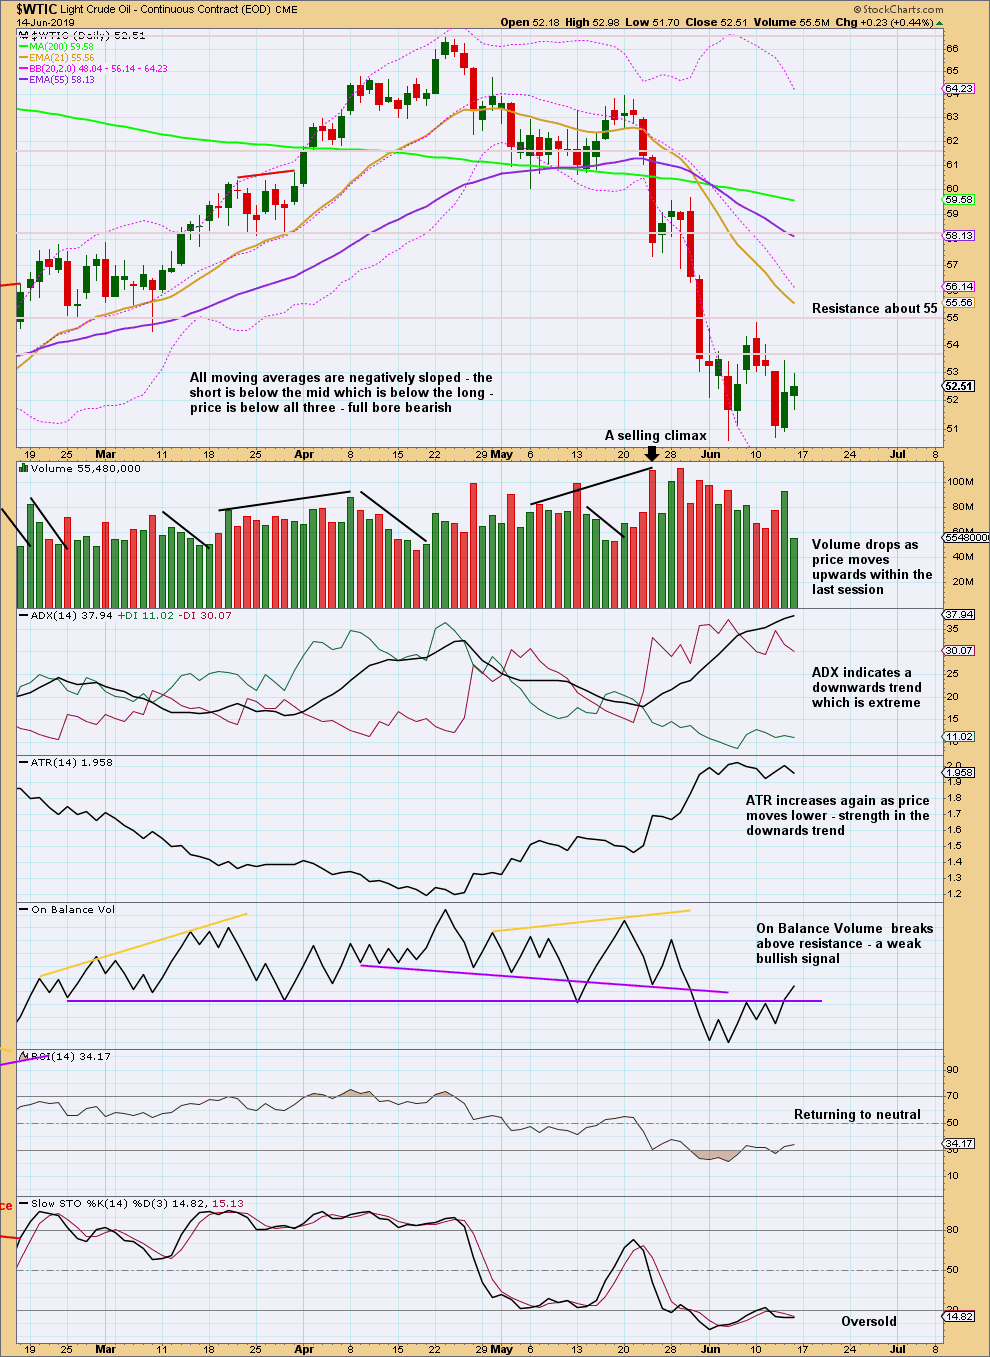
Strong volume for upwards movement on Thursday in conjunction with a bullish signal from On Balance Volume offers support to the main daily Elliott wave count.
Published @ 6:44 p.m. EST.
—
Careful risk management protects your trading account(s).
Follow my two Golden Rules:
1. Always trade with stops.
2. Risk only 1-5% of equity on any one trade.
—
New updates to this analysis are in bold.
Update for US Oil:
Looking at the structure of minute c within minor 4 on lower time frames, I can’t see it yet complete.
The Elliott channel needs to be redrawn. Fourth waves aren’t always contained within a channel drawn using the first technique, so Elliott developed a second technique to redraw the channel when the fourth wave breaches the first. Draw the channel from the ends of the second to fourth waves, then place a parallel copy on the end of the third wave. This channel will be drawn in its final position when we can be confident minor 4 is over.
I’ll expect a little more upwards movement to complete minor 4. The invalidation point remains the same.
As an alternative, could Primary B not be over and be a triangle, flat, or combination??
Yes, that’s also possible. But given the strength of the last wave down labelled intermediate (1) I’d rather not see that as a B wave, which it would have to be. It would have to be a B wave within a B wave. They’re usually really weak. That was not a weak wave.