
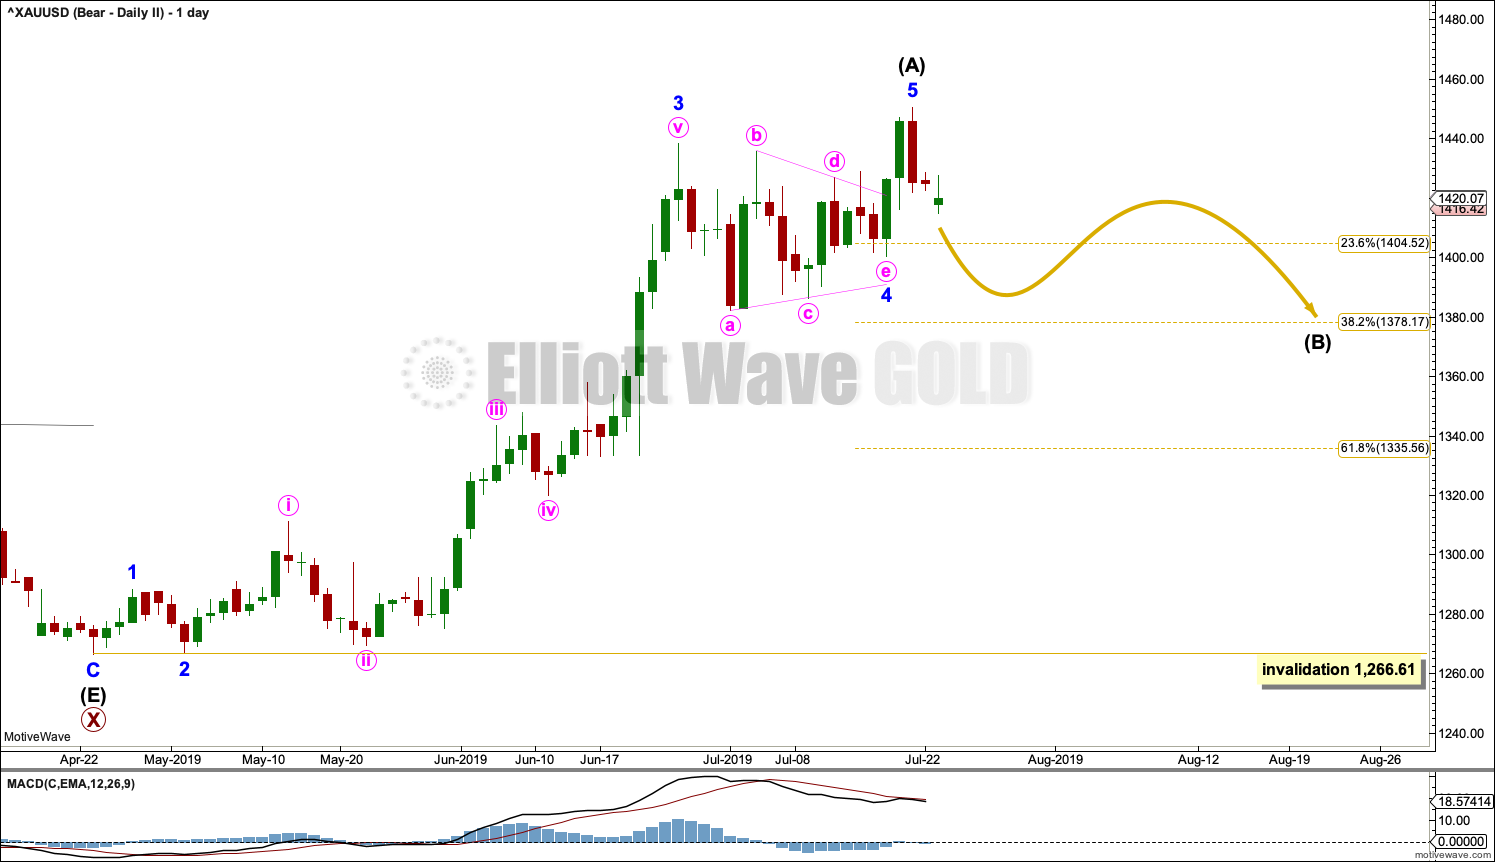
Another small range day remains above support. Both Elliott wave counts remain valid.
Summary: A sharp reversal and bearish candlestick pattern on the daily chart puts the breakout in some doubt.
Both bullish and bearish Elliott wave counts remain valid. The bearish case has some support from classic technical analysis after Friday’s sharp reversal. Confidence may be had if price makes a new low below 1,346.45.
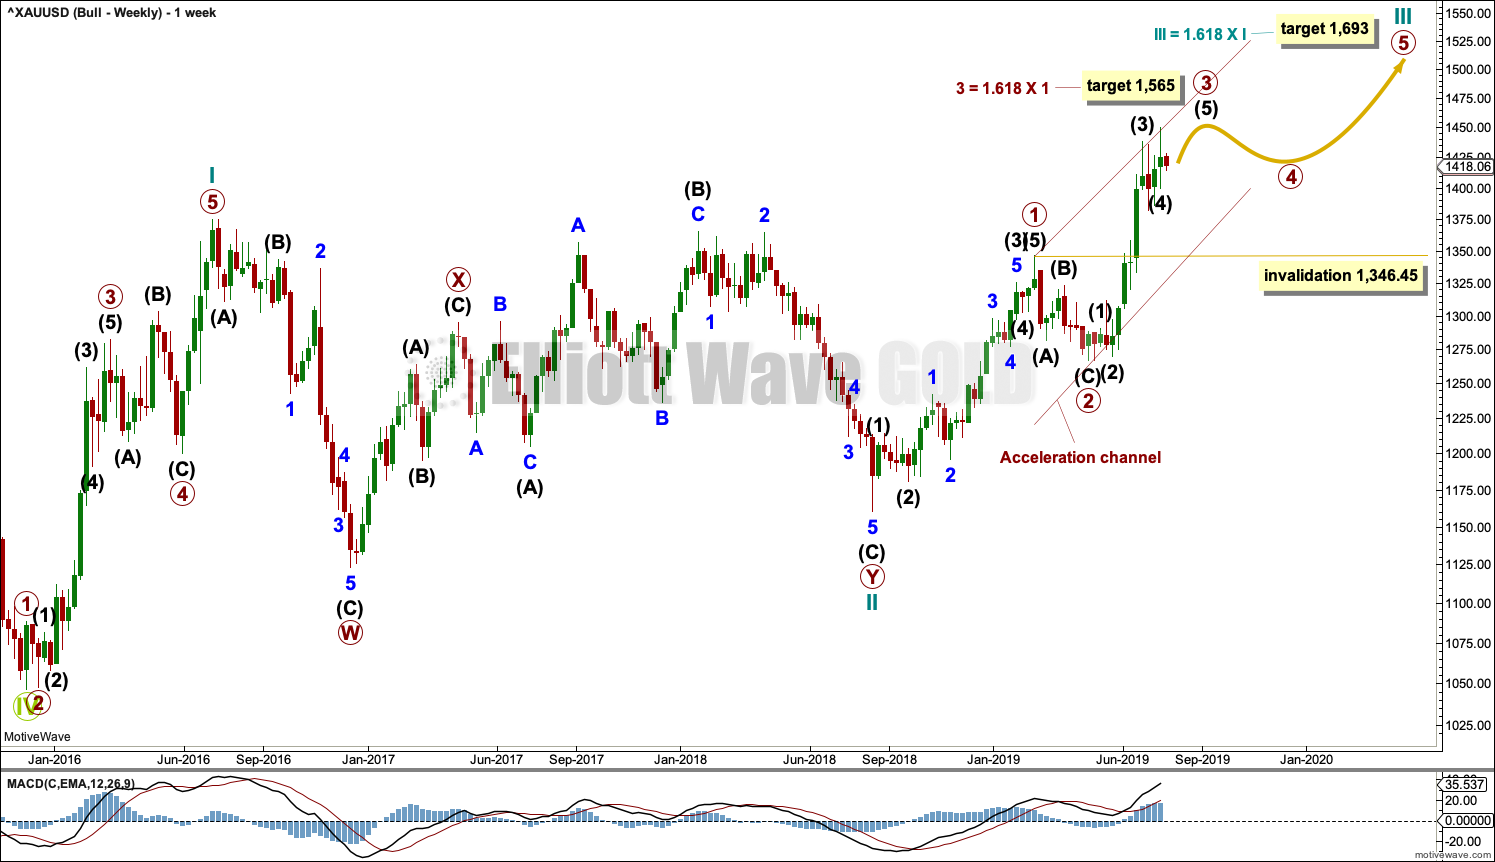
The bullish Elliott wave count now expects a continuation of upwards movement this week to 1,565.
Grand SuperCycle analysis is here.
Last monthly charts are here.
Overall, the bearish wave counts still have a higher probability based upon Elliott wave structures. However, it would be best to leave price to invalidate either the bullish or bearish scenario before having confidence in which is correct.
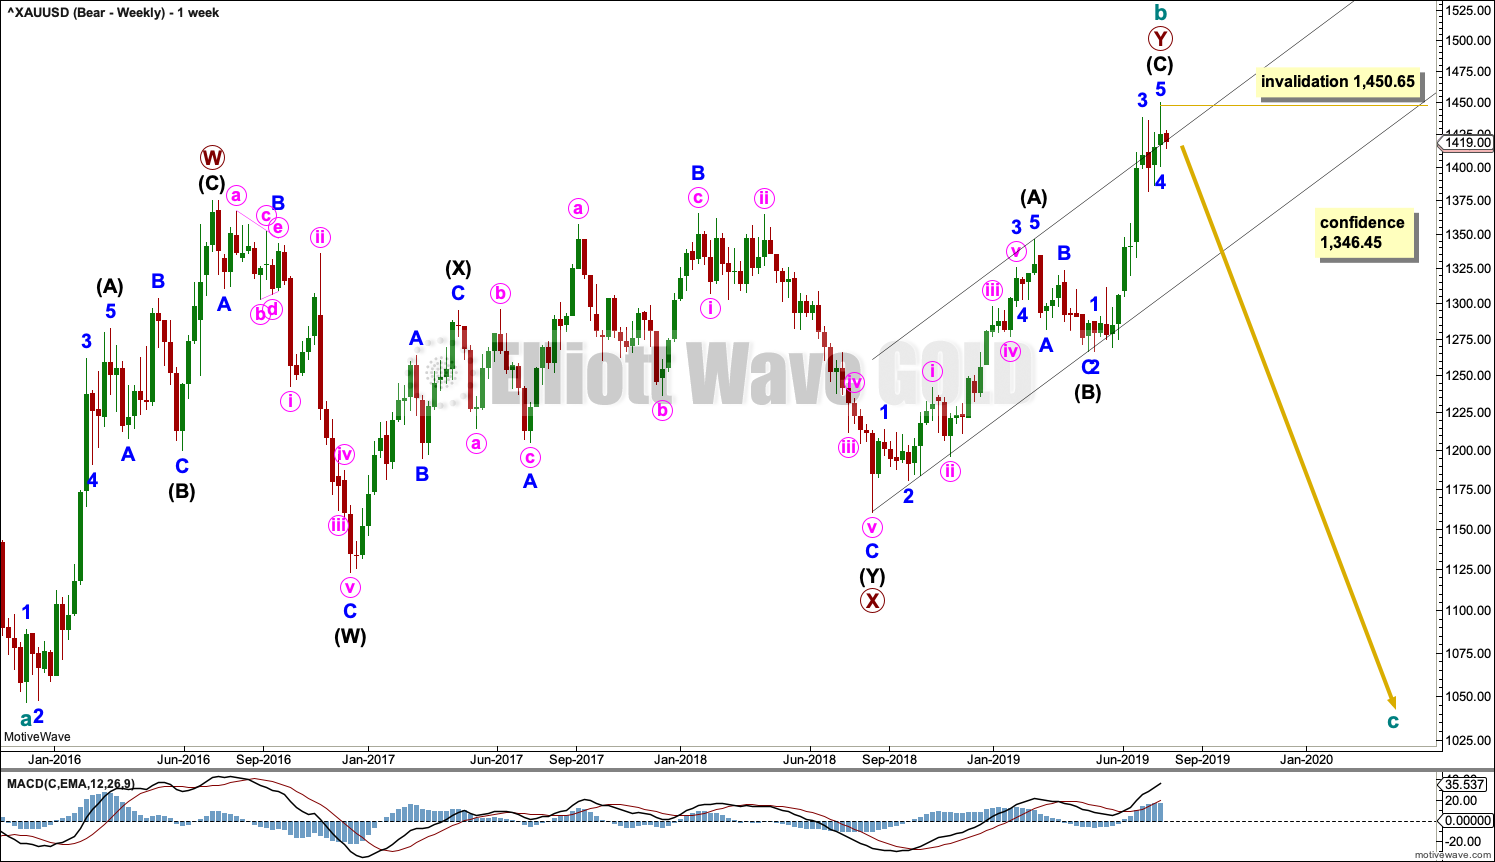
BEARISH ELLIOTT WAVE COUNTS
MAIN WEEKLY CHART
Click chart to enlarge.
It remains possible that the bear market for Gold may yet continue. It is possible that cycle wave b may be complete. Cycle wave b may be a double zigzag.
Double zigzags are common structures, but within them their X waves are almost always single zigzags that are relatively brief and shallow. However, this wave count sees primary wave X as a complete double combination: zigzag – X – expanded flat.
An X wave may occasionally subdivide as a multiple. In a multiple the maximum number of corrective structures is three: W, Y and Z. To label any one of W, Y or Z as a multiple would violate the Elliott wave rule. Here, the rule is met.
Primary wave Y may be a complete zigzag. Within the zigzag, intermediate wave (C) is 5.19 short of equality in length with intermediate wave (A).
The purpose of a second zigzag in a double zigzag is to deepen the correction when the first zigzag does not move price far enough. This purpose has been achieved.
A new low now by any amount at any time frame below 1,346.45 would invalidate the bullish wave count below and provide some confidence in this wave count.
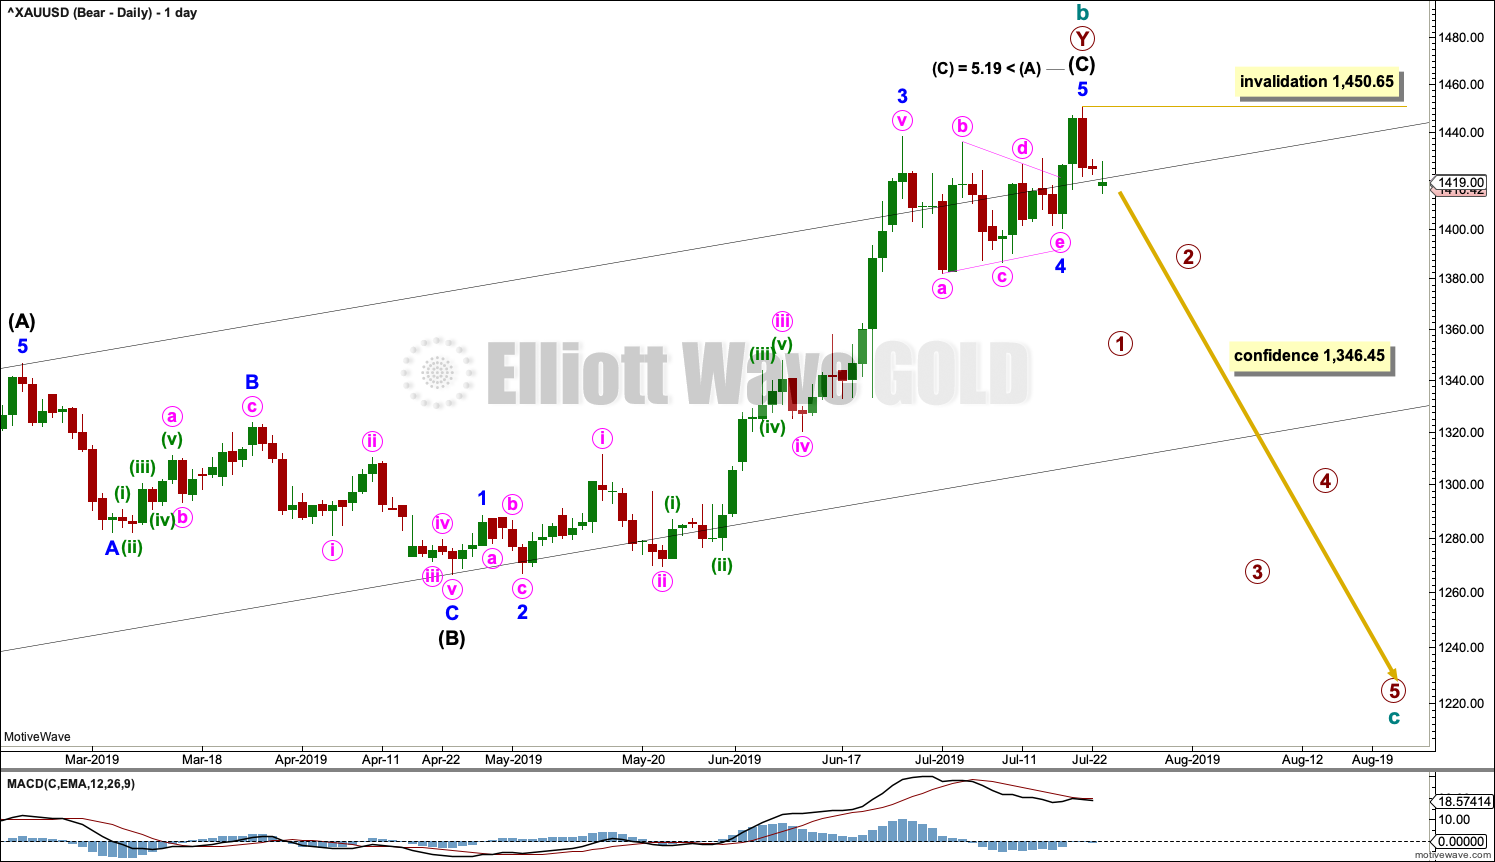
DAILY CHART
Click chart to enlarge.
This chart focusses on the impulse of intermediate wave (C).
Intermediate wave (C) may now be a complete impulse.
Gold often exhibits surprisingly short and brief fifth waves out of its fourth wave triangles, and this wave count expects that it may have done so here. This wave count follows common tendencies for this market.
Cycle wave c should move below the end of cycle wave a at 1,046.27 to avoid a truncation. Cycle wave c may only subdivide as a five wave structure, most likely an impulse. Within cycle wave c, primary wave 2 may not move beyond the start of primary wave 1 above 1,450.65.
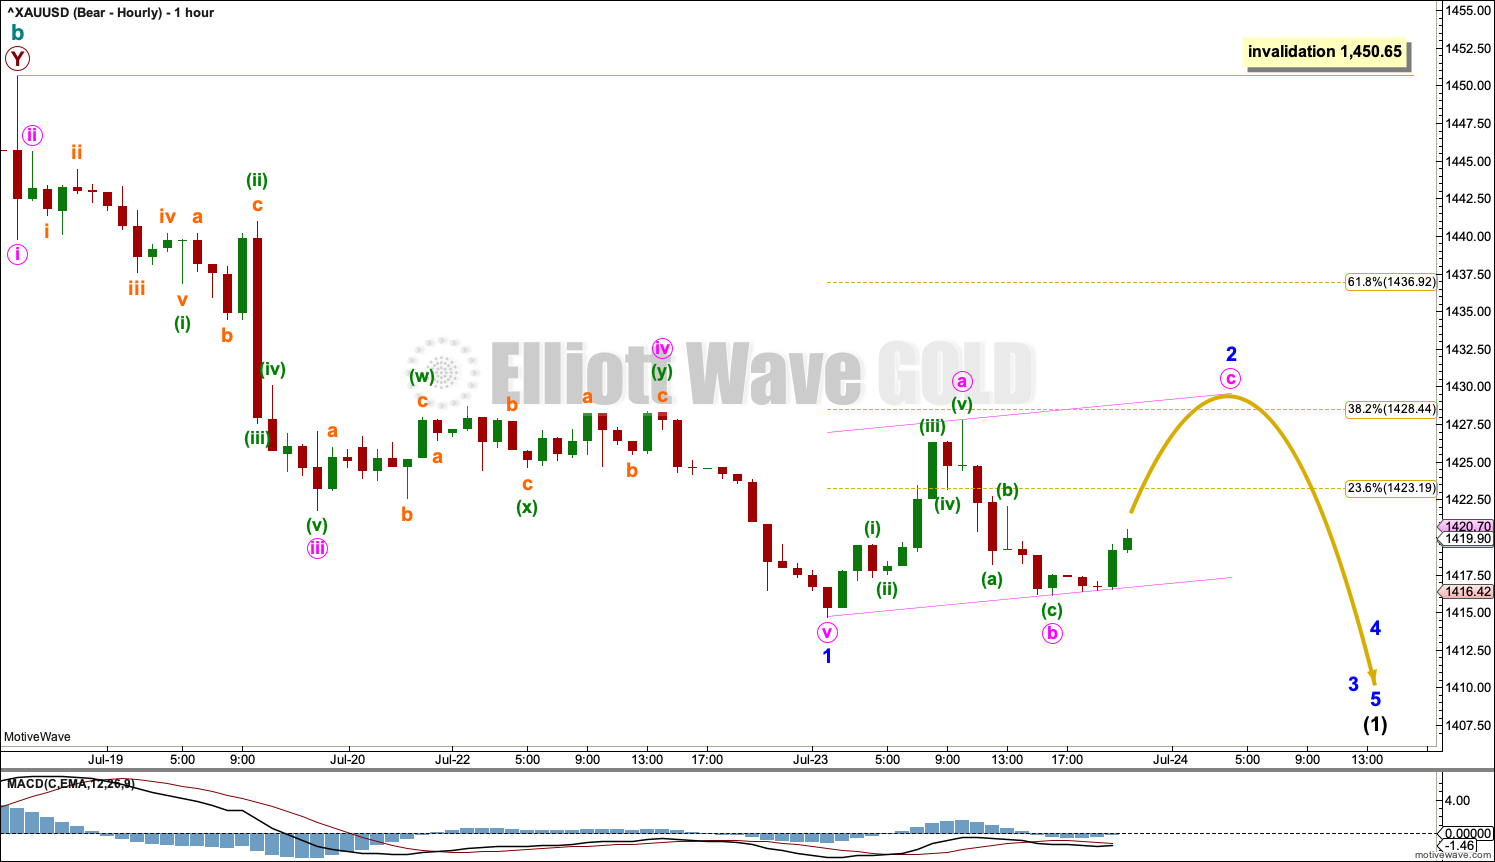
HOURLY CHART
Click chart to enlarge.
The fist five down from the high may be complete. This is labelled minor wave 1. However, within minor wave 1, minute wave iv is now disproportionate to minute wave ii. For commodities it is acceptable for fourth waves to be more brief than second waves, but in this example it is the other way around. This is unusual for Gold, but more acceptable on a lower time frame.
Minor wave 2 may not move beyond the start of minor wave 1 above 1,450.65.
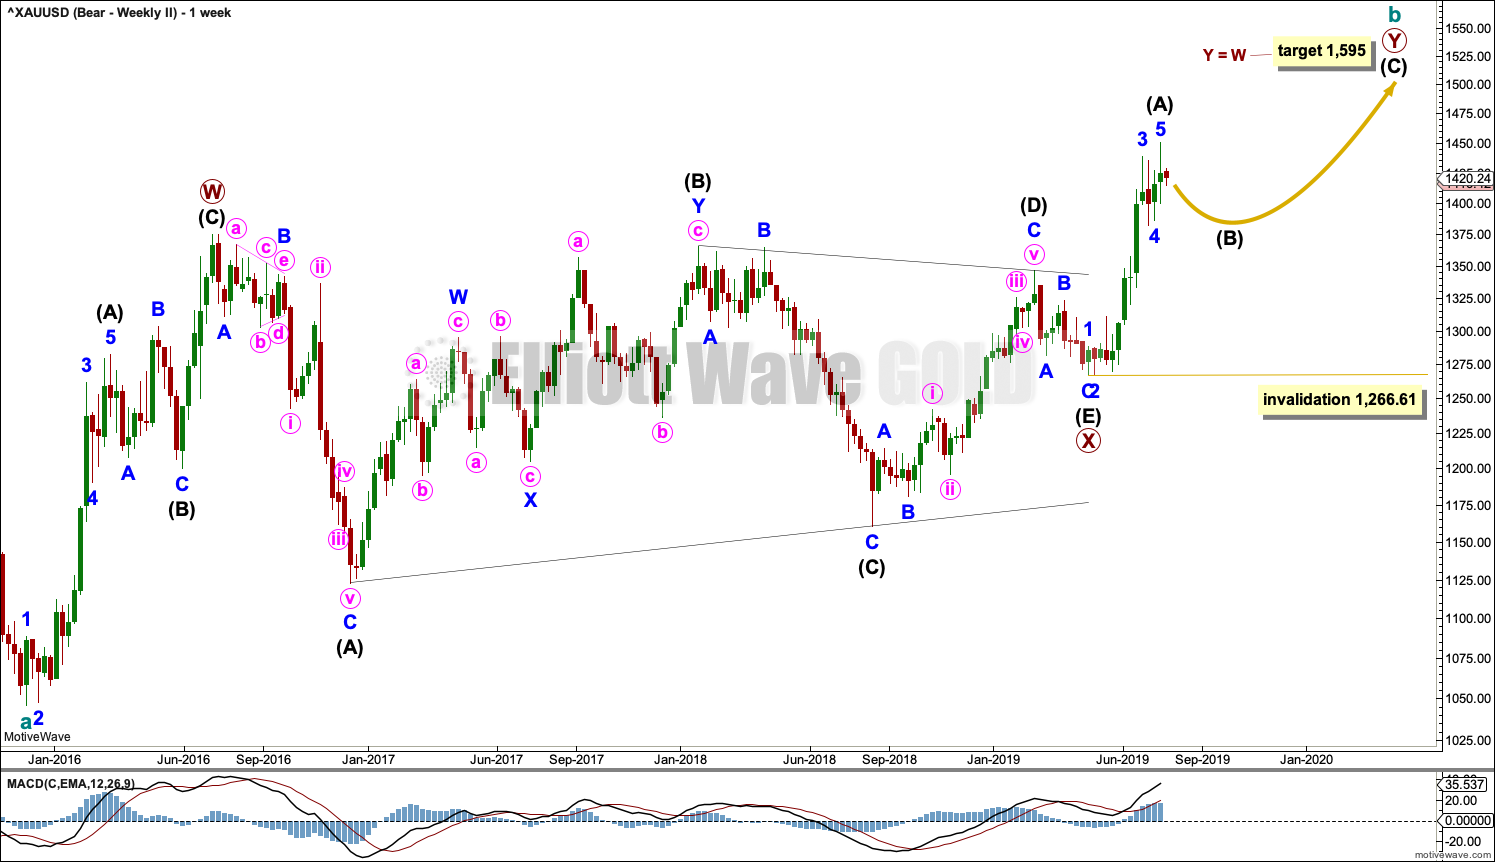
ALTERNATE WEEKLY CHART
Click chart to enlarge.
Now that this bearish wave count diverges from the main bearish wave count, it is time to publish it on a daily basis.
It remains possible that cycle wave b is an incomplete double zigzag.
The first zigzag in the double is seen in the same way for both bearish wave counts, a zigzag labelled primary wave W.
This alternate bearish wave count sees primary wave X as a different structure, a regular contracting triangle, that ends at a different point. Primary wave Y must subdivide as a zigzag if cycle wave b is a double zigzag. Within primary wave Y, intermediate wave (A) may now be complete, and intermediate wave (B) may not move beyond the start of intermediate wave (A) below 1,266.61.
ALTERNATE DAILY CHART
Click chart to enlarge.
Within primary wave Y, intermediate wave (A) may now be a complete five wave impulse.
Intermediate wave (B) may unfold over a few weeks. Intermediate wave (B) may subdivide as any one of more than 23 possible corrective Elliott wave structures. It may be a quick sharp pullback as a zigzag, or it may be a time consuming sideways consolidation as a combination, flat or triangle.
Intermediate wave (B) should exhibit weakness.
Intermediate wave (B) may end about either the 0.382 or 0.618 Fibonacci Ratios. It may be relatively shallow if it finds support about 1,375, so the 0.382 Fibonacci ratio may be favoured as a target.
BULLISH ELLIOTT WAVE COUNT
WEEKLY CHART
Click chart to enlarge.
This wave count sees the the bear market complete at the last major low for Gold in November 2015.
If Gold is in a new bull market, then it should begin with a five wave structure upwards on the weekly chart. However, the biggest problem with this wave count is the structure labelled cycle wave I because this wave count must see it as a five wave structure, but it looks more like a three wave structure.
Commodities often exhibit swift strong fifth waves that force the fourth wave corrections coming just prior and just after to be more brief and shallow than their counterpart second waves. It is unusual for a commodity to exhibit a quick second wave and a more time consuming fourth wave, and this is how cycle wave I is labelled. This wave count still suffers from this very substantial problem, and for this reason a bearish wave count is still considered above as it has a better fit in terms of Elliott wave structure.
Cycle wave II subdivides well as a double combination: zigzag – X – expanded flat.
Cycle wave III may have begun. Within cycle wave III, primary waves 1 and 2 may now be complete. If it continues lower as a double zigzag, then primary wave 2 may not move beyond the start of primary wave 1 below 1,160.75.
Cycle wave III so far for this wave count would have been underway now for 48 weeks. It may be beginning to exhibit some support from volume and increasing ATR. If this increase continues, then this wave count would have some support from technical analysis.
Draw an acceleration channel about primary waves 1 and 2: draw the first trend line from the end of primary wave 1 to the last high, then place a parallel copy on the last high. Keep redrawing the channel as price continues higher. When primary wave 3 is complete, then this channel would be drawn using Elliott’s first technique about the impulse. The lower edge may provide support.
Primary wave 4 may not move into primary wave 1 price territory below 1,346.45. Because the data used for this analysis is cash market data no overlap between primary waves 4 and 1 should be allowed. The invalidation point is absolute.
DAILY CHART
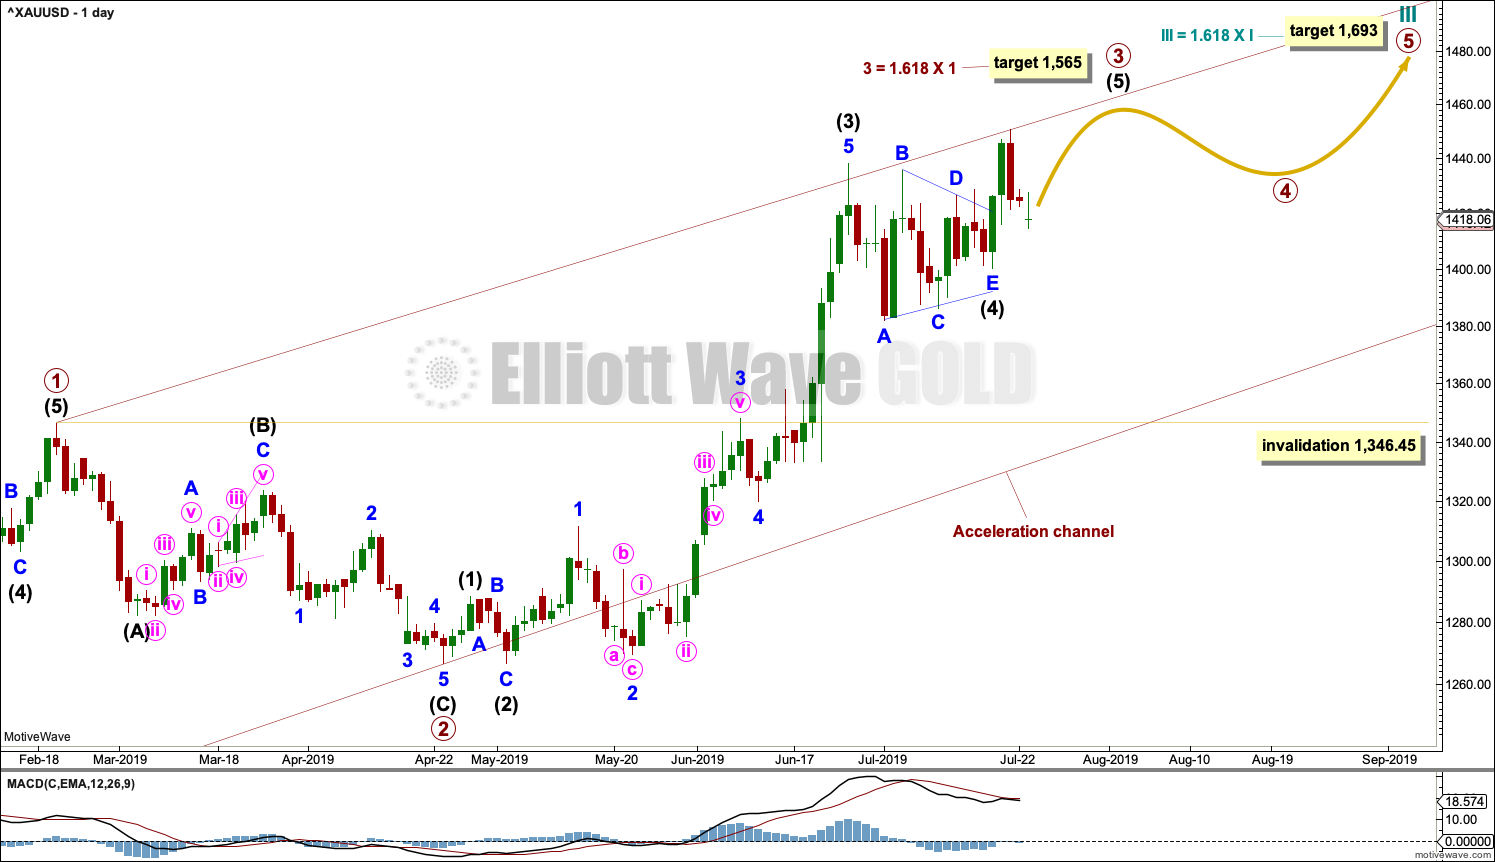
Click chart to enlarge.
This daily chart focusses on the impulse of primary wave 3.
Primary wave 3 may only subdivide as an impulse. Within the impulse, intermediate waves (1) through to (4) are all now complete. It is possible that intermediate wave (5) could be over at the last high, but for this wave count it would look more normal if it continued higher.
When it arrives, then primary wave 4 may not move into primary wave 1 price territory below 1,346.45.
HOURLY CHART
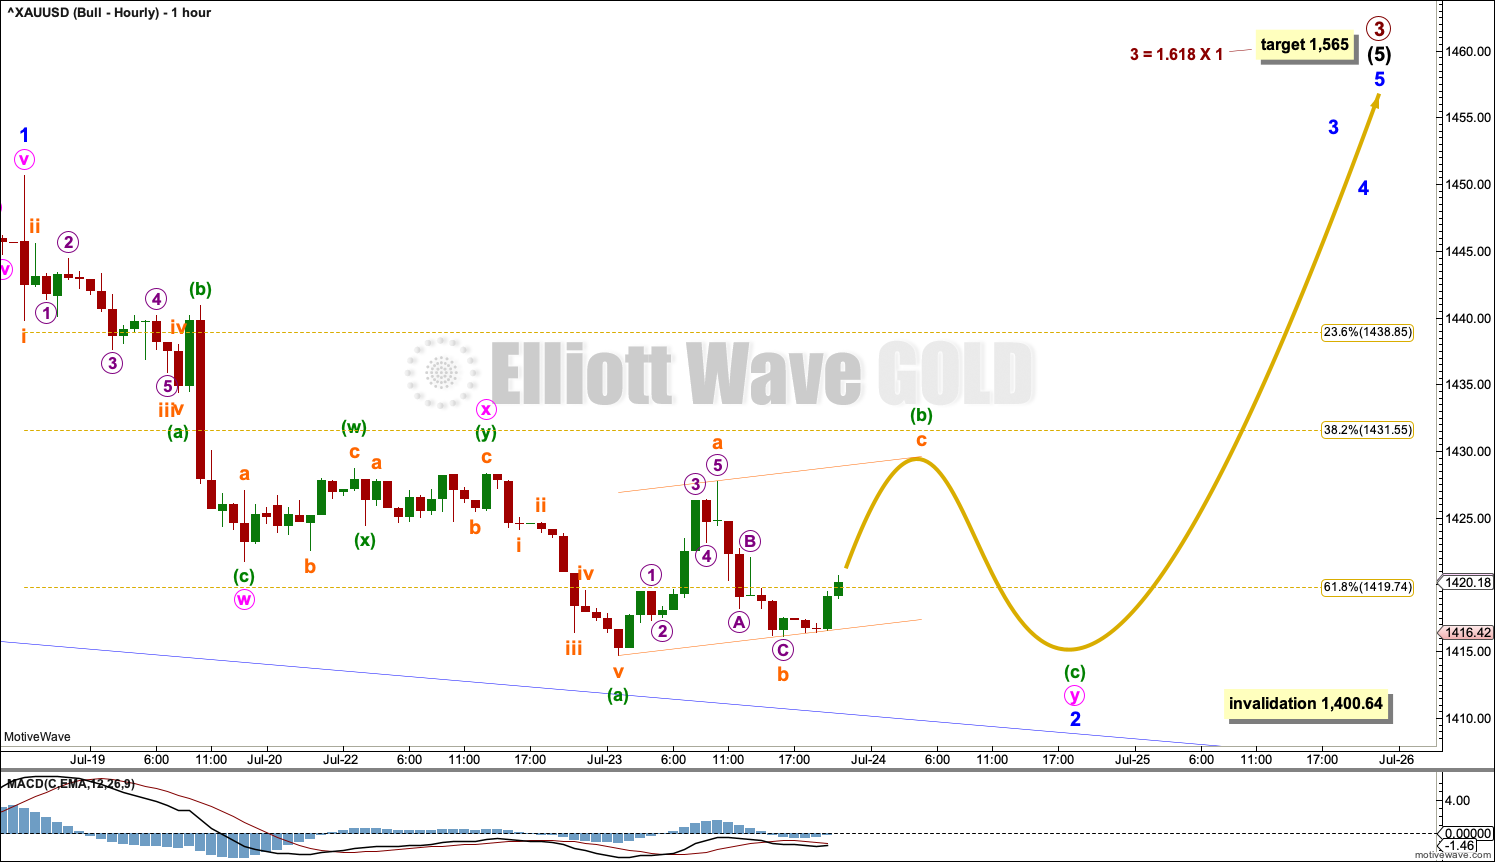
Click chart to enlarge.
Intermediate wave (5) may only subdivide as a five wave structure, either an impulse or an ending diagonal. Fifth waves to end third waves one degree higher, as this one is, almost always subdivide as impulses (that is what shall be expected).
Within intermediate wave (5), minor wave 1 may be complete. Although minor wave 1 looks like a three wave structure, it has a more time consuming second wave and a brief shallow fourth wave; this is normal for this market, so this is acceptable.
Minor wave 2 may not move beyond the start of minor wave 1 below 1,400.64. Minor wave 2 may be an incomplete double zigzag.
If this wave count is invalidated at the hourly chart level, it would indicate that primary wave 3 should be labelled as complete at the last high. At that stage, it would be expected that primary wave 4 should be underway and the invalidation point at 1,346.45 would apply.
TECHNICAL ANALYSIS
MONTHLY CHART
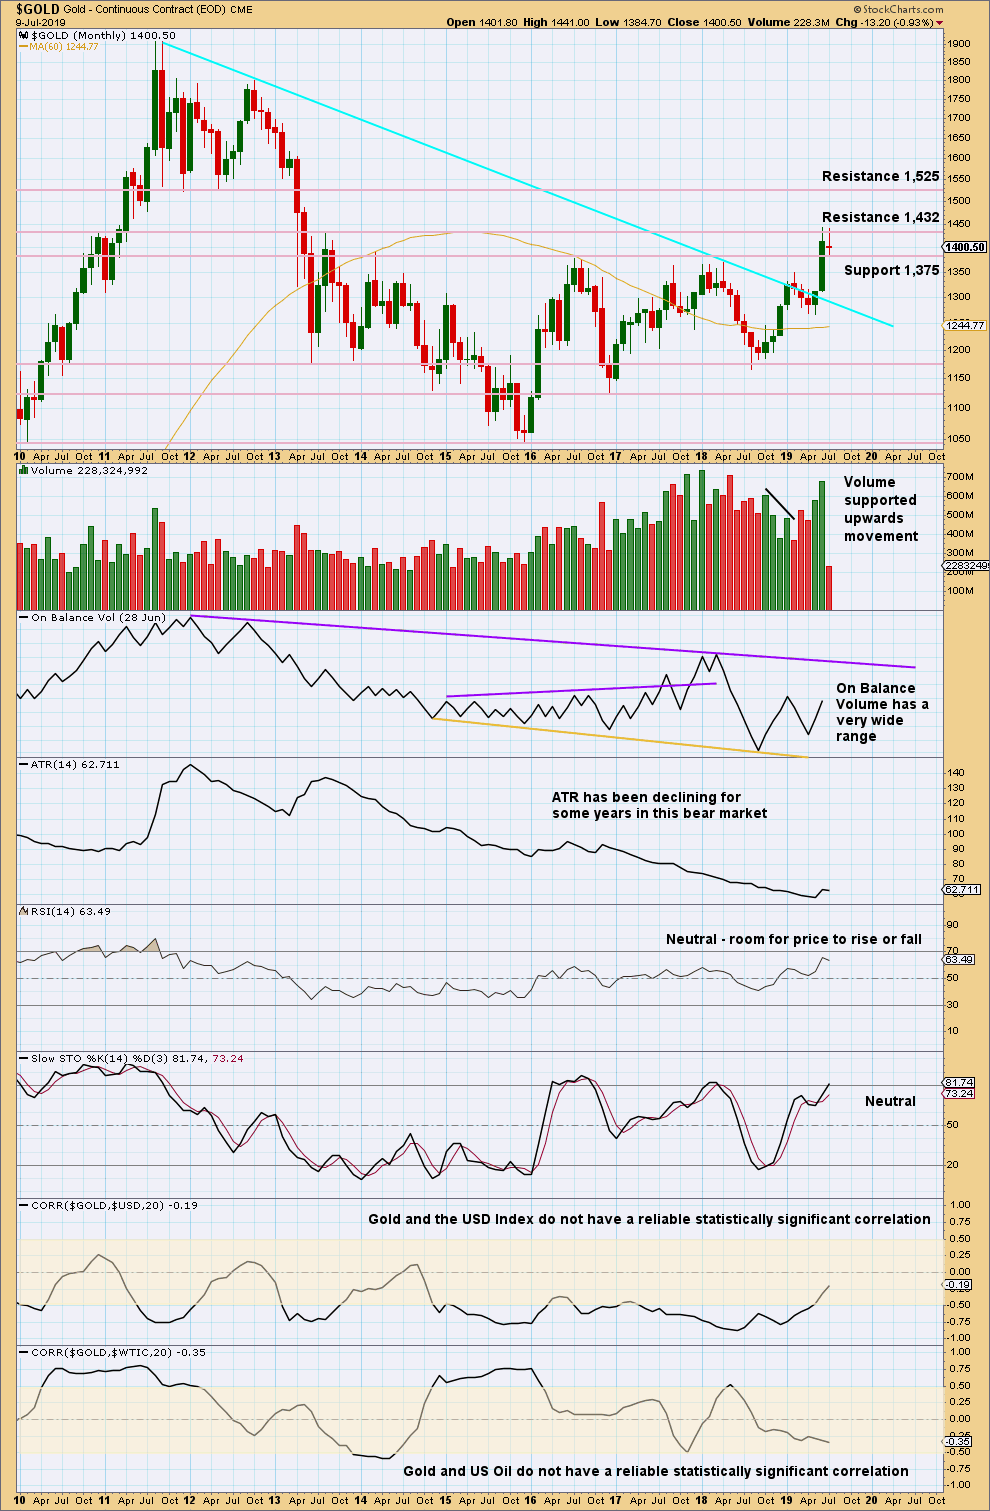
Click chart to enlarge. Chart courtesy of StockCharts.com.
Gold has effected an upwards breakout above multi-year resistance and above the cyan bear market trend line. Look for next resistance identified on the chart.
WEEKLY CHART
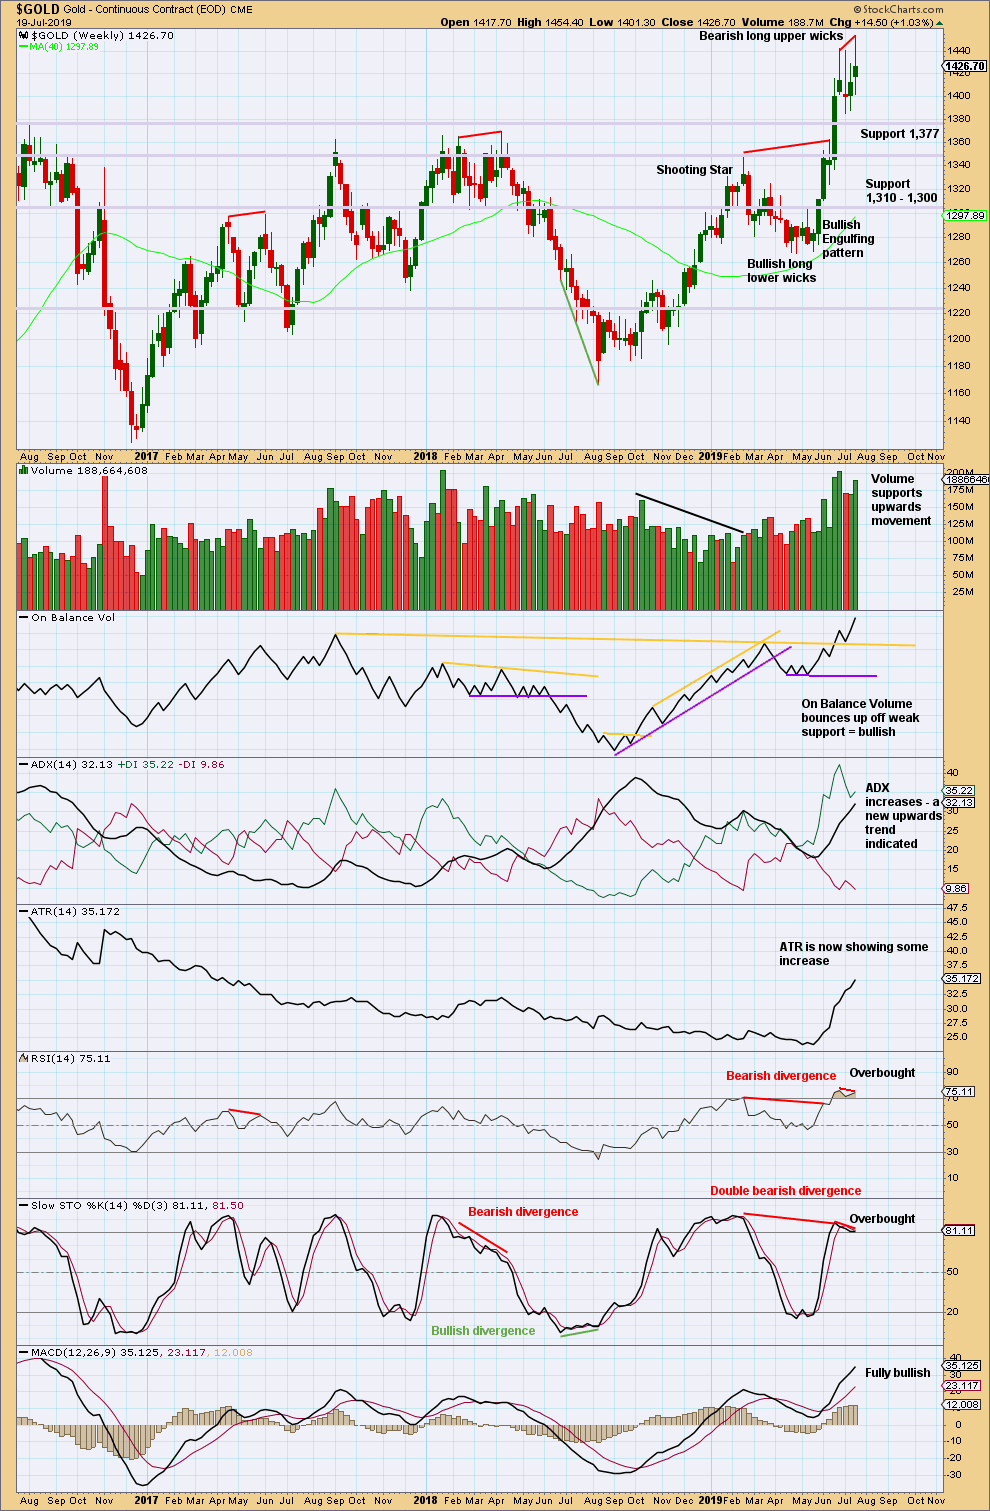
Click chart to enlarge. Chart courtesy of StockCharts.com.
A new high last week now exhibits some bearish divergence between price and RSI. However, as has been seen recently, sometimes this divergence simply disappears.
The bottom line remains that a multi year breakout occurred a few weeks ago, and it occurred with strength in volume. While price remains above support about 1,377 and ADX indicates an upwards trend, this chart will remain overall bullish.
DAILY CHART
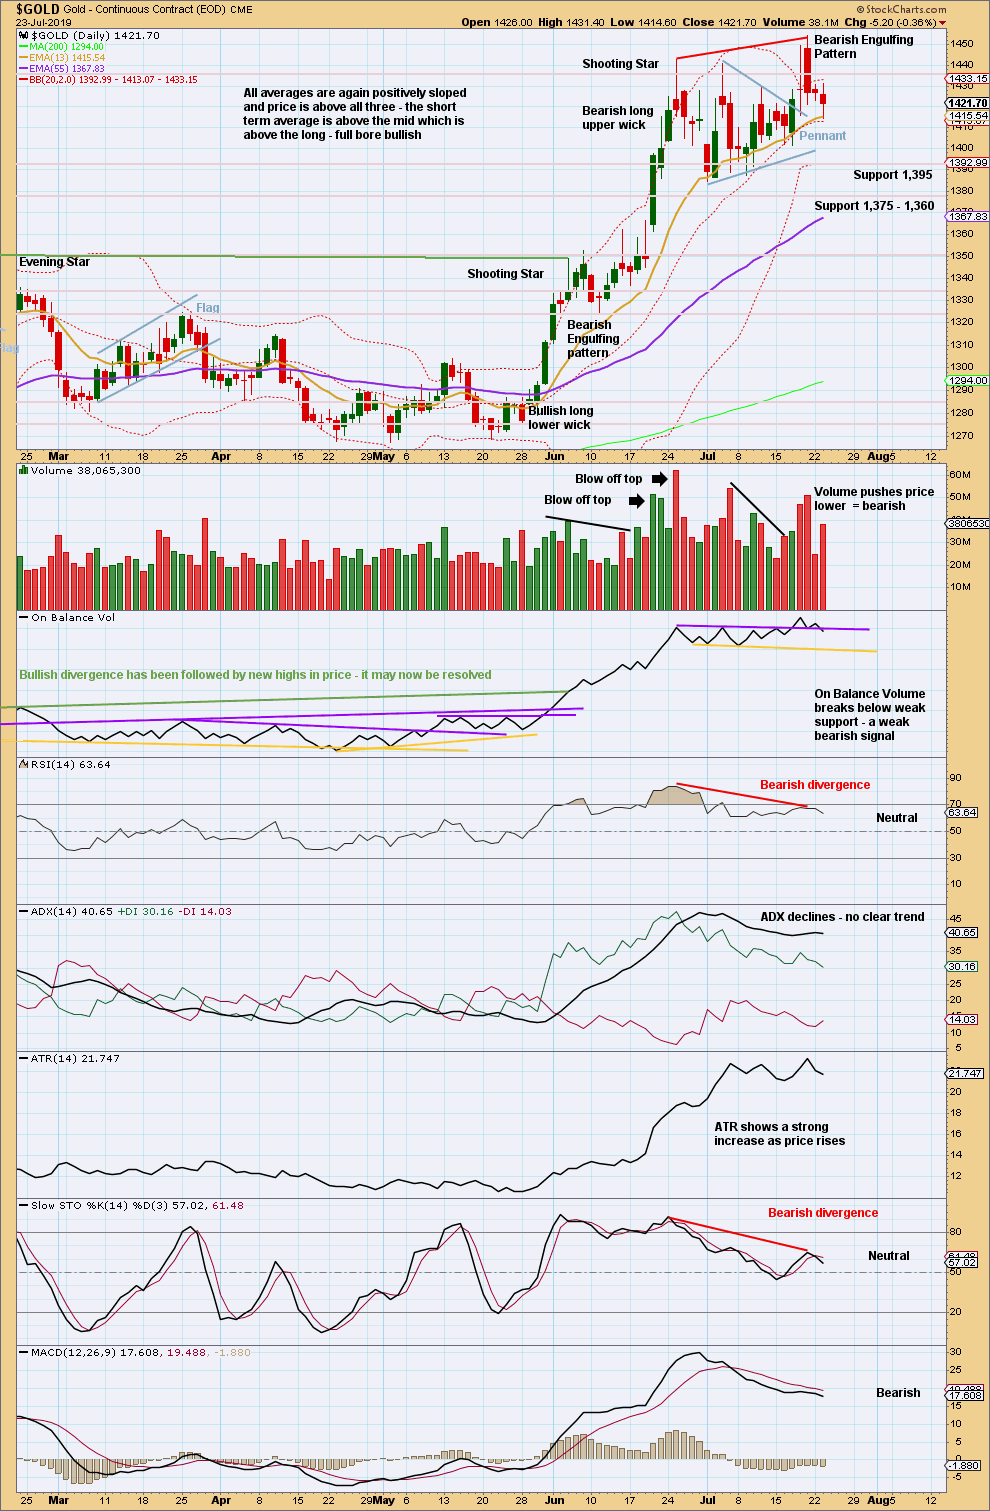
Click chart to enlarge. Chart courtesy of StockCharts.com.
A strong bearish reversal pattern has completed, which has support from volume. The upwards trend remains very extreme. RSI here reached overbought and now exhibits strong bearish divergence with price.
Look out for either another more time consuming consolidation to relieve extreme conditions before the upwards trend can resume, or a trend change. This is essentially the bullish and bearish case for the Elliott wave counts both seen in this chart.
Today a weak bearish signal from On Balance Volume with some support from volume pushing price lower indicates more downwards movement may be likely for the next session.
GDX WEEKLY CHART
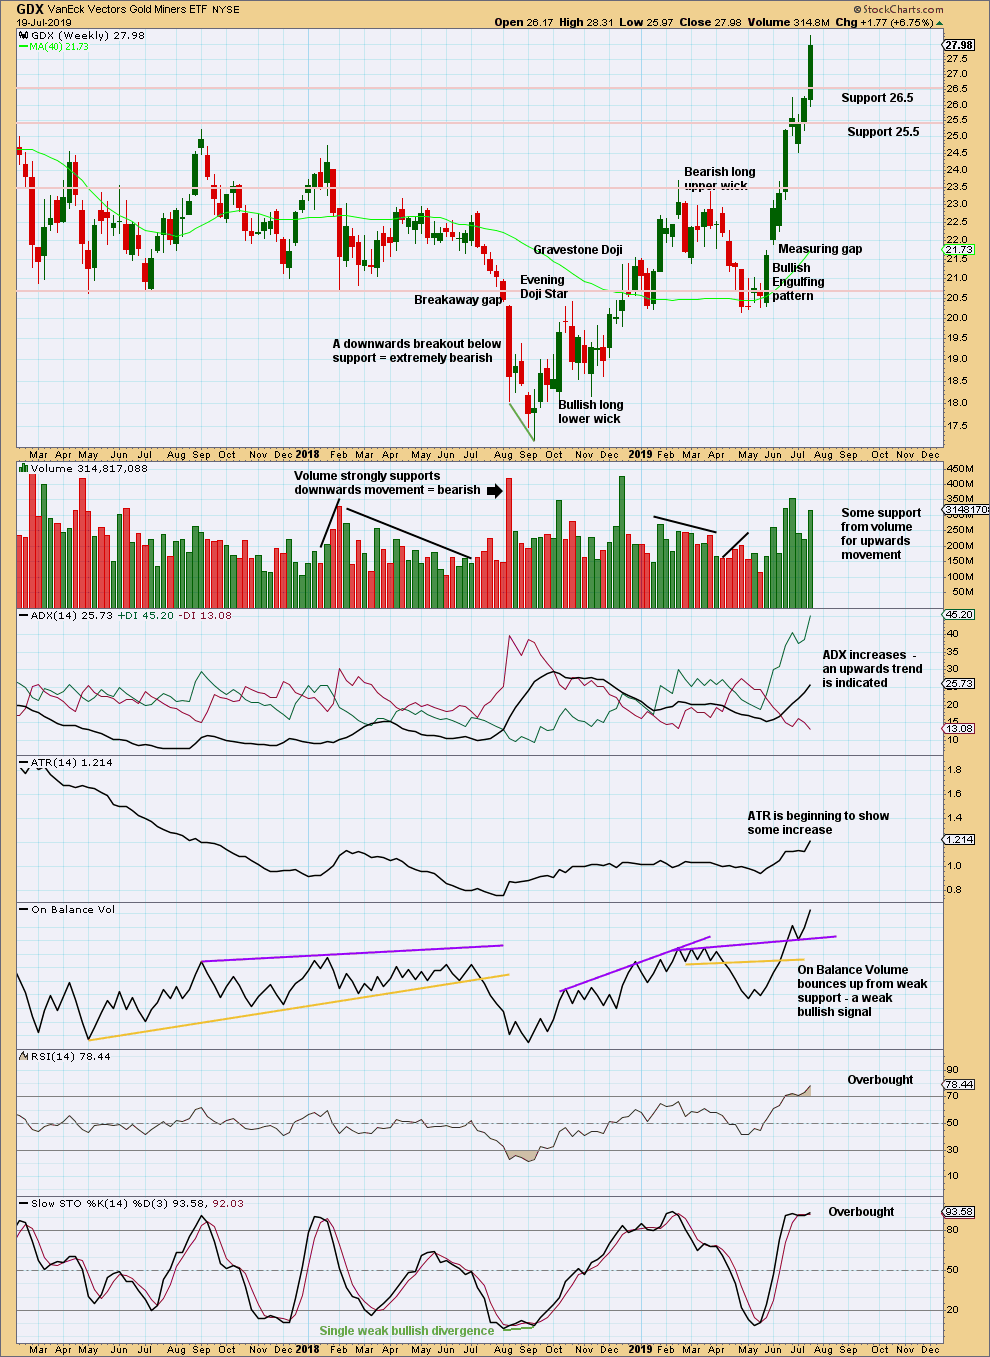
Click chart to enlarge. Chart courtesy of StockCharts.com.
The upwards trend continues, but conditions are now overbought. This can continue for a while during a strong trend. At this stage, there are no signs of a reversal.
Last week volume offers some support to upwards movement.
GDX DAILY CHART
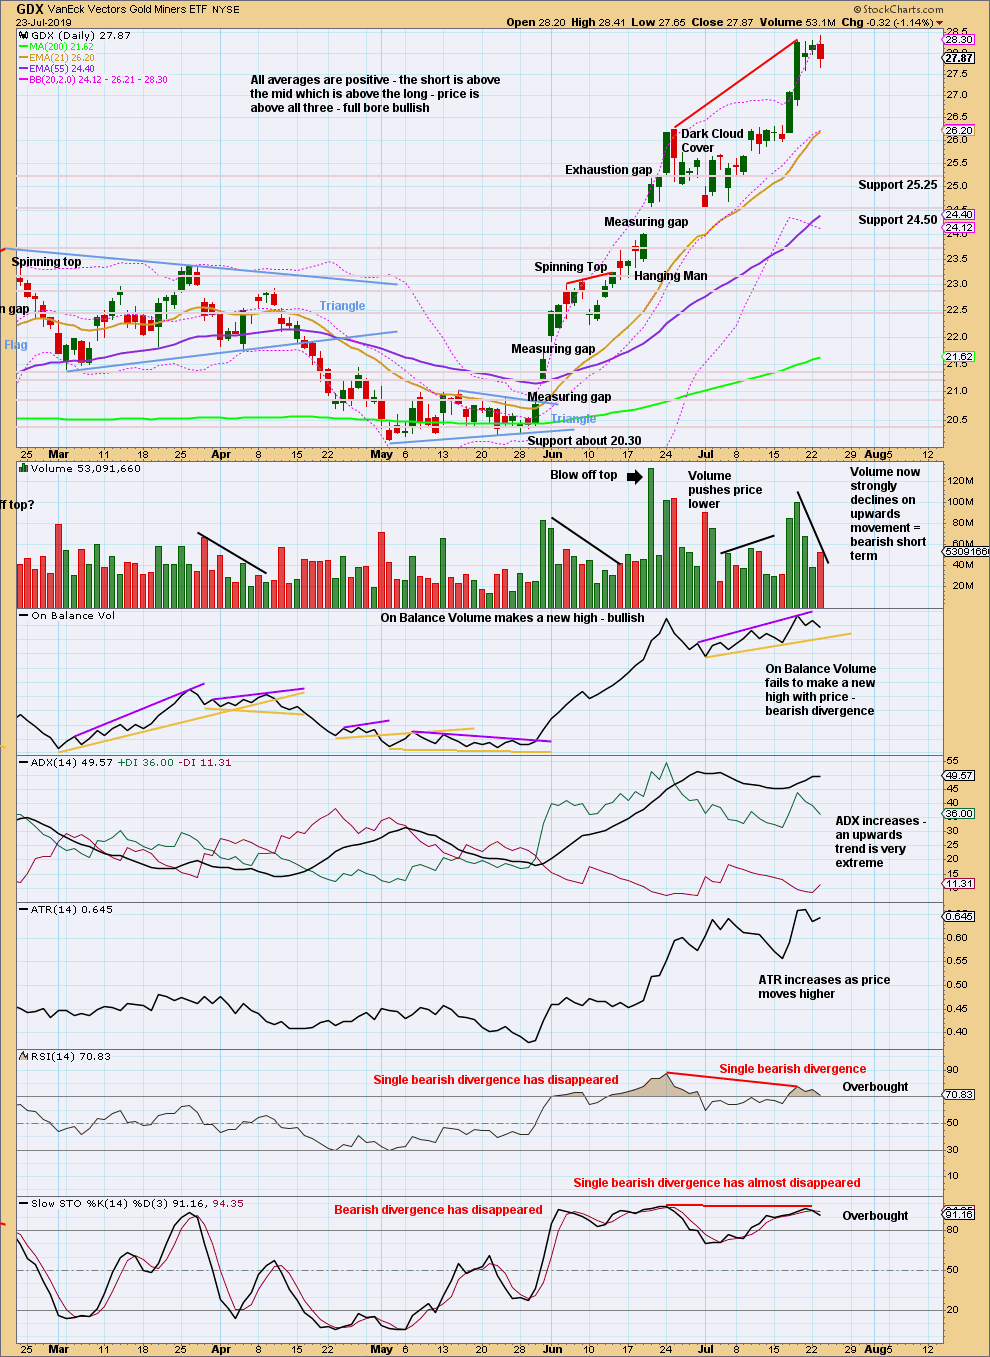
Click chart to enlarge. Chart courtesy of StockCharts.com.
A short-term target taken from the width of the last consolidation may be about 28.02.
The trend is very extreme and conditions are overbought, but there is still zero evidence of a trend change. Assume the trend remains the same until proven otherwise.
Proven otherwise would be a new swing low below 24.53 or a strong bearish candlestick reversal pattern.
Published @ 10:09 p.m. EST.
—
Careful risk management protects your trading account(s).
Follow my two Golden Rules:
1. Always trade with stops.
2. Risk only 1-5% of equity on any one trade.
—
New updates to this analysis are in bold.
Silver looks like its finishing a leading contracting diagonal for a final 5th wave of a final C wave (I think). I’m now short silver.
I’ve gone short gold futures too.
The US Markit flash PMIs and overnight data should have really supported gold more, but sentiment is very bullish (contrary indicator) and spec positioning is also one sided bullish (contrary). I tend to think some distribution is occurring at these levels.
The breakout area of 1370, to me, still needs to be tested.
Also, I’m tracking a weekly bearish set-up in gold, that with a break of 1385 targets 1320 (minimum) and a daily bearish set-up in silver, that with a break of 16.195 (Sep) targets 15.71 (minimum). Silver needs to drop below 16.195 by Friday to trigger, gold needs to drop to 1385 by end of next week.
I’ll also be watching the PMs to see how sticky price is over the next week. I find it interesting that the XAU was closer to 115 when gold was trading near 1450, and silver was well over 20…I consider both leading indicators for gold.
My tolerance for losses is fairly limited on the short side (I generally want to be bullish), and if gold consolidates in the 1410 to 1430 areas through next week, then I will likely lean back to bullish. Essentially, I’m positioned for a very quick drop through next week with pretty tight stops.
Corey
For gold, it looks like this 2nd wave correction is a regular flat…which is why I decided to short. Although it could be a zig zag and head a bit higher.
In silver, the leading contracting diagonal fits all rules and counts best as a 5-3-5-3-5. It can’t go above 16.7025 (cash).
Cash gold went to 16.72 (cash) today. So much for can’t go above 16.7025
Barchart has cash at 16.608 as high. My broker feed has 16.6520 as high. Both cash. In fact, Sep only hit 16.68.
So yes, if you’re talking about gold, then it’s much higher than 16.7025.
Of course, I might be wrong…just my interpretation. I didn’t say it can’t go above it, I just said my ending diagonal count can’t go above it.
Thank you Corey for your input and overall perspective. I felt very positive reading it. I ditto your last paragraph on first comment–though I’m in ETF(s).
*Ending* contracting diagonal for silver (not leading).
Re hrly charts current activity: Am I correct that a wave 1 can not be a triangle/ wedge? thoughts on where we’re at?
First waves can be leading diagonals. The classic analysis pattern equivalent is a wedge.