
Both hourly charts yesterday expected some downwards movement, which is what is happening so far.
Summary: There remains an upwards trend in place at the weekly chart level. With conditions extreme, a sideways consolidation may continue this week and possibly for another few weeks to relieve extreme conditions. This scenario favours the main bearish wave count. The final target for that count is 1,595. There is strong support below about 1,375.
The bullish Elliott wave count remains valid while price remans above 1,346.45. The mid-term target is 1,565.
Grand SuperCycle analysis is here.
Monthly charts were last published here with video here.
BEARISH ELLIOTT WAVE COUNTS
MAIN WEEKLY CHART
Click chart to enlarge.
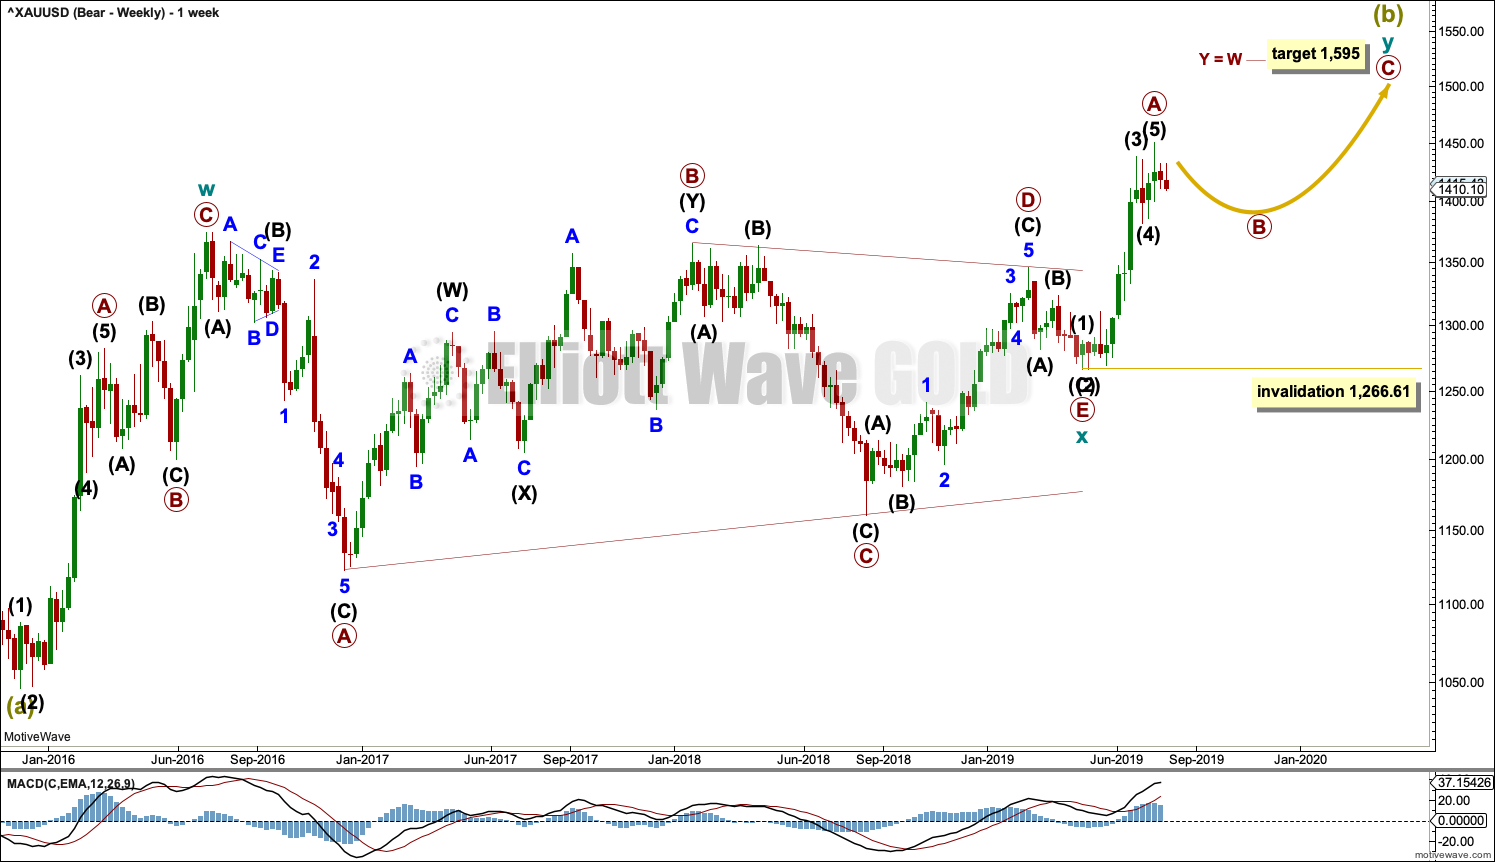
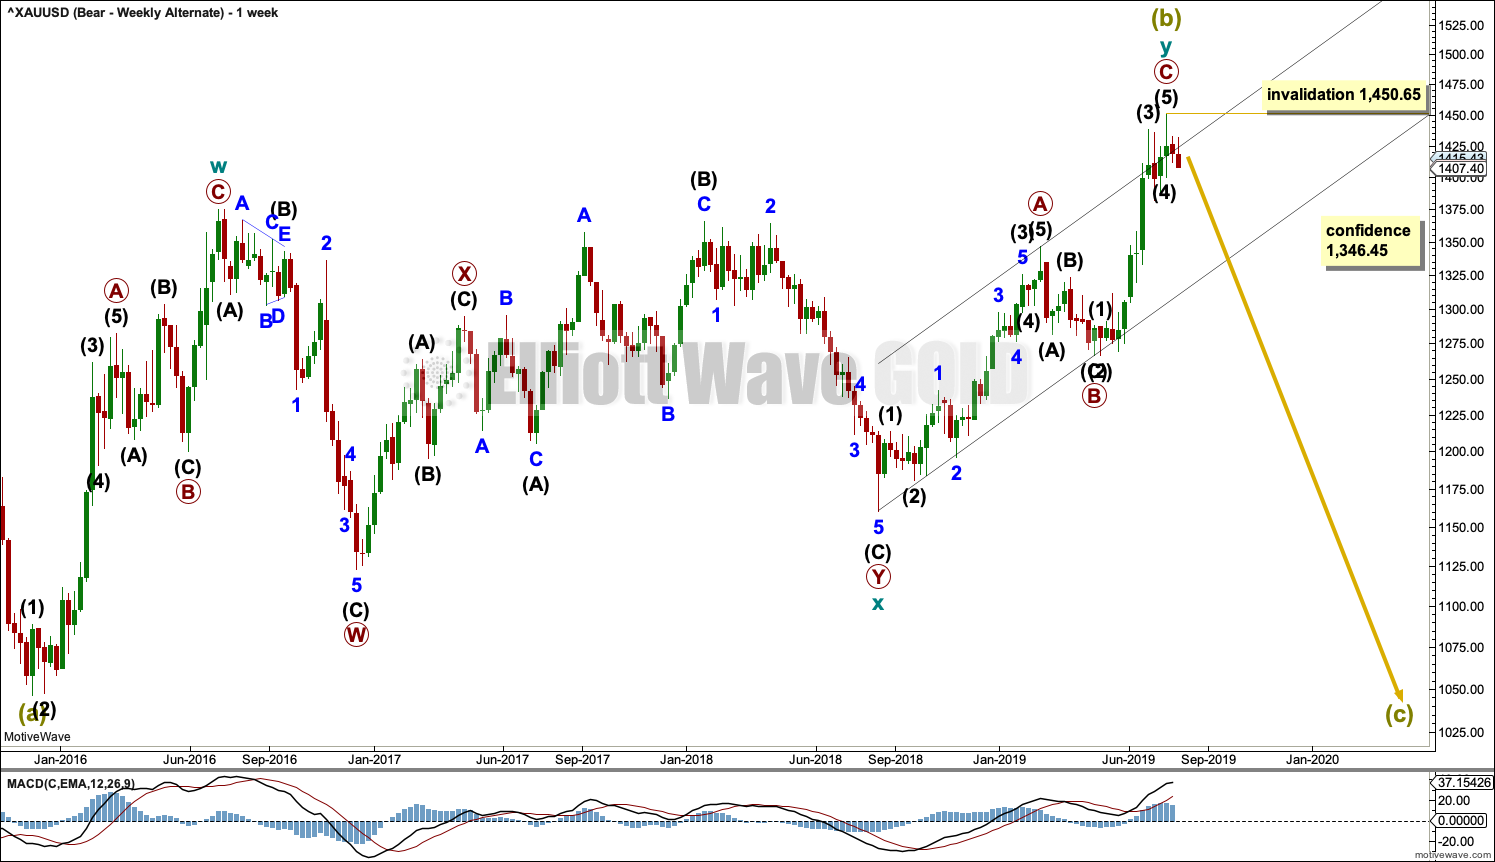
It remains possible that Super Cycle wave (b) is an incomplete double zigzag.
The first zigzag in the double is seen in the same way for both bearish wave counts, a zigzag labelled cycle wave w.
This main bearish wave count sees cycle wave x as regular contracting triangle. Cycle wave y must subdivide as a zigzag if Super Cycle wave (b) is a double zigzag. Within cycle wave y, primary wave A may now be complete, and primary wave B may not move beyond the start of primary wave A below 1,266.61.
Primary wave B may continue further for a few more weeks to relieve extreme conditions and complete a corrective Elliott wave structure.
MAIN DAILY CHART
Click chart to enlarge.
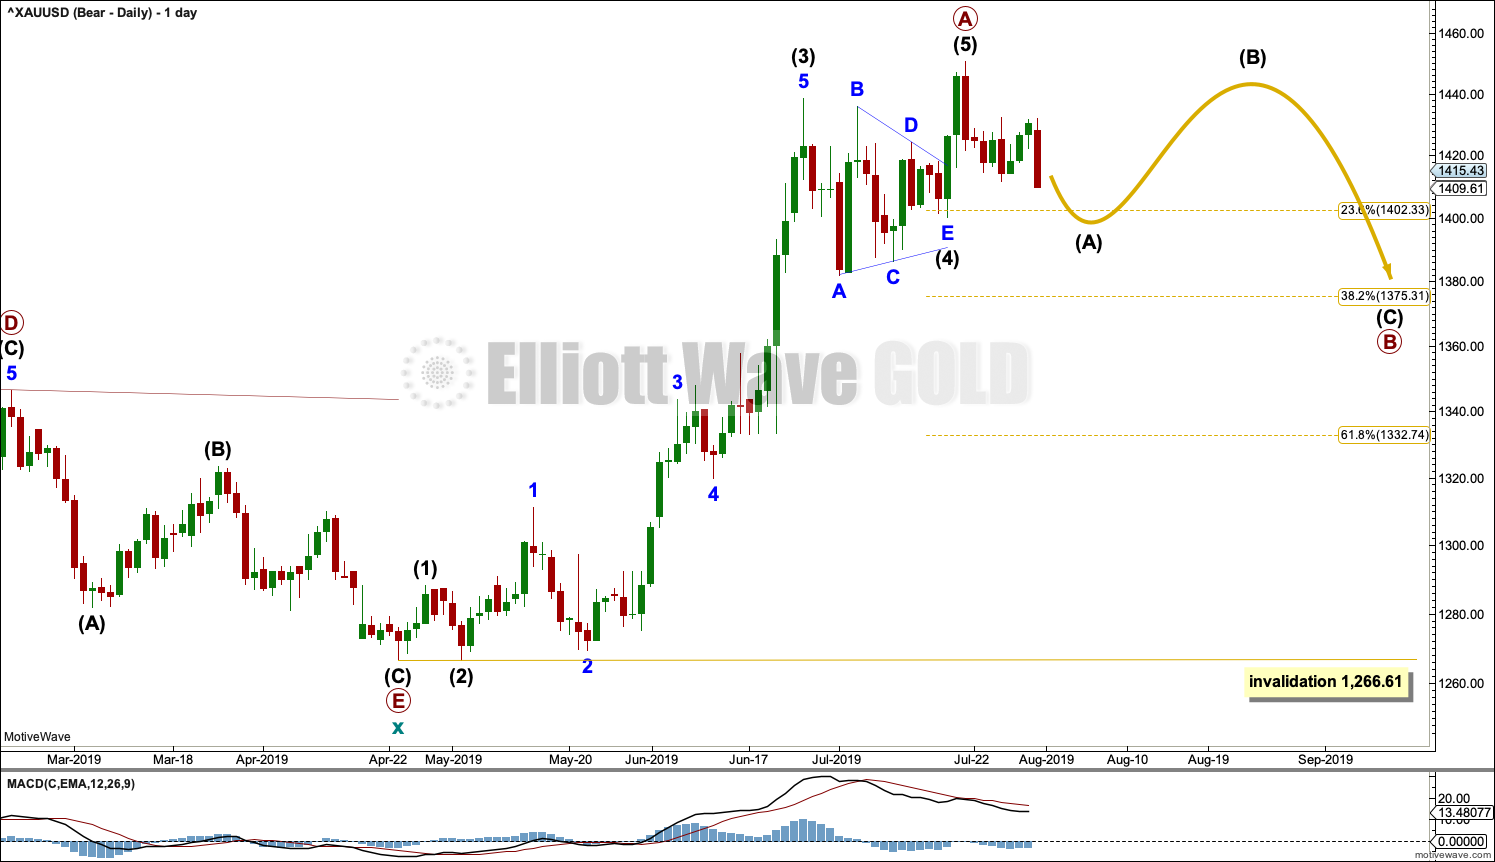
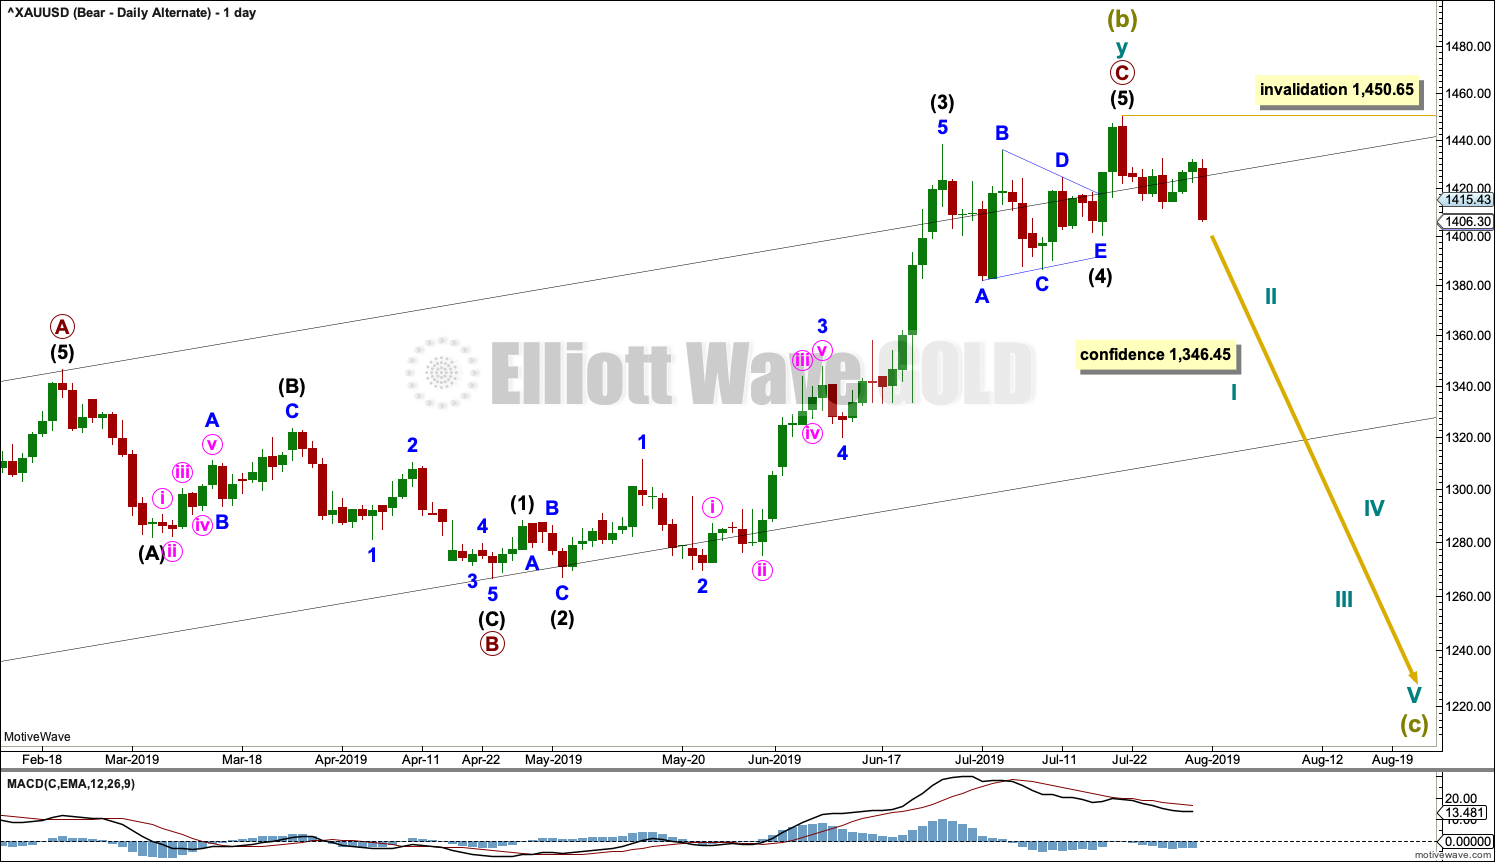
Within cycle wave y, primary wave A may now be a complete five wave impulse.
Primary wave B may unfold over a few weeks. Primary wave B may subdivide as any one of more than 23 possible corrective Elliott wave structures. It may be a quick sharp pullback as a zigzag, or it may be a time consuming sideways consolidation as a combination, flat or triangle.
Primary wave B should exhibit weakness.
Primary wave B may end about either the 0.382 or 0.618 Fibonacci Ratios. It may be relatively shallow if it finds support about 1,375, so the 0.382 Fibonacci ratio may be favoured as a target.
If primary wave B subdivides as any one of an expanded flat, running triangle or combination, then it may include a new high above its start at 1,450.65. A new high above this point does not invalidate this wave count at the daily chart level.
HOURLY CHART
Click chart to enlarge.
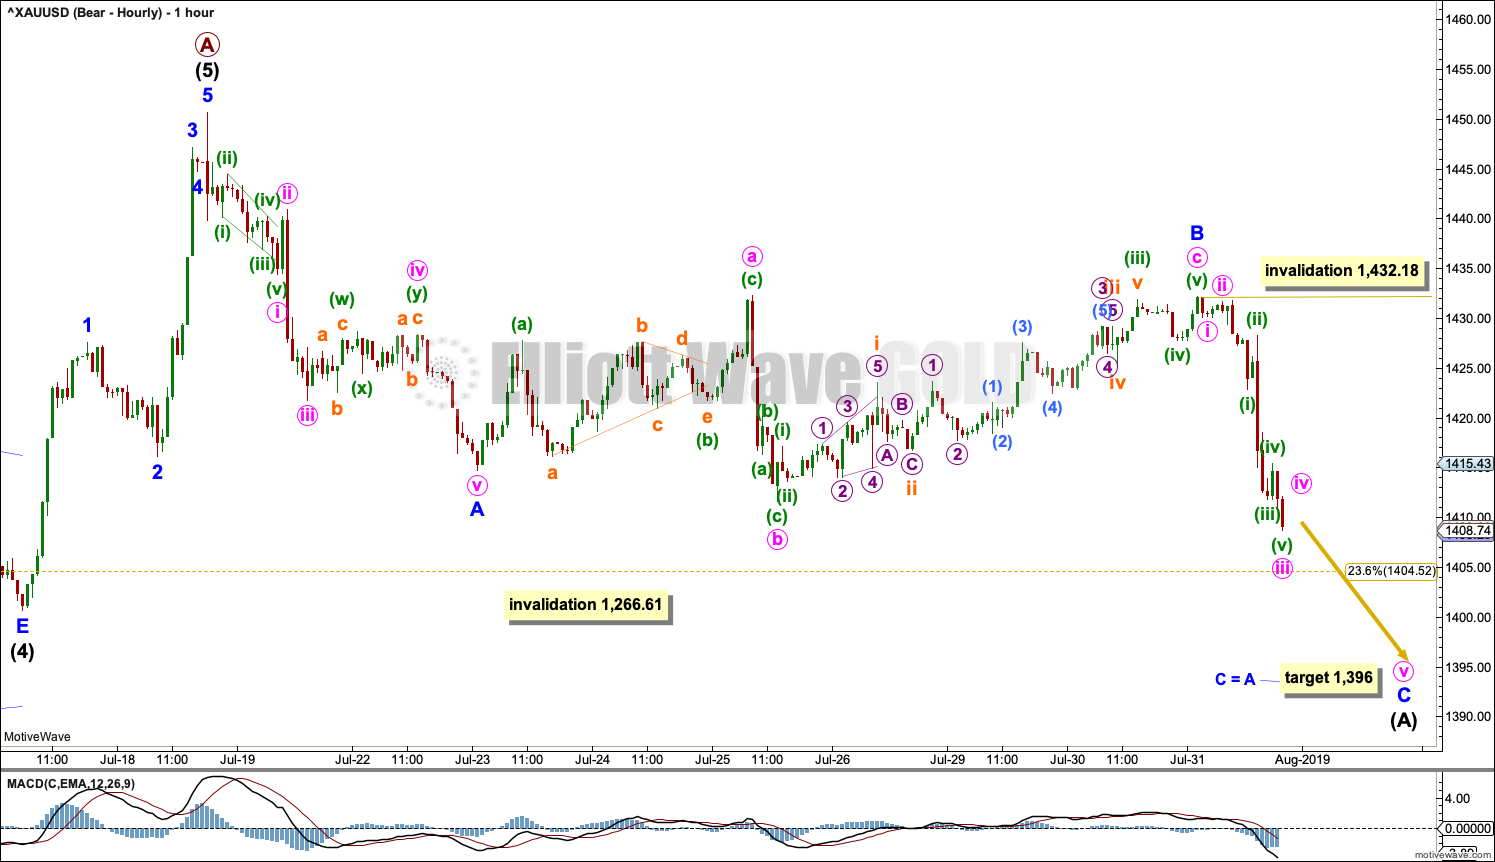
Primary wave B may be any one of more than 23 possible Elliott wave corrective structures. Intermediate wave (A) may subdivide as either a three or a five.
When A waves subdivide as threes, they most commonly do so as zigzags (which subdivide 5-3-5).
When A waves subdivide as fives, they most commonly do so as impulses (which subdivide 5-3-5-3-5).
The first 5-3-5 downwards may be unfolding. This is labelled as the start of a zigzag for intermediate wave (A), with minor wave A complete and minor wave B now a complete running flat. The truncation of minute wave c is only 0.11; it is followed by strong downwards movement. Minor wave C may now be unfolding lower.
This movement may also be labelled as a completing impulse for intermediate wave (A), with minor waves 1 and 2 complete. Minor wave 3 may now be unfolding lower.
Minor wave B may not move beyond the start of minor wave A.
A target is calculated for minor wave C to end.
SECOND HOURLY CHART
Click chart to enlarge.
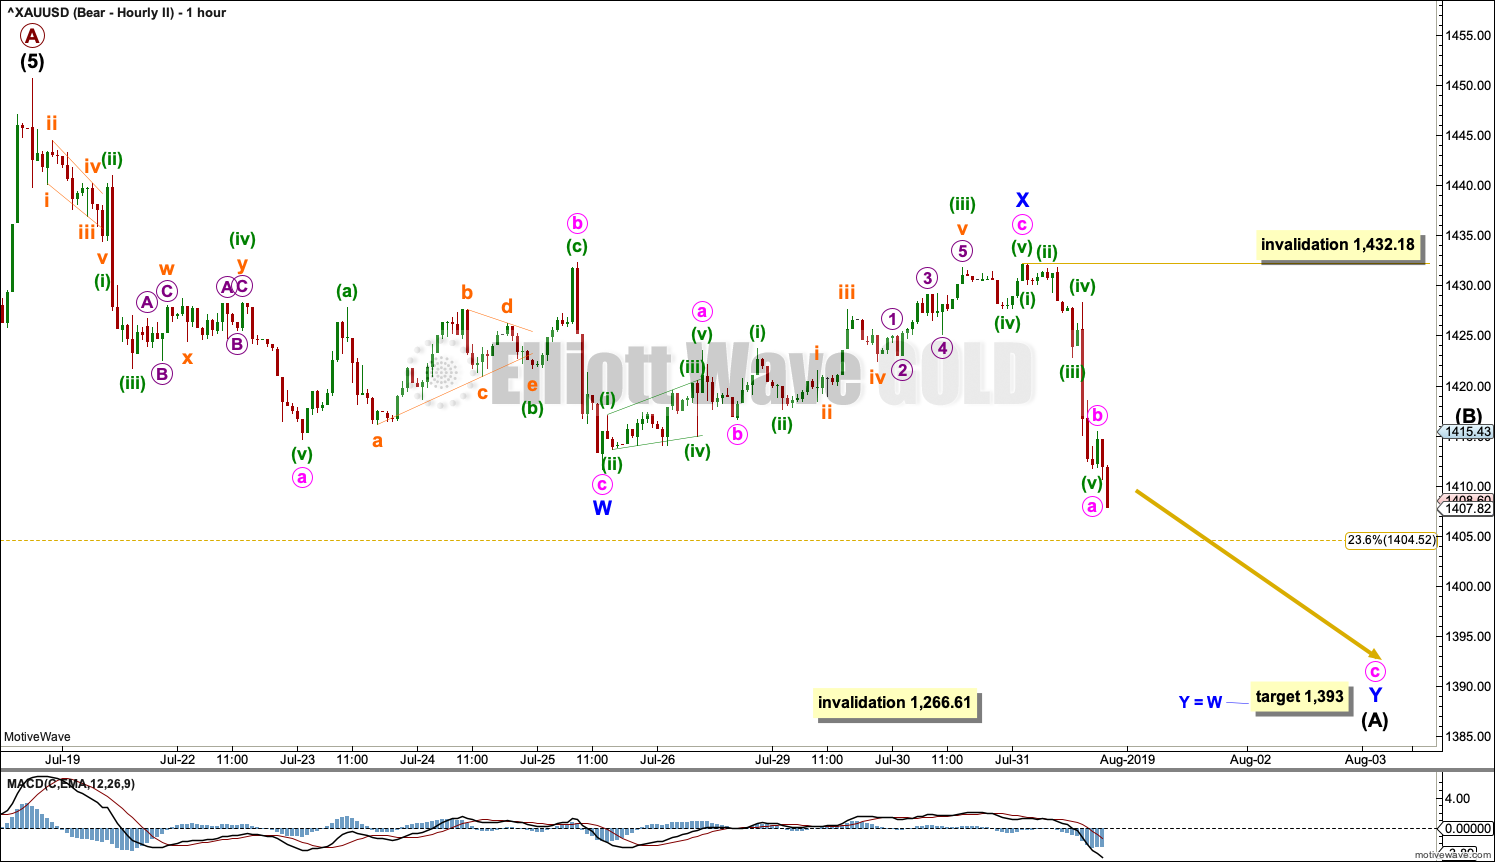
It is also possible that intermediate wave (A) is unfolding as a double zigzag.
The first zigzag in the double may be complete, labelled minor wave W.
The double may now be joined by a complete three in the opposite direction, a zigzag labelled minor wave X. This wave count avoids the truncation and rare running flat. However, the current downwards wave so far does not look like a zigzag. It looks more like a third or C wave, which fits the first hourly chart.
A target is calculated for the second zigzag to end.
ALTERNATE WEEKLY CHART
Click chart to enlarge.
This wave count is now judged to be an alternate. Small range days are not convincing as the start of a strong new downwards trend. However, this wave count remains valid.
It remains possible that a trend change at Super Cycle degree occurred on the 19th of July and a new downwards wave began there.
Double zigzags are common structures, but within them their X waves are almost always single zigzags that are relatively brief and shallow. However, this wave count sees cycle wave x as a complete double combination: zigzag – X – expanded flat.
An X wave may occasionally subdivide as a multiple. In a multiple the maximum number of corrective structures is three: W, Y and Z. To label any one of W, Y or Z as a multiple would violate the Elliott wave rule. Here, the rule is met.
Cycle wave y may be a complete zigzag. Within the zigzag, primary wave C is 5.19 short of equality in length with primary wave A.
The purpose of a second zigzag in a double zigzag is to deepen the correction when the first zigzag does not move price far enough. This purpose has been achieved.
A new low now by any amount at any time frame below 1,346.45 would invalidate the bullish wave count below and provide some confidence in a bearish wave count.
A new high by any amount at any time frame above 1,450.65 would invalidate this wave count.
ALTERNATE DAILY CHART
Click chart to enlarge.
Primary wave C may now be a complete impulse.
Gold often exhibits surprisingly short and brief fifth waves out of its fourth wave triangles, and this wave count expects that it may have done so here. This wave count follows common tendencies for this market.
Super Cycle wave (c) should move below the end of Super Cycle wave (a) at 1,046.27 to avoid a truncation. Super Cycle wave (c) may only subdivide as a five wave structure, most likely an impulse. Within Super Cycle wave (c), no second wave correction may move beyond the start of its first wave above 1,450.65.
BULLISH ELLIOTT WAVE COUNT
WEEKLY CHART
Click chart to enlarge.
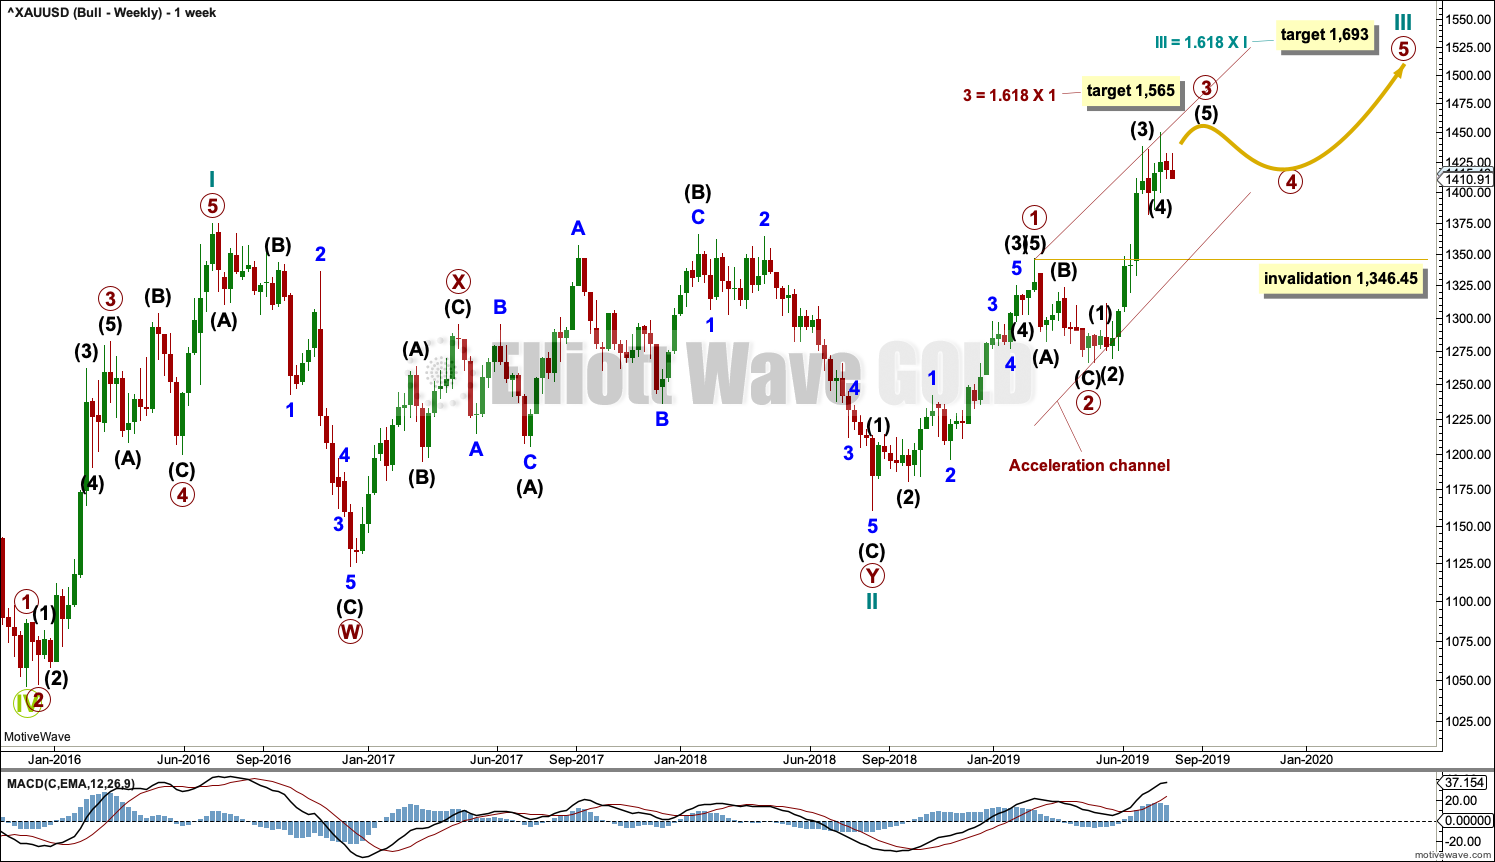
This wave count sees the the bear market complete at the last major low for Gold in November 2015.
If Gold is in a new bull market, then it should begin with a five wave structure upwards on the weekly chart. However, the biggest problem with this wave count is the structure labelled cycle wave I because this wave count must see it as a five wave structure, but it looks more like a three wave structure.
Commodities often exhibit swift strong fifth waves that force the fourth wave corrections coming just prior and just after to be more brief and shallow than their counterpart second waves. It is unusual for a commodity to exhibit a quick second wave and a more time consuming fourth wave, and this is how cycle wave I is labelled. This wave count still suffers from this very substantial problem, and for this reason bearish wave counts are still considered above as they have a better fit in terms of Elliott wave structure.
Cycle wave II subdivides well as a double combination: zigzag – X – expanded flat.
Cycle wave III may have begun. Within cycle wave III, primary waves 1 and 2 may now be complete. If it continues lower as a double zigzag, then primary wave 2 may not move beyond the start of primary wave 1 below 1,160.75.
Cycle wave III so far for this wave count would have been underway now for 50 weeks. It may be beginning to exhibit some support from volume and increasing ATR. If this increase continues, then this wave count would have some support from technical analysis.
Draw an acceleration channel about primary waves 1 and 2: draw the first trend line from the end of primary wave 1 to the last high, then place a parallel copy on the last high. Keep redrawing the channel as price continues higher. When primary wave 3 is complete, then this channel would be drawn using Elliott’s first technique about the impulse. The lower edge may provide support.
Primary wave 4 may not move into primary wave 1 price territory below 1,346.45. Because the data used for this analysis is cash market data no overlap between primary waves 4 and 1 should be allowed. The invalidation point is absolute.
DAILY CHART

Click chart to enlarge.
Primary wave 3 may only subdivide as an impulse. Within the impulse, intermediate waves (1) through to (4) are all now complete. It is possible that intermediate wave (5) could be over at the last high, but for this wave count it would look more normal if it continued higher.
When it arrives, then primary wave 4 may not move into primary wave 1 price territory below 1,346.45.
On the hourly chart, extend the trend lines from the triangle of intermediate wave (4) out to the right. The upper B-D trend line may be providing support.
HOURLY CHART
Click chart to enlarge.
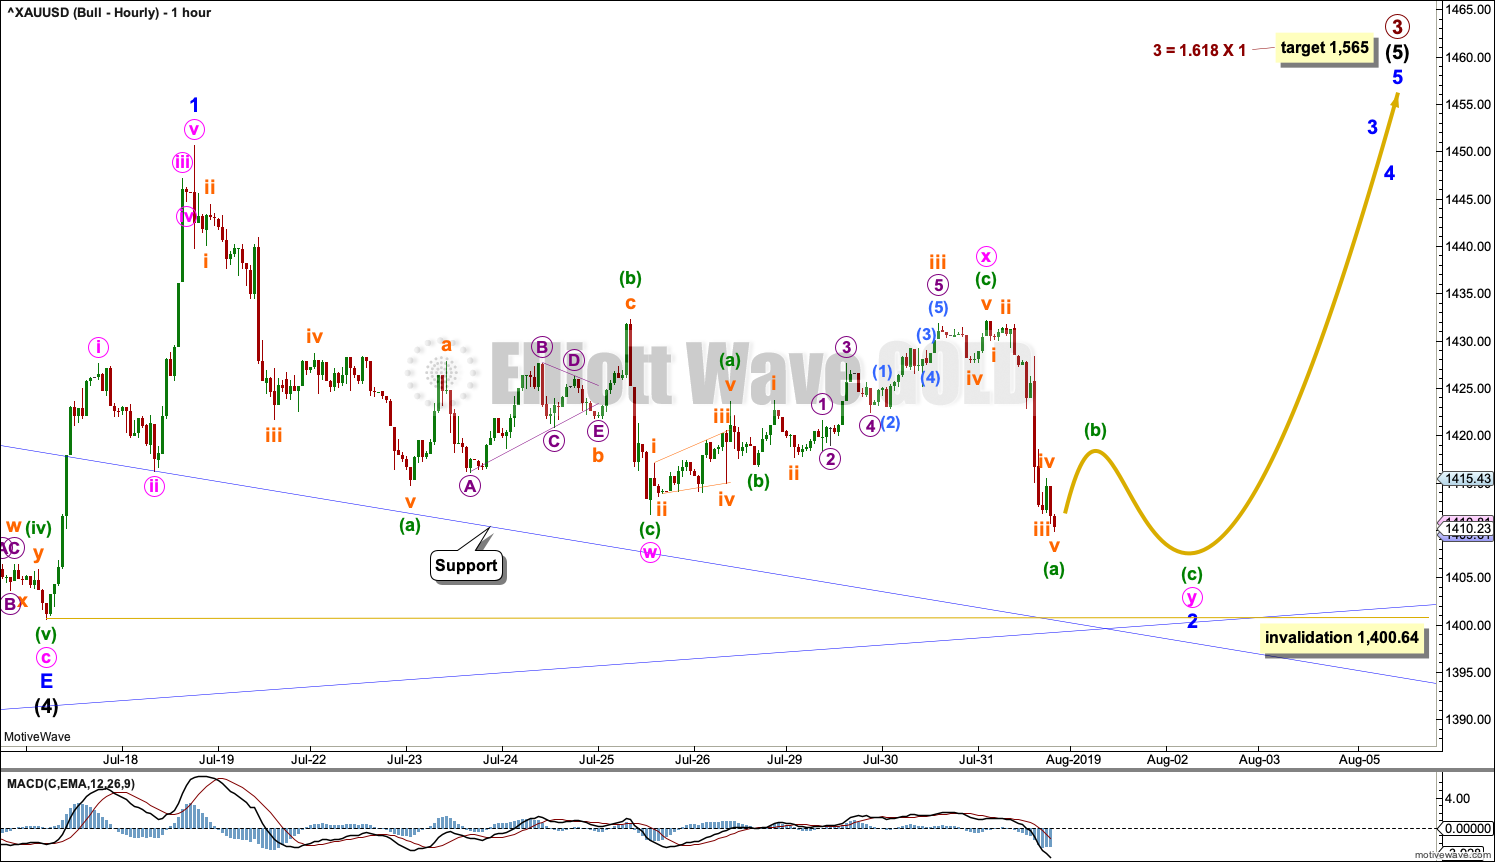
Intermediate wave (5) may only subdivide as a five wave structure, either an impulse or an ending diagonal. Fifth waves to end third waves one degree higher, as this one is, almost always subdivide as impulses (that is what shall be expected).
Within intermediate wave (5), minor wave 1 may be complete.
Minor wave 2 may not move beyond the start of minor wave 1 below 1,400.64. Minor wave 2 may be an incomplete double zigzag.
If this wave count is invalidated at the hourly chart level, it would indicate that primary wave 3 should be labelled as complete at the last high. At that stage, it would be expected that primary wave 4 should be underway and the invalidation point at 1,346.45 would apply.
The triangle trend lines from the triangle of intermediate wave (4) are extended. The point in time at which they cross over may see a trend change. This is coming up soon; be prepared for this possibility.
TECHNICAL ANALYSIS
MONTHLY CHART
Click chart to enlarge. Chart courtesy of StockCharts.com.
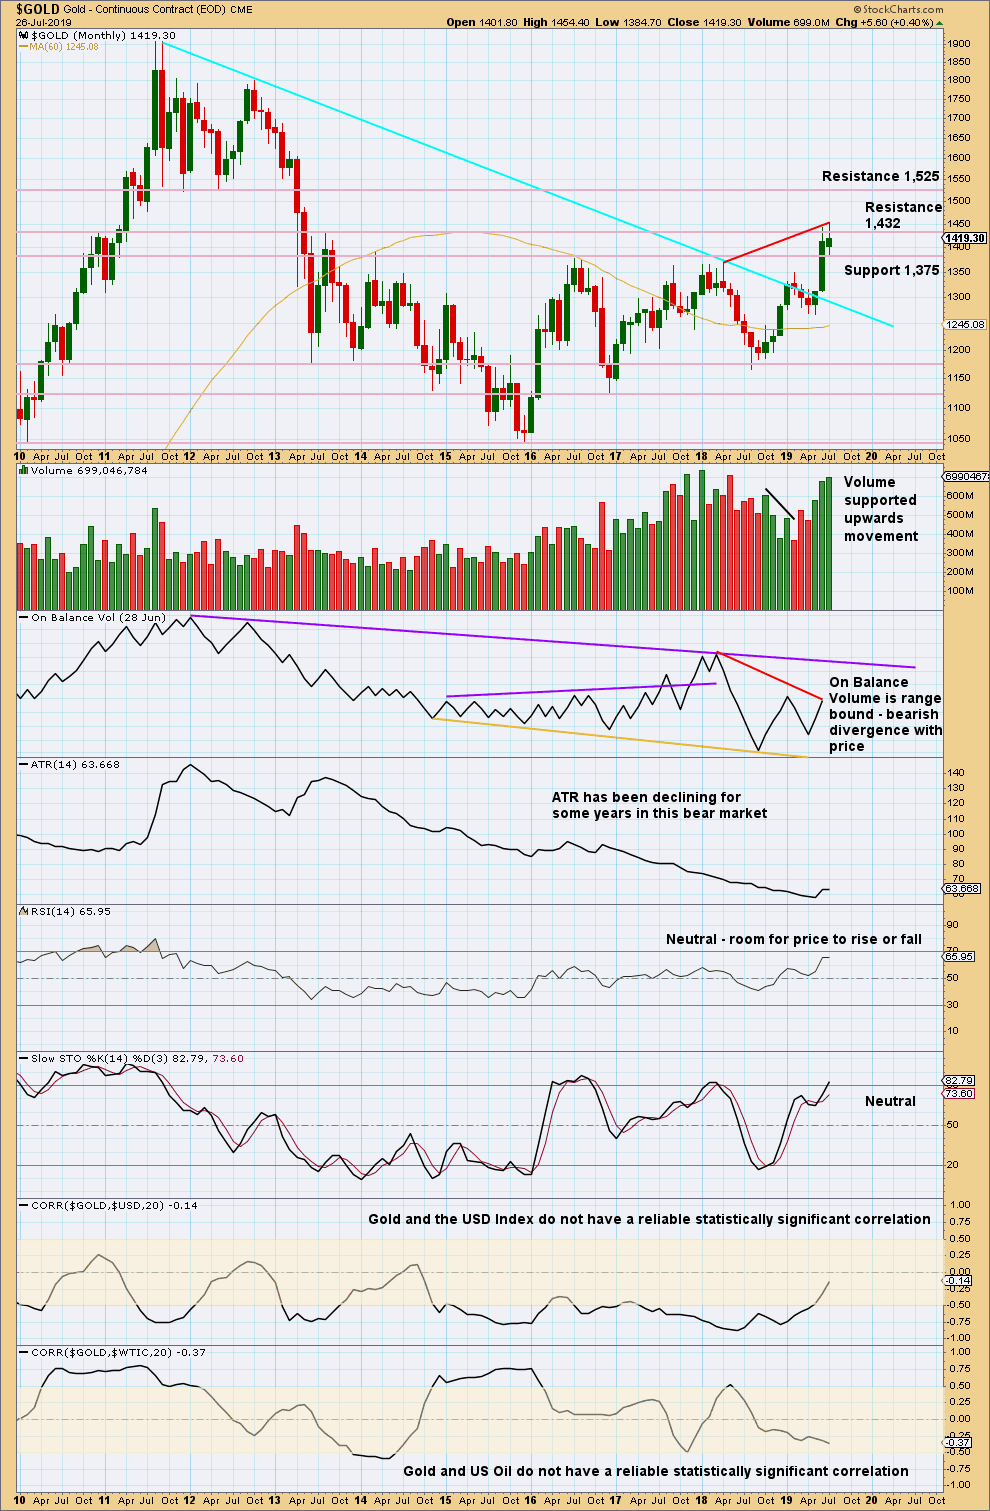
Gold has effected an upwards breakout above multi-year resistance and above the cyan bear market trend line. Look for next resistance identified on the chart.
The new high in price above prior highs for March / April 2018 have not been matched by new highs for On Balance Volume. This divergence is bearish and supports a bearish Elliott wave count. This divergence may be given a little weight because it is strong and evident on the monthly chart.
WEEKLY CHART
Click chart to enlarge. Chart courtesy of StockCharts.com.
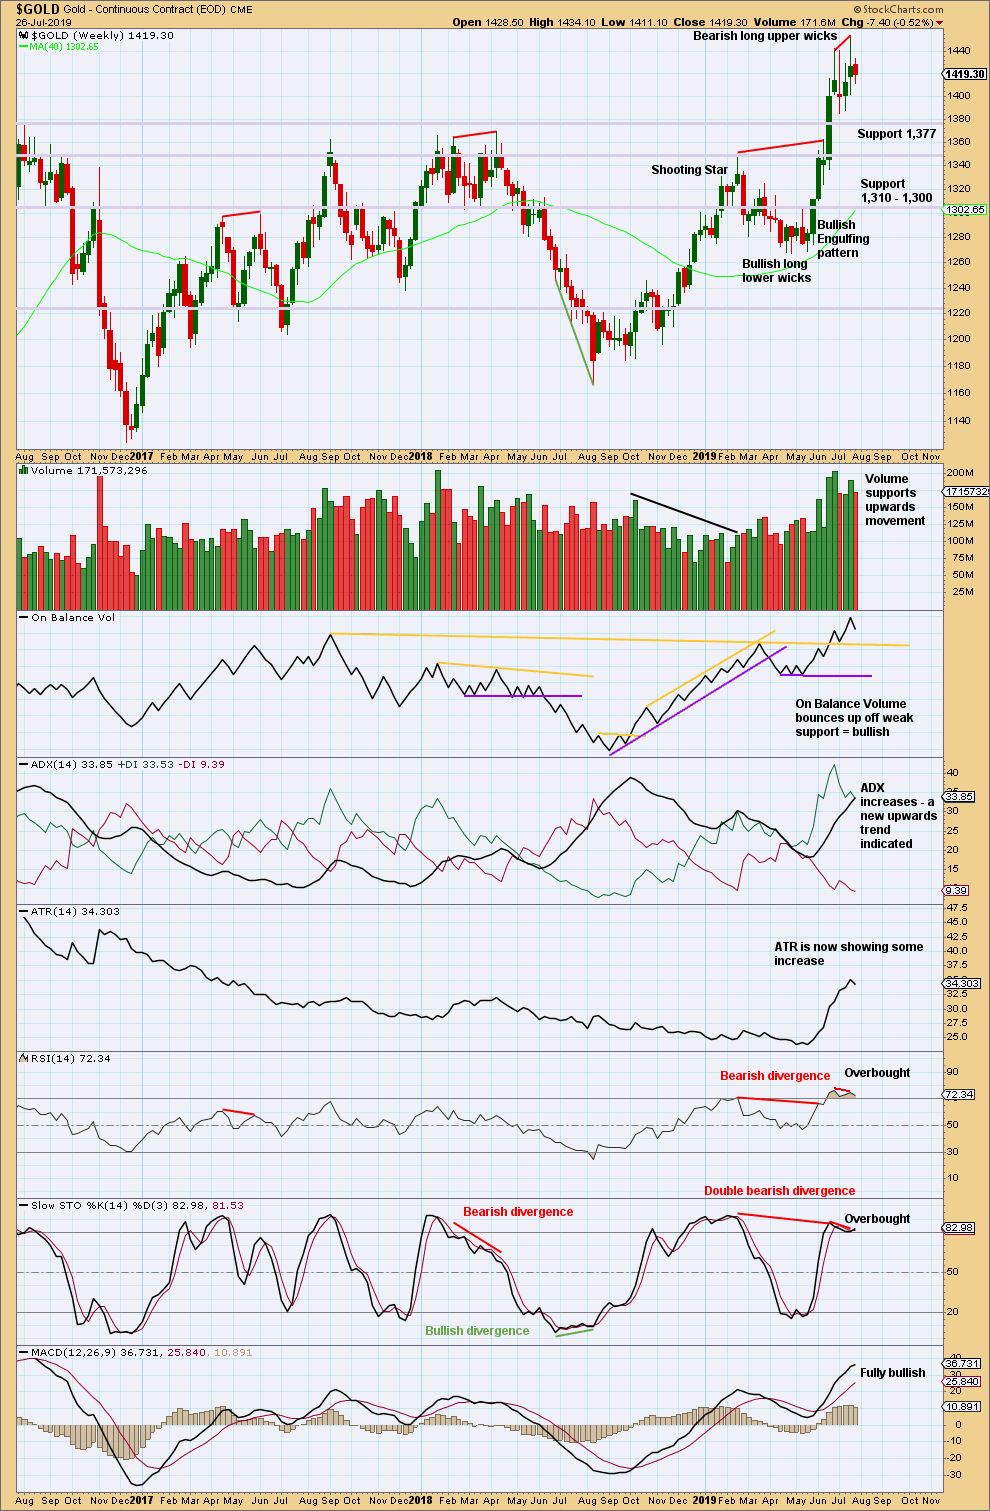
A new high two weeks ago exhibits some bearish divergence between price and RSI. However, as has been seen recently, sometimes this divergence simply disappears.
The bottom line remains that a multi year breakout occurred a few weeks ago, and it occurred with strength in volume. While price remains above support about 1,377 and ADX indicates an upwards trend, this chart will remain overall bullish.
DAILY CHART
Click chart to enlarge. Chart courtesy of StockCharts.com.
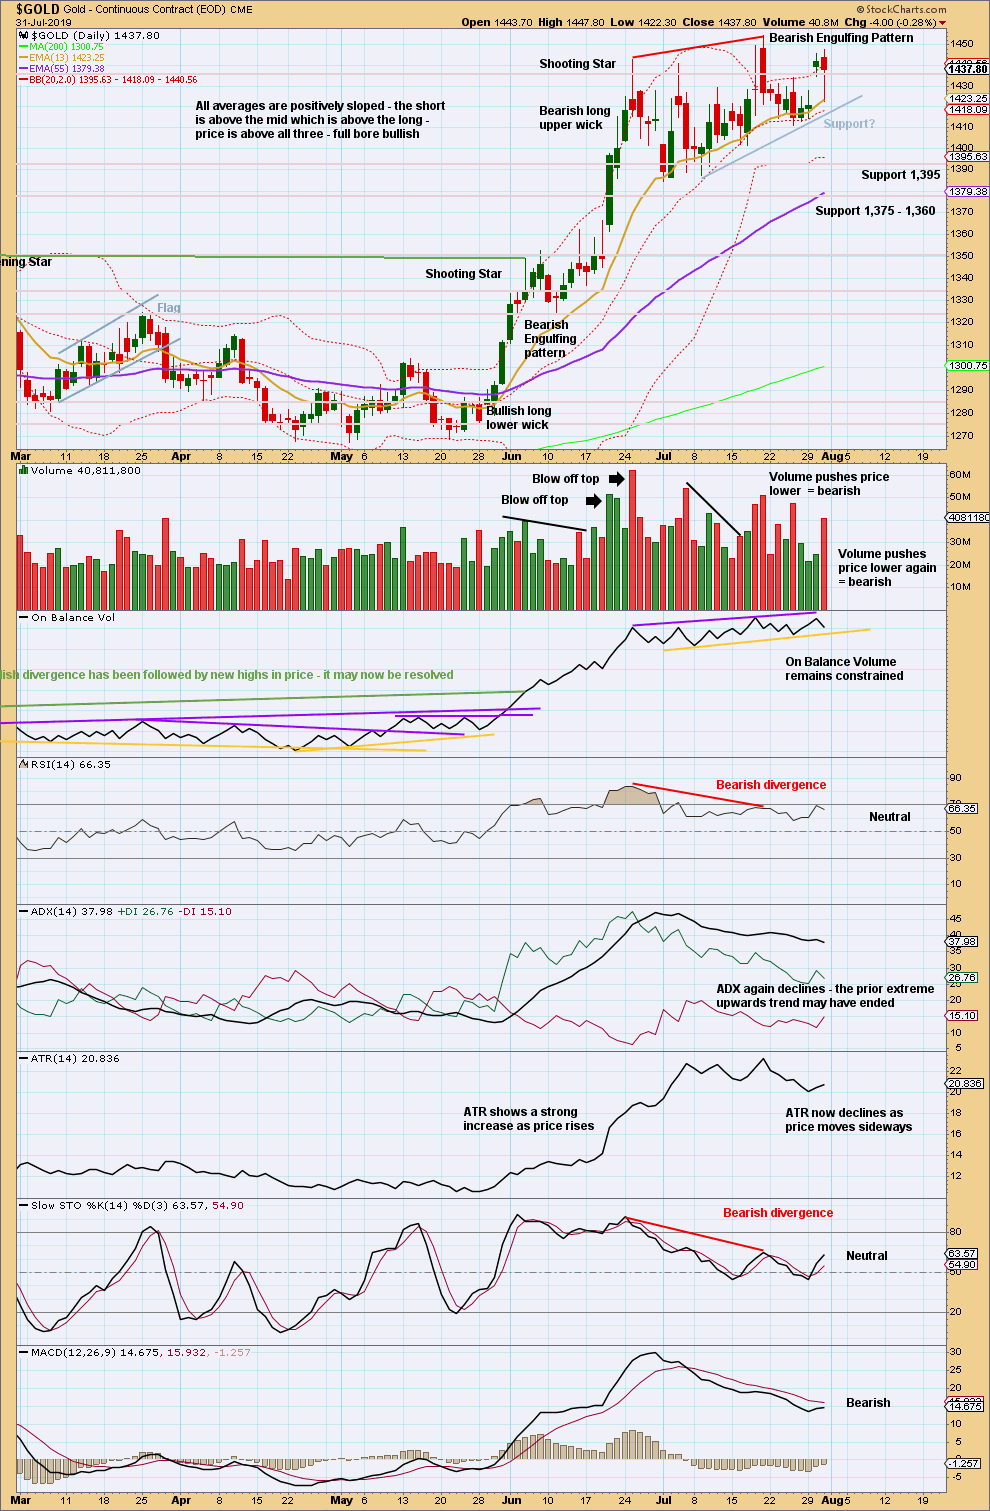
Price is now range bound with resistance about 1,455 and support about 1,395. There is very strong support below this about 1,375.
The last gap was a pattern or common gap, which is now closed. This is normal.
The short-term volume profile is bearish. Look for support to again be tested.
Extreme conditions for ADX have not yet been relieved. The ADX line remains above both directional lines and still close to 40.
RSI is now back in neutral territory.
Another week or so of consolidation or pullback may be required to complete before the larger upwards trend is ready to resume.
GDX WEEKLY CHART
Click chart to enlarge. Chart courtesy of StockCharts.com.
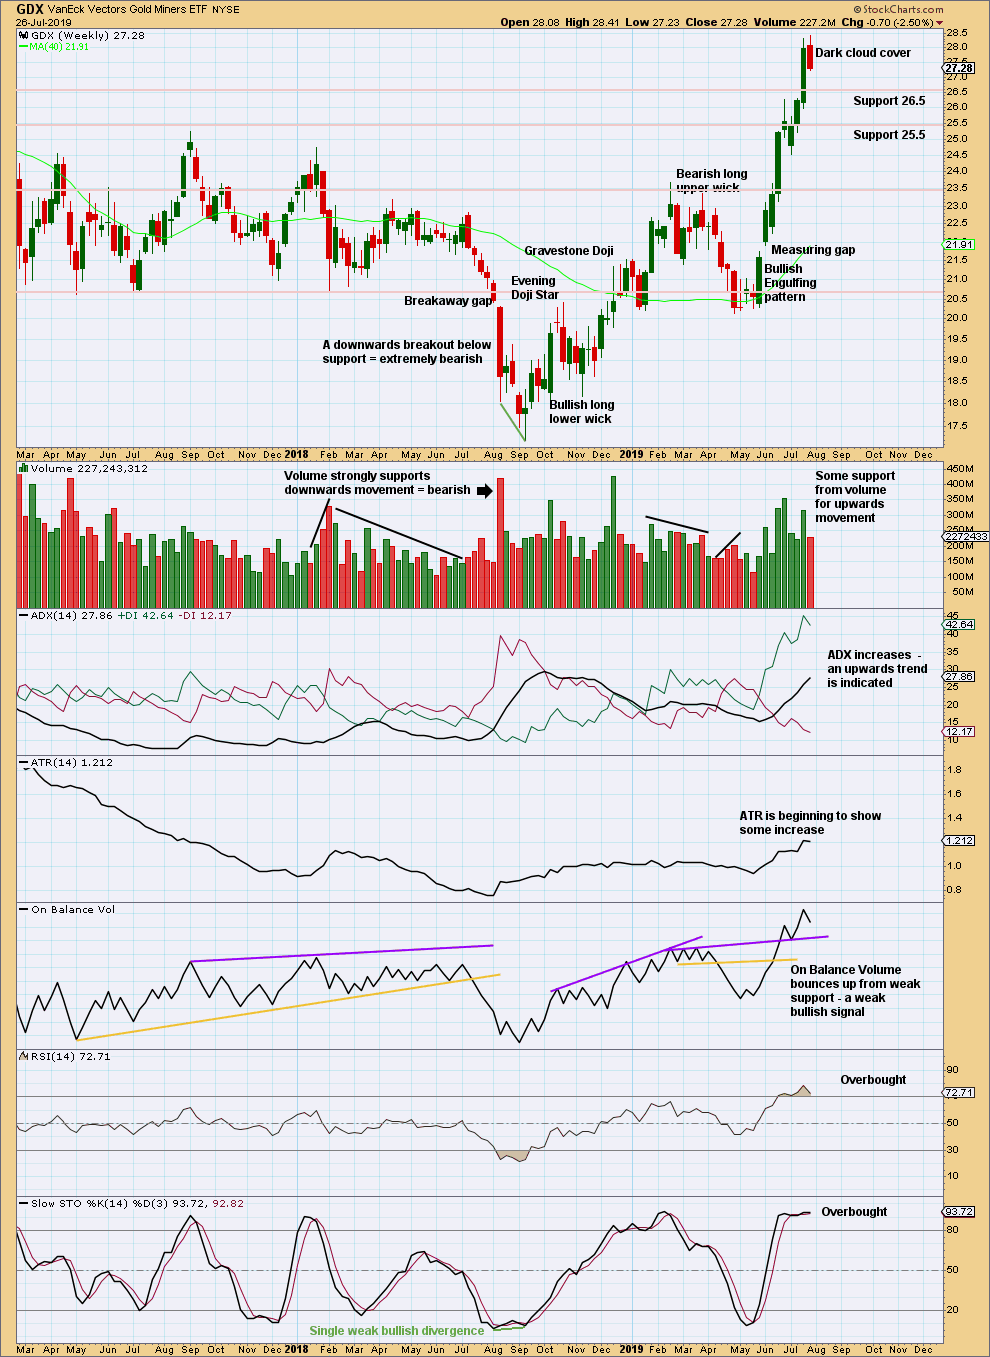
The bearish candlestick reversal pattern last week indicates a potential trend change.
Candlestick reversal patterns make no comment on the direction of the new trend (a full 180 degree reversal or sideways) nor for how long it may last. This reversal pattern may indicate a consolidation to unfold here, or it may indicate a new downwards trend.
Strength or weakness in the next one to very few weeks may indicate which scenario may be preferred.
GDX DAILY CHART
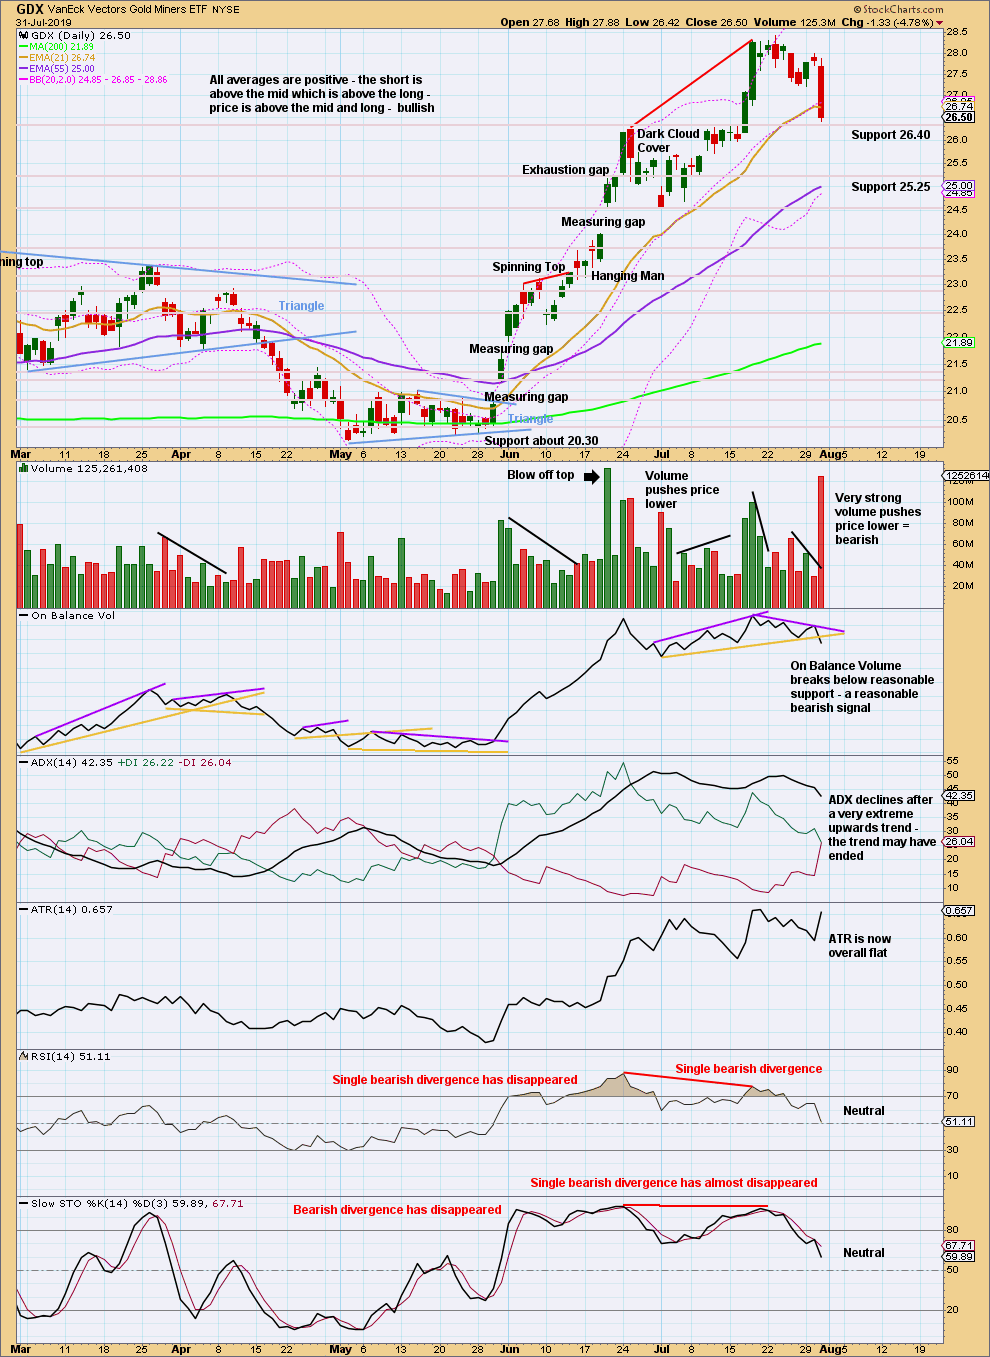
Click chart to enlarge. Chart courtesy of StockCharts.com.
Today a very strong downwards day, which has strong support from volume, and a bearish signal from On Balance Volume indicate the possibility of a trend change may now be seriously considered.
A new swing low below 24.53 would confirm a trend change.
Published @ 09:08 p.m. EST.
—
Careful risk management protects your trading account(s).
Follow my two Golden Rules:
1. Always trade with stops.
2. Risk only 1-5% of equity on any one trade.
—
New updates to this analysis are in bold.
The bottom line right now though folks is that price is still range bound.
Lets see what volume and indicators have to say today about the strength of this upwards move.
It’s great to see some interaction here in comments on Elliott Wave Gold.
For newer members, I’m here to help you learn Elliot Wave. Feel free to email me your wave counts for feedback, or post them here in comments.
My email is admin@elliottwavegold.com
Hourly bullish chart updated:
Minor 2 should now be over. This upward movement today sure does look like the start of a third wave.
Minor 2 managed to end just prior to the invalidation point. It’s a very deep correction, but it did not move beyond the start of minor 1. This wave count is valid.
Because minor 2 is so very deep the Fibonacci ratio applied to the target for minor 3 is 2.618.
Hourly bear chart updated:
A zigzag down may now be complete, this is so far labelled intermediate (A) of primary B.
Upwards movement today could be intermediate (B) as a quick sharp zigzag, but this wave count needs support from classic TA to make sense.
B waves should exhibit weakness. This move does not look weak. When Stockcharts volume data is finalised (usually about 6:30pm EST, prior to that I’ve noticed it sometimes changes retrospectively) then I can make a judgement for this wave count.
I’m a bit confused. The hourly bull chart showed an invalidation at 1400.61. Not sure if that was hit and the significance if so. Rally looks impressive.
Could be the end of intermediate wave A for bear count…but this certainly doesn’t look like the start of a corrective B wave! Totally possible though as it could make a new high.
Thanks that’s a help. I share your sentiments about the
DJI.
It wasn’t with Barchart data. You can find their data for XAU-USD on their website I think.
The low today for Barchart data was 1,401.30.
The rule applied here is wave 2 may not move beyond the start of wave 1. That means that wave 2 can be a full 100% correction of wave 1, the count would remain valid. In this instance wave 2 could reach exactly 1,400.64 and the count would have been valid.
But wave 2 may not move BEYOND the start of wave 1. Any new low by any amount at any time frame below 1,400.64 would have invalidated the count.
I hope that makes it really clear. This approach is the same for all my invalidation points (with the sole exception being D waves of barrier triangles).
I believe stocks are poised to fall rapidly from here. I’m charting a ending contracting diagonal (I’m using the DJI), where we might have just entered the 4th wave down…approximately 1750 points. That portends one more new high sometime around October.
I’ve closed my long gold position from 1401 (nearly bottom ticked it).
Only positions now are short crude and short dow futures.
I wanted to mention that the Yen vs. USD has perked up…this to me signals risk off coming.
Hrly Bull invalidated.
Love that Lara has provided forethought :
“If this wave count is invalidated at the hourly chart level, it would indicate that primary wave 3 should be labelled as complete at the last high. At that stage, it would be expected that primary wave 4 should be underway and the invalidation point at 1,346.45 would apply.”
I could have actually done better than that. After a new low post publication for minor 2, it could have been over. The structure was complete.
If price then turned and exhibited strength in upwards movement that could be the start of minor wave 3. It sure does look like that today, so far.
On the other hand, the third wave down was overlapping, which shouldn’t happen ?
This is how I’m counting the middle of the third wave down for the bullish count. This is the 5 minute chart.
Thank you, that expanding flat for circle 2 did the trick, i didn’t see.
Hi Lara, on both of my platforms there was a spike at your first (2) avoiding the truncation. Regards
Mine too – for Dec Gold and Cash both spiked and then fell sharply. No truncation.
Great.
For Barchart data the truncation is there, but I’m going to accept it. It’s small, it’s not seen with all data feeds, so others avoid it. Also, it comes just before a very strong downwards move, that’s exactly the conditions in which truncations may occur.