
Price remains below resistance and above support. This week the trend reaches extreme and conditions are overbought. All three Elliott wave counts remain the same.
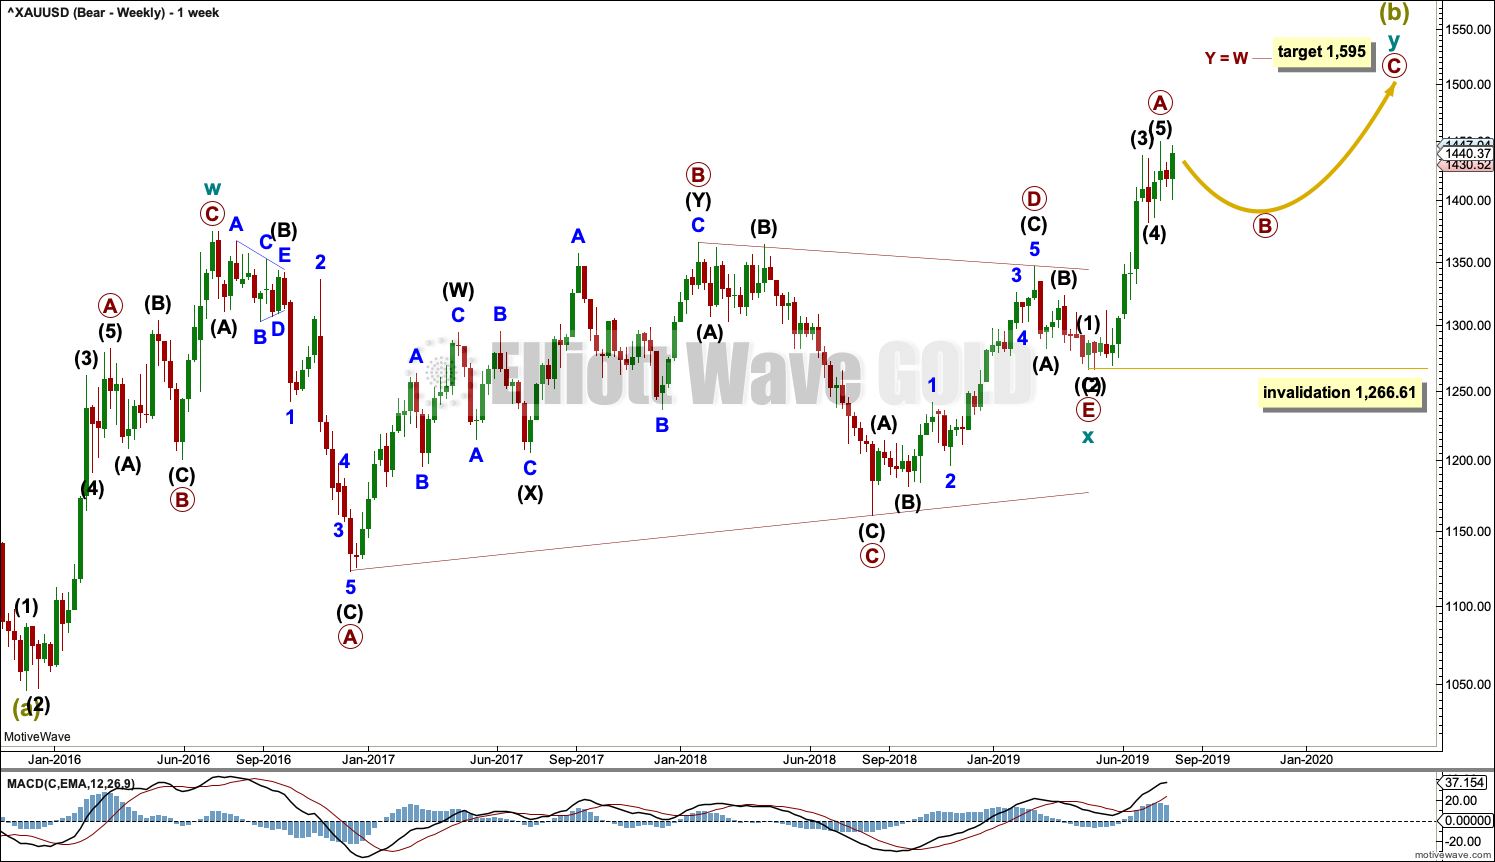
Summary: There remains an upwards trend in place at the weekly chart level. With conditions extreme, a sideways consolidation may continue next week and possibly for another few weeks to relieve extreme conditions. This scenario favours the main bearish wave count. The final target for that count is 1,595. There is strong support below about 1,375.
The bullish Elliott wave count remains valid while price remans above 1,346.45. The mid-term target is 1,565.
Grand SuperCycle analysis is here.
Monthly charts were last published here with video here.
BEARISH ELLIOTT WAVE COUNTS
MAIN WEEKLY CHART
Click chart to enlarge.
It remains possible that Super Cycle wave (b) is an incomplete double zigzag.
The first zigzag in the double is seen in the same way for both bearish wave counts, a zigzag labelled cycle wave w.
This main bearish wave count sees cycle wave x as regular contracting triangle. Cycle wave y must subdivide as a zigzag if Super Cycle wave (b) is a double zigzag. Within cycle wave y, primary wave A may now be complete, and primary wave B may not move beyond the start of primary wave A below 1,266.61.
Primary wave B may continue further for a few more weeks to relieve extreme conditions and complete a corrective Elliott wave structure.
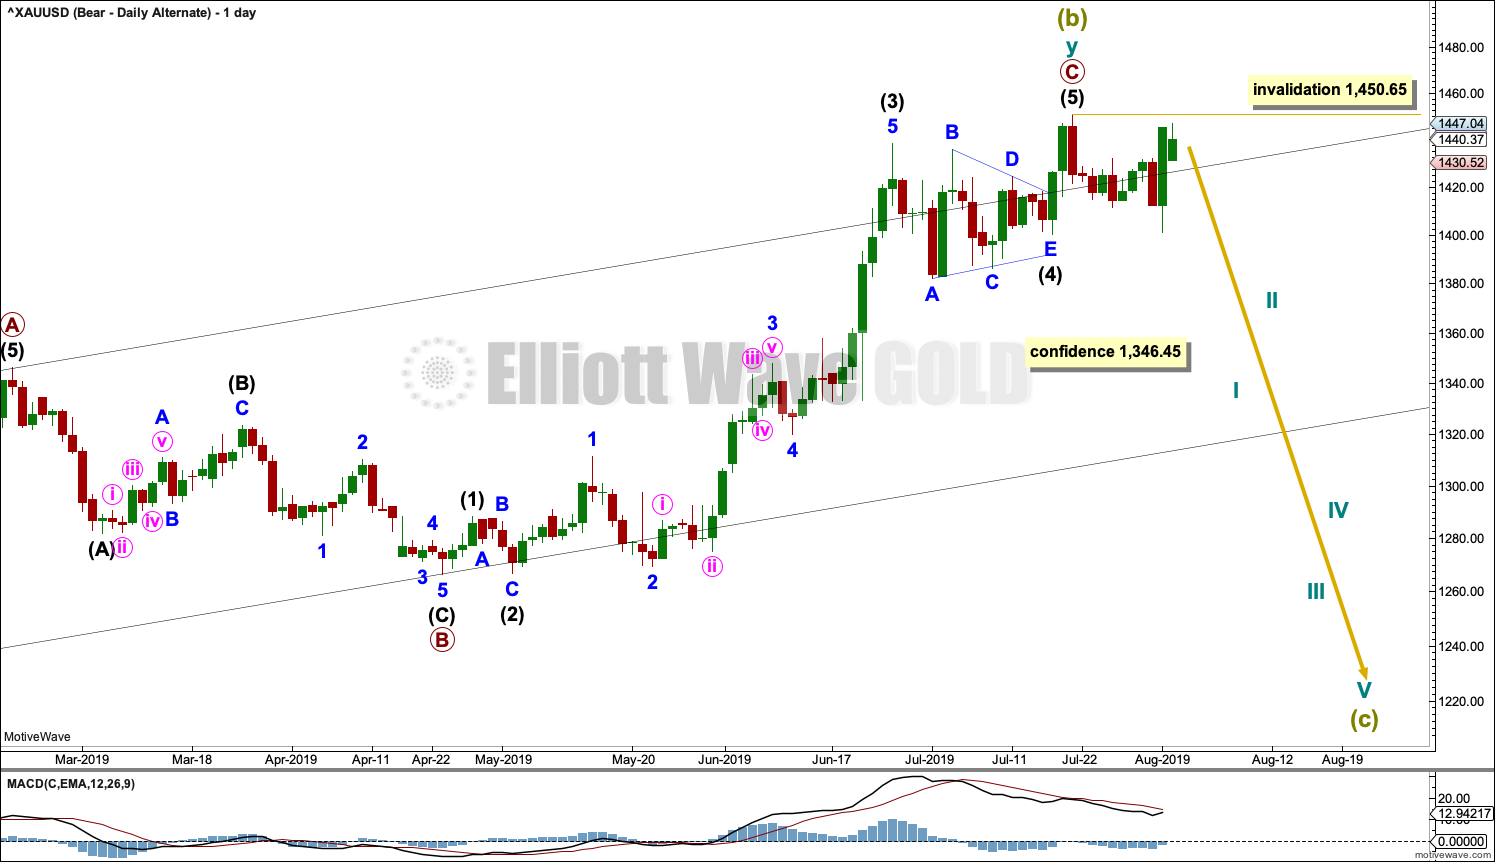
MAIN DAILY CHART
Click chart to enlarge.
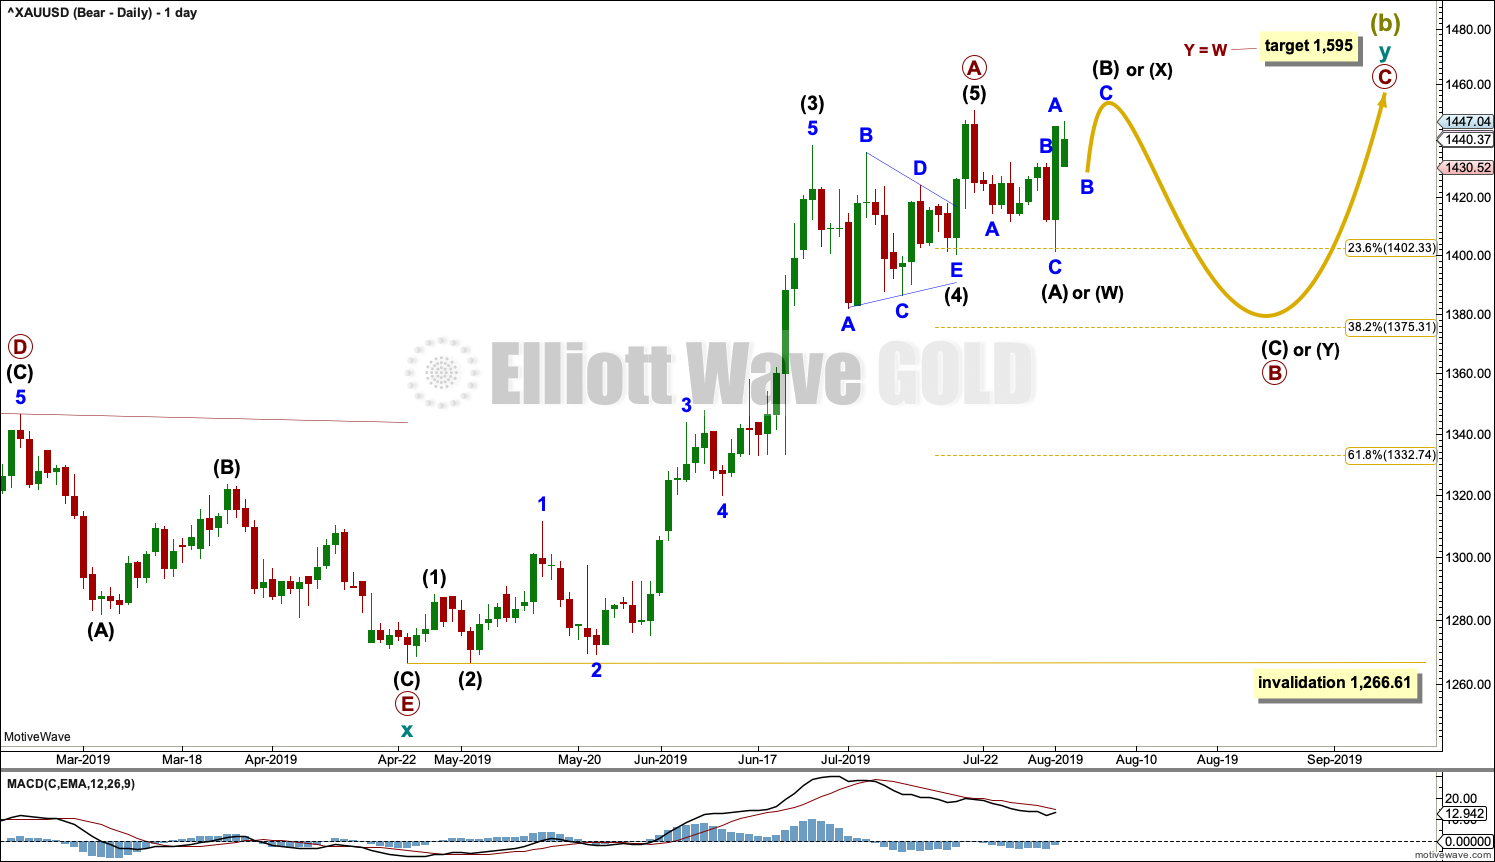
Within cycle wave y, primary wave A may now be a complete five wave impulse.
Primary wave B may unfold over a few weeks. Primary wave B may subdivide as any one of more than 23 possible corrective Elliott wave structures. At this stage, it may be a time consuming sideways consolidation as a combination, flat or triangle.
Primary wave B should exhibit weakness.
Primary wave B may end about either the 0.382 or 0.618 Fibonacci Ratios. It may be relatively shallow if it finds support about 1,375, so the 0.382 Fibonacci ratio may be favoured as a target.
If primary wave B subdivides as any one of an expanded flat, running triangle or combination, then it may include a new high above its start at 1,450.65. A new high above this point does not invalidate this wave count at the daily chart level.
Within primary wave B, intermediate wave (B) may be relatively time consuming and when complete should look like a three on the daily chart.
HOURLY CHART
Click chart to enlarge.
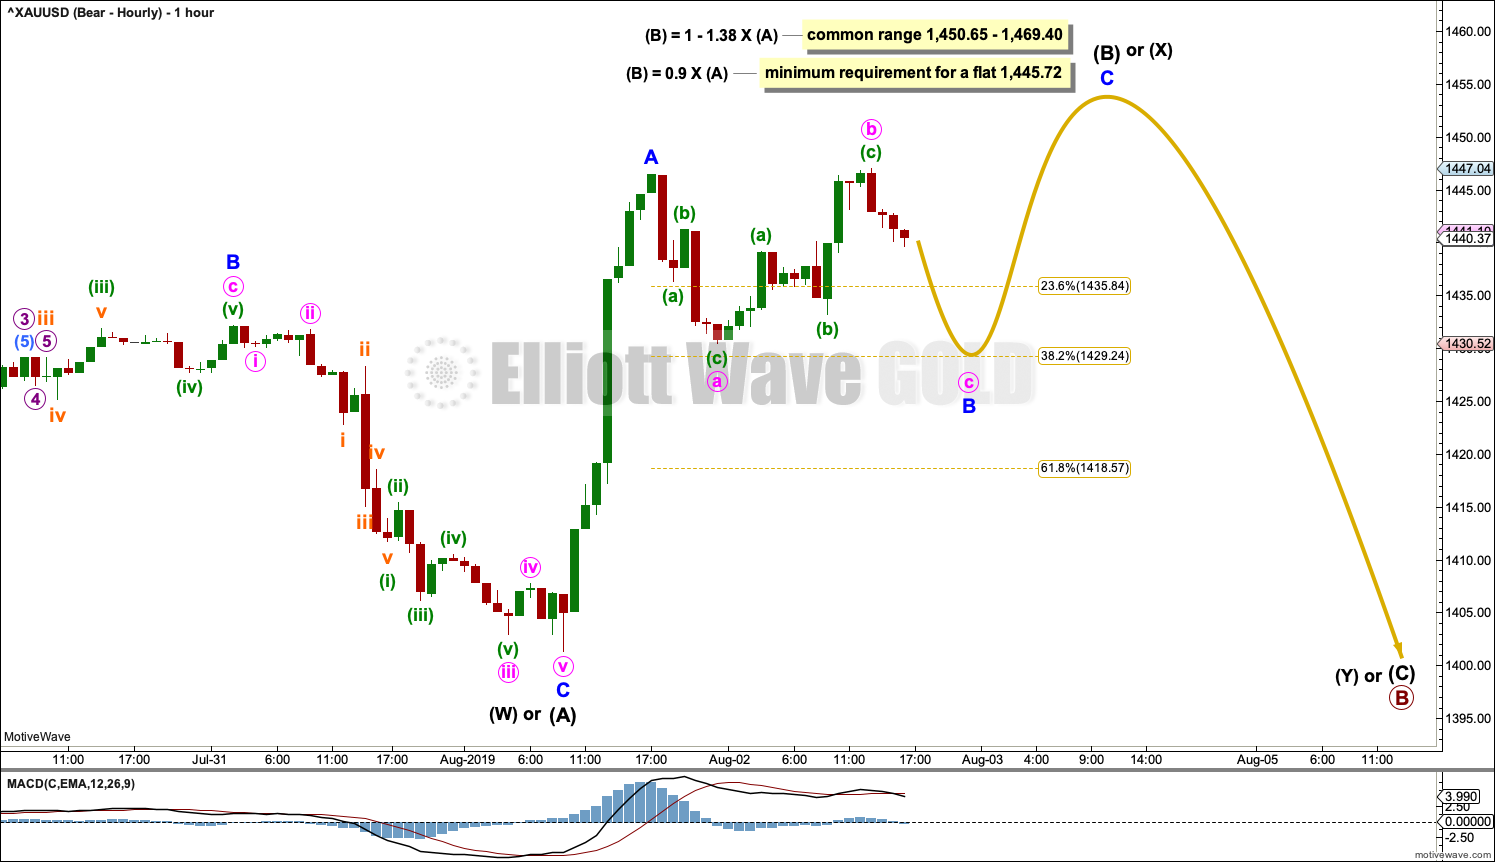
If primary wave B is subdividing as a flat correction, then within it intermediate wave (A) may now be a complete three. Intermediate wave (B) must now move higher as a three; at this stage, it looks like it may be unfolding as a zigzag. Intermediate wave (B) of a flat correction must retrace a minimum 0.9 length of intermediate wave (A). This minimum was met at the high of minor wave A within intermediate wave (B). The most common type of flat is an expanding flat, which would require intermediate wave (B) to move beyond the start of intermediate wave (A) in order for it to reach a 1.05 length of intermediate wave (A) at 1,453.12 or above.
If primary wave B is subdividing as a triangle, then within it intermediate wave (A) may now be a complete zigzag. Intermediate wave (B) may move beyond the start of intermediate wave (A) above 1,450.65 as in a running triangle. Thereafter, a triangle would see sideways movement in an ever decreasing range for another one to very few weeks.
If primary wave B is subdividing as a double combination, then the first structure in the double may now be complete as a zigzag labelled intermediate wave (W). The double would then be joined by a three in the opposite direction, most likely a zigzag that may be incomplete and would be labelled intermediate wave (X). X waves within combinations are usually very deep and may make new price extremes beyond the start of wave W or Y. Thereafter, the second structure in a possible double combination may begin and move price sideways over another few weeks as a flat correction or a triangle labelled intermediate wave (Y).
At this stage, primary wave B looks unlikely to be subdividing as a double zigzag because here this correction is unfolding sideways (double zigzag X waves are usually shallow and have a strong slope).
ALTERNATE WEEKLY CHART
Click chart to enlarge.
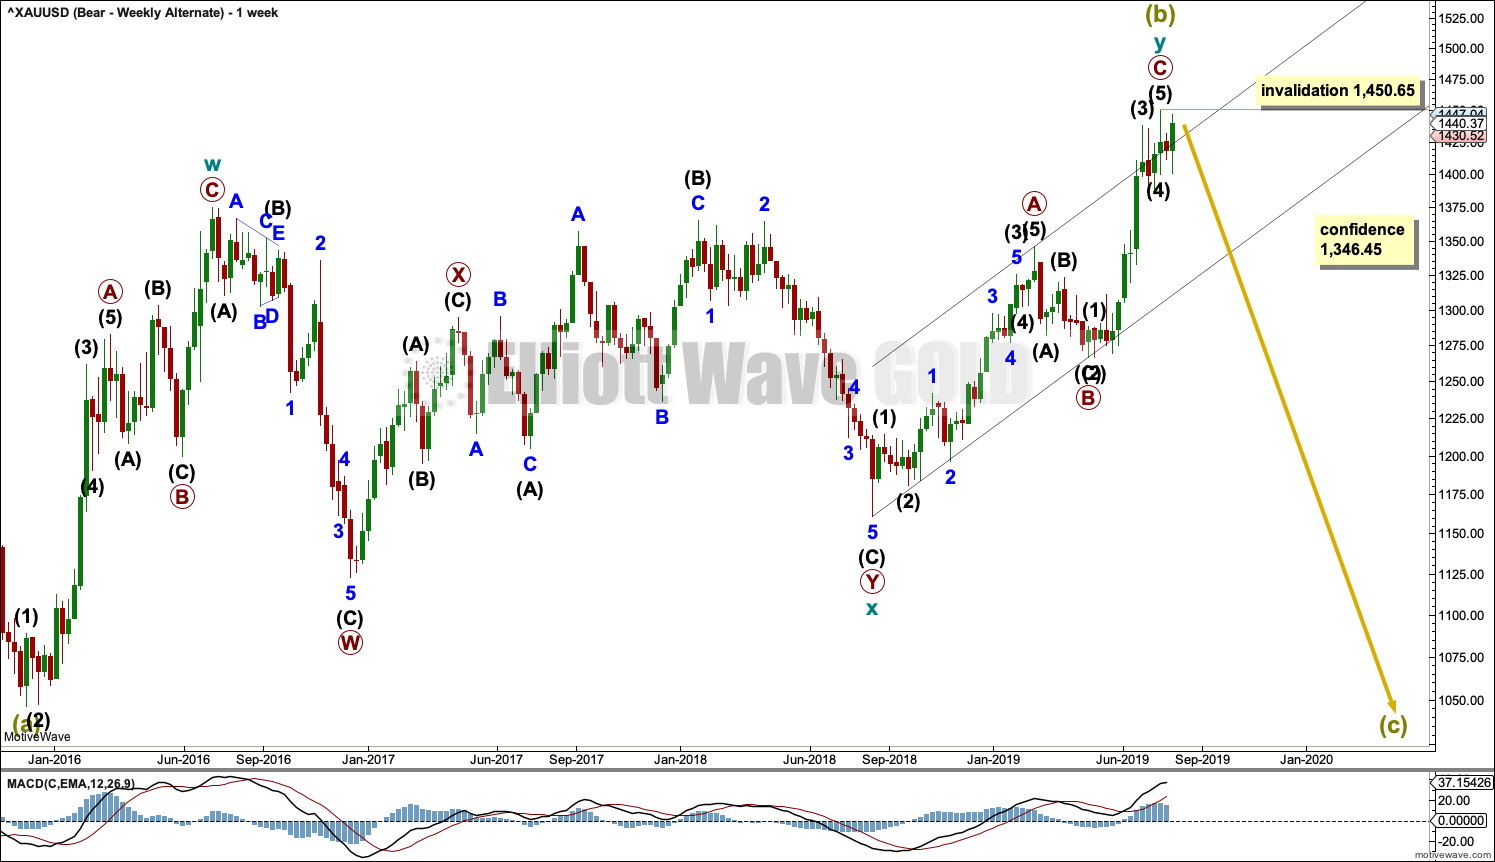
This wave count is now judged to be an alternate. With Barchart data not making a new high this week, this wave count remains valid.
It remains possible that a trend change at Super Cycle degree occurred on the 19th of July and a new downwards wave began there.
Double zigzags are common structures, but within them their X waves are almost always single zigzags that are relatively brief and shallow. However, this wave count sees cycle wave x as a complete double combination: zigzag – X – expanded flat.
An X wave may occasionally subdivide as a multiple. In a multiple the maximum number of corrective structures is three: W, Y and Z. To label any one of W, Y or Z as a multiple would violate the Elliott wave rule. Here, the rule is met.
Cycle wave y may be a complete zigzag. Within the zigzag, primary wave C is 5.19 short of equality in length with primary wave A.
The purpose of a second zigzag in a double zigzag is to deepen the correction when the first zigzag does not move price far enough. This purpose has been achieved.
A new low now by any amount at any time frame below 1,346.45 would invalidate the bullish wave count below and provide some confidence in a bearish wave count.
A new high by any amount at any time frame above 1,450.65 would invalidate this wave count.
ALTERNATE DAILY CHART
Click chart to enlarge.
Primary wave C may now be a complete impulse.
Gold often exhibits surprisingly short and brief fifth waves out of its fourth wave triangles, and this wave count expects that it may have done so here. This wave count follows common tendencies for this market.
Super Cycle wave (c) should move below the end of Super Cycle wave (a) at 1,046.27 to avoid a truncation. Super Cycle wave (c) may only subdivide as a five wave structure, most likely an impulse. Within Super Cycle wave (c), no second wave correction may move beyond the start of its first wave above 1,450.65.
BULLISH ELLIOTT WAVE COUNT
WEEKLY CHART
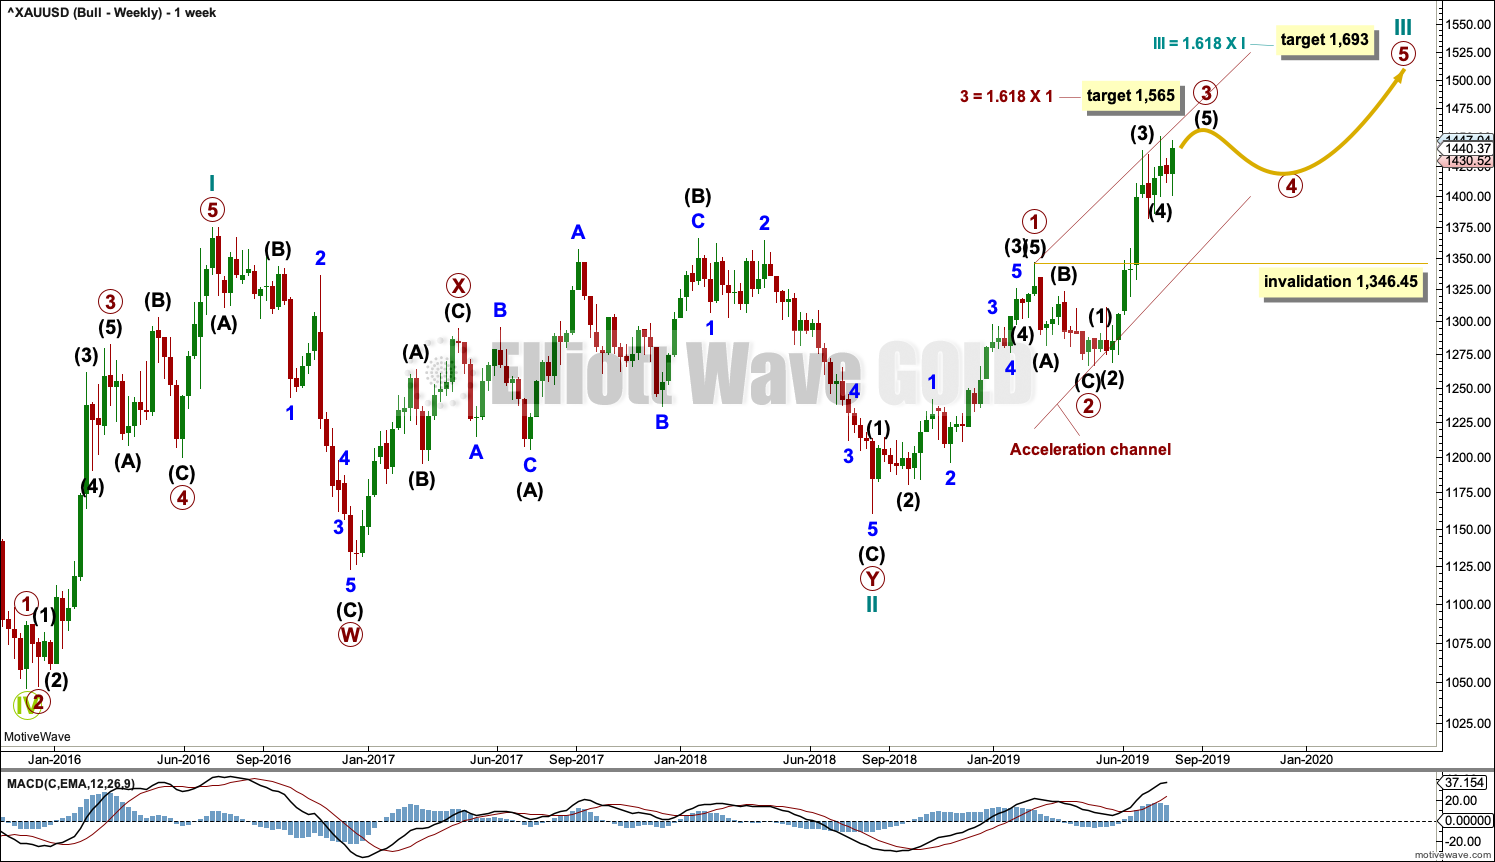
Click chart to enlarge.
This wave count sees the the bear market complete at the last major low for Gold in November 2015.
If Gold is in a new bull market, then it should begin with a five wave structure upwards on the weekly chart. However, the biggest problem with this wave count is the structure labelled cycle wave I because this wave count must see it as a five wave structure, but it looks more like a three wave structure.
Commodities often exhibit swift strong fifth waves that force the fourth wave corrections coming just prior and just after to be more brief and shallow than their counterpart second waves. It is unusual for a commodity to exhibit a quick second wave and a more time consuming fourth wave, and this is how cycle wave I is labelled. This wave count still suffers from this very substantial problem, and for this reason bearish wave counts are still considered above as they have a better fit in terms of Elliott wave structure.
Cycle wave II subdivides well as a double combination: zigzag – X – expanded flat.
Cycle wave III may have begun. Within cycle wave III, primary waves 1 and 2 may now be complete. If it continues lower as a double zigzag, then primary wave 2 may not move beyond the start of primary wave 1 below 1,160.75.
Cycle wave III so far for this wave count would have been underway now for 50 weeks. It may be beginning to exhibit some support from volume and increasing ATR. If this increase continues, then this wave count would have some support from technical analysis.
Draw an acceleration channel about primary waves 1 and 2: draw the first trend line from the end of primary wave 1 to the last high, then place a parallel copy on the last high. Keep redrawing the channel as price continues higher. When primary wave 3 is complete, then this channel would be drawn using Elliott’s first technique about the impulse. The lower edge may provide support.
Primary wave 4 may not move into primary wave 1 price territory below 1,346.45. Because the data used for this analysis is cash market data no overlap between primary waves 4 and 1 should be allowed. The invalidation point is absolute.
DAILY CHART

Click chart to enlarge.
Primary wave 3 may only subdivide as an impulse. Within the impulse, intermediate waves (1) through to (4) are all now complete. It is possible that intermediate wave (5) could be over at the last high, but for this wave count it would look more normal if it continued higher.
When it arrives, then primary wave 4 may not move into primary wave 1 price territory below 1,346.45.
At any stage, a new low below the start of intermediate wave (5) at 1,400.34 by any amount at any time frame would indicate intermediate wave (5) should be over and primary wave 3 should be over. At that stage, a multi week correction for primary wave 4 may be expected to be underway.
HOURLY CHART
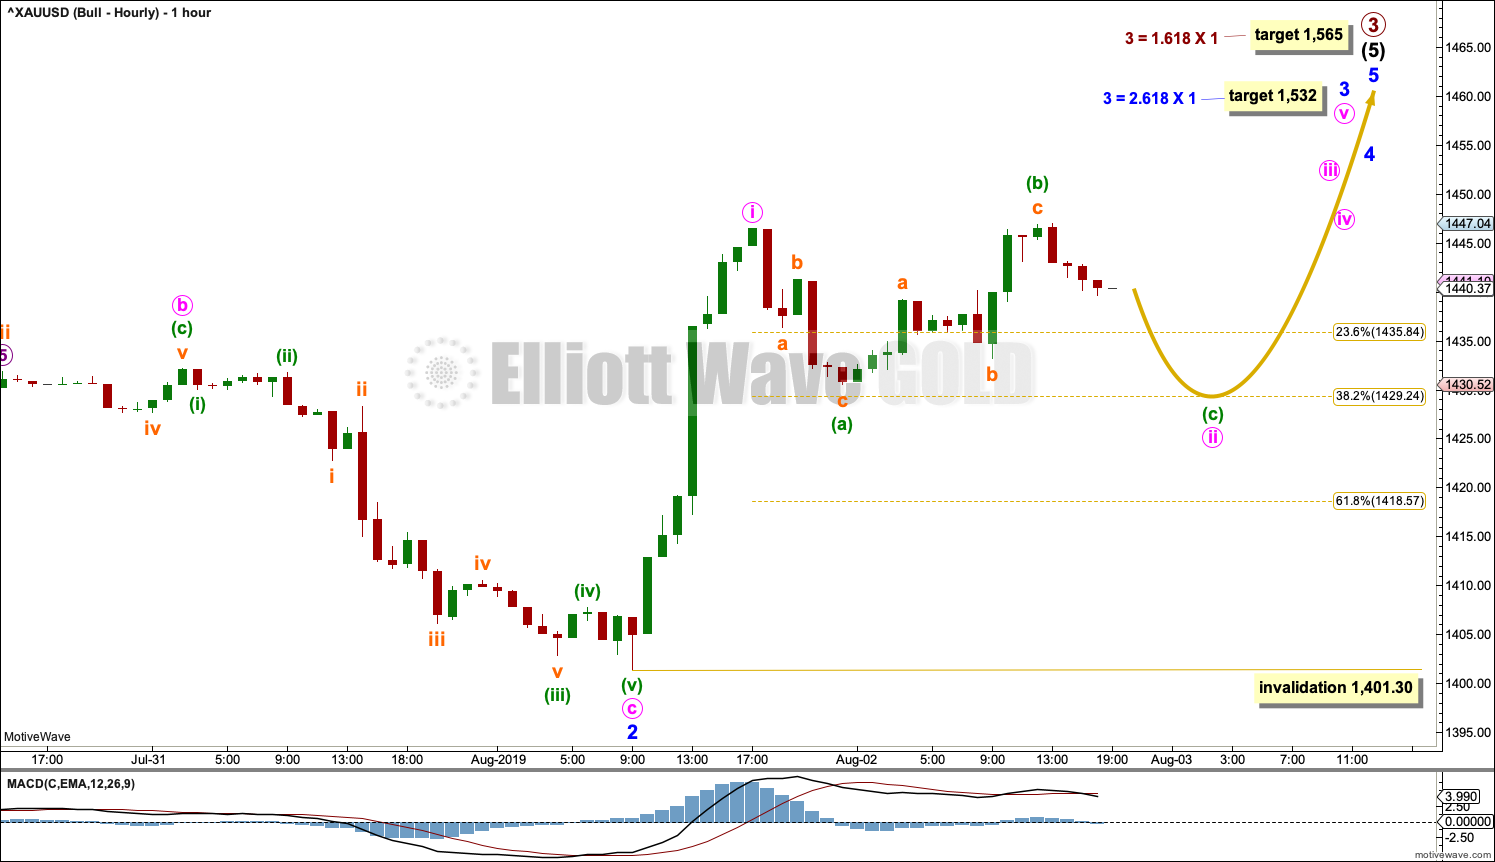
Click chart to enlarge.
Intermediate wave (5) may only subdivide as a five wave structure, either an impulse or an ending diagonal. Fifth waves to end third waves one degree higher, as this one is, almost always subdivide as impulses (that is what shall be expected).
Within intermediate wave (5), minor waves 1 and 2 may now both be complete.
Minor wave 3 may only subdivide as an impulse. Within minor wave 3, minute wave i may now be complete and minute wave ii may move lower as regular flat correction. Minute wave ii may end about the 0.382 Fibonacci Ratio. The 0.382 Fibonacci ratio may be favoured as the upwards pull of a third wave at minute and minor degrees may force minute wave ii to be more shallow.
When minute wave ii may be complete, then look out for an increase in upwards momentum and an upwards breakout from the consolidation zone.
Minute wave ii may not move beyond the start of minute wave i below 1,401.30.
TECHNICAL ANALYSIS
MONTHLY CHART
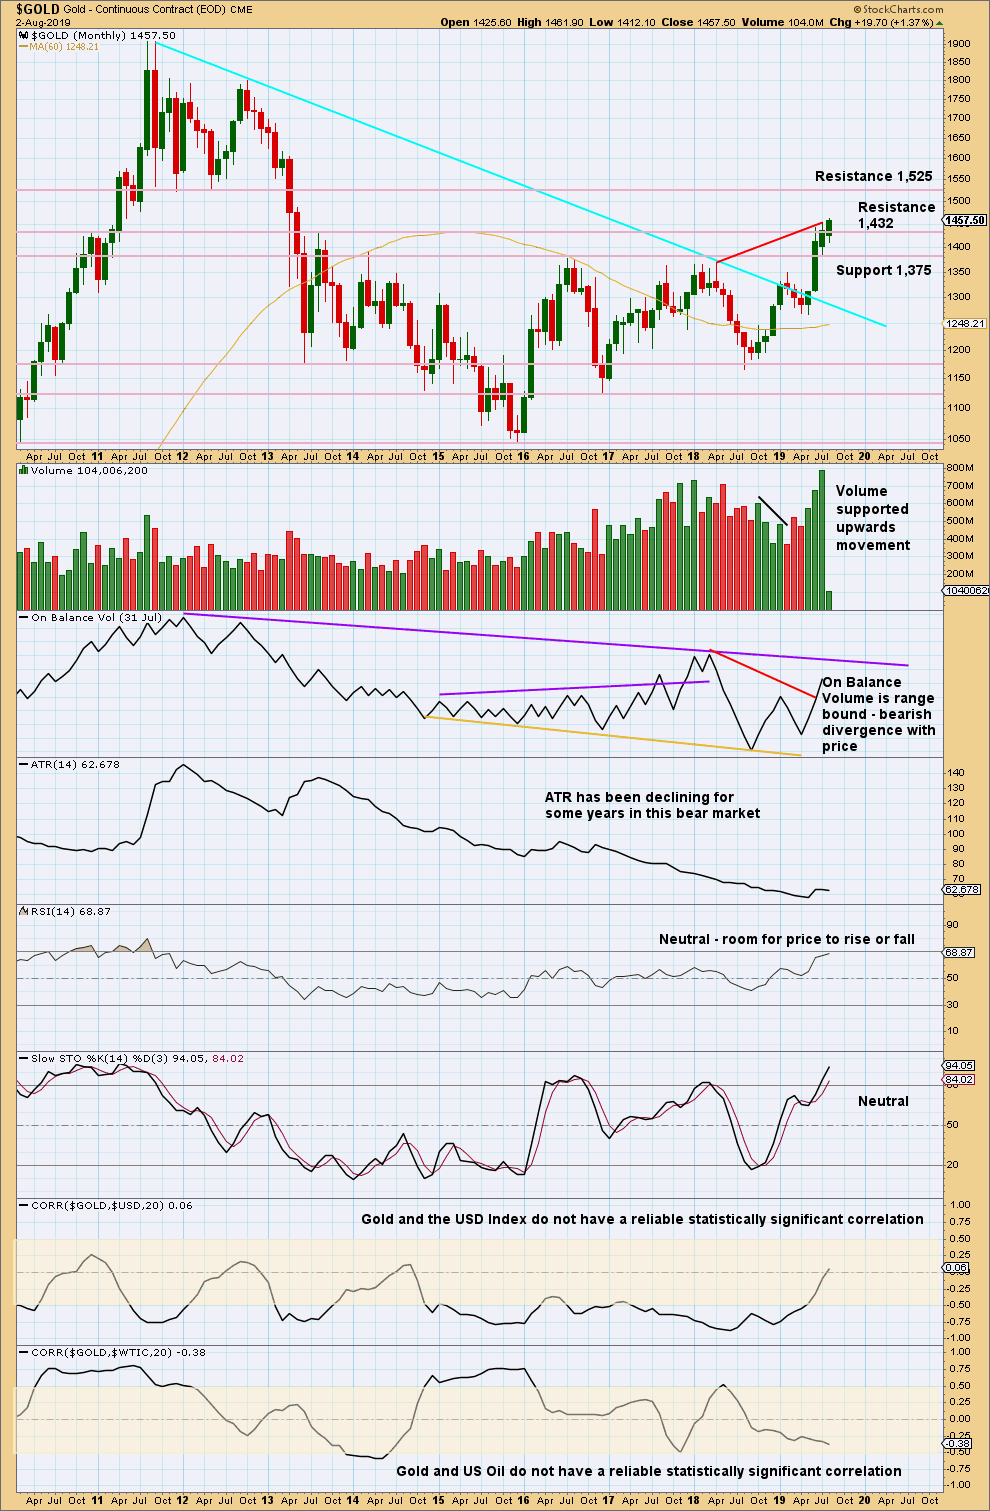
Click chart to enlarge. Chart courtesy of StockCharts.com.
Gold has effected an upwards breakout above multi-year resistance and above the cyan bear market trend line. Look for next resistance identified on the chart.
The new high in price above prior highs for March / April 2018 have not been matched by new highs for On Balance Volume. This divergence is bearish and supports a bearish Elliott wave count. This divergence may be given a little weight because it is strong and evident on the monthly chart.
WEEKLY CHART
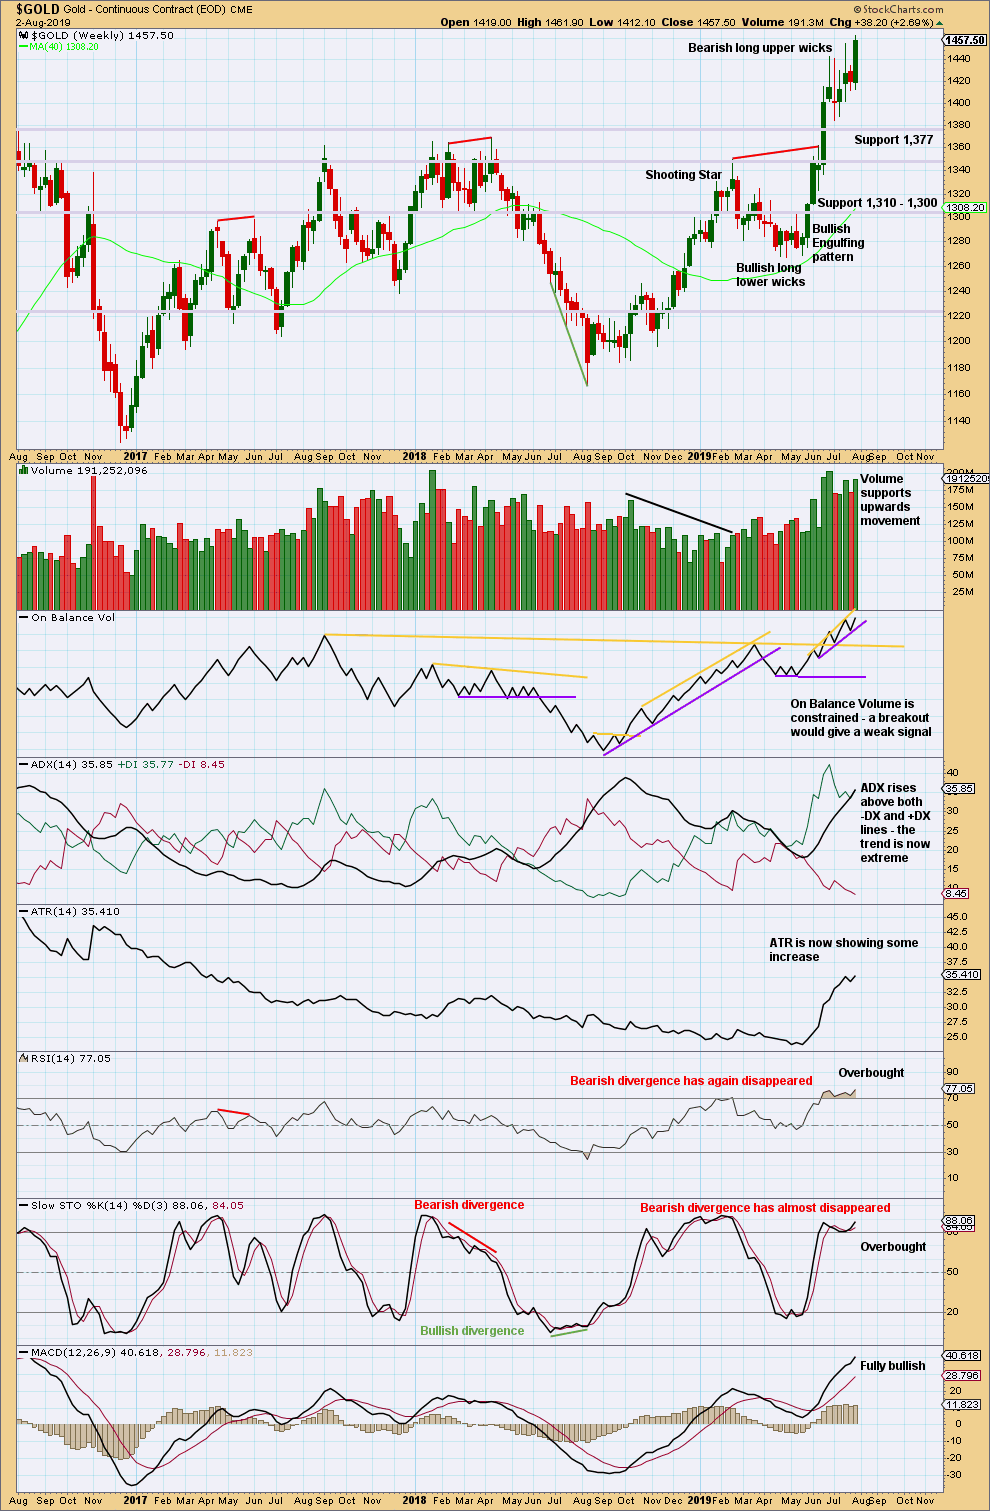
Click chart to enlarge. Chart courtesy of StockCharts.com.
The bottom line remains that a multi year breakout occurred a few weeks ago, and it occurred with strength in volume. ADX is now extreme and conditions are overbought. Some consolidation or pullback may reasonably be expected here to relieve extreme conditions.
This weekly candlestick closes strong with support from volume. This is not however matched by strength on the daily chart.
DAILY CHART
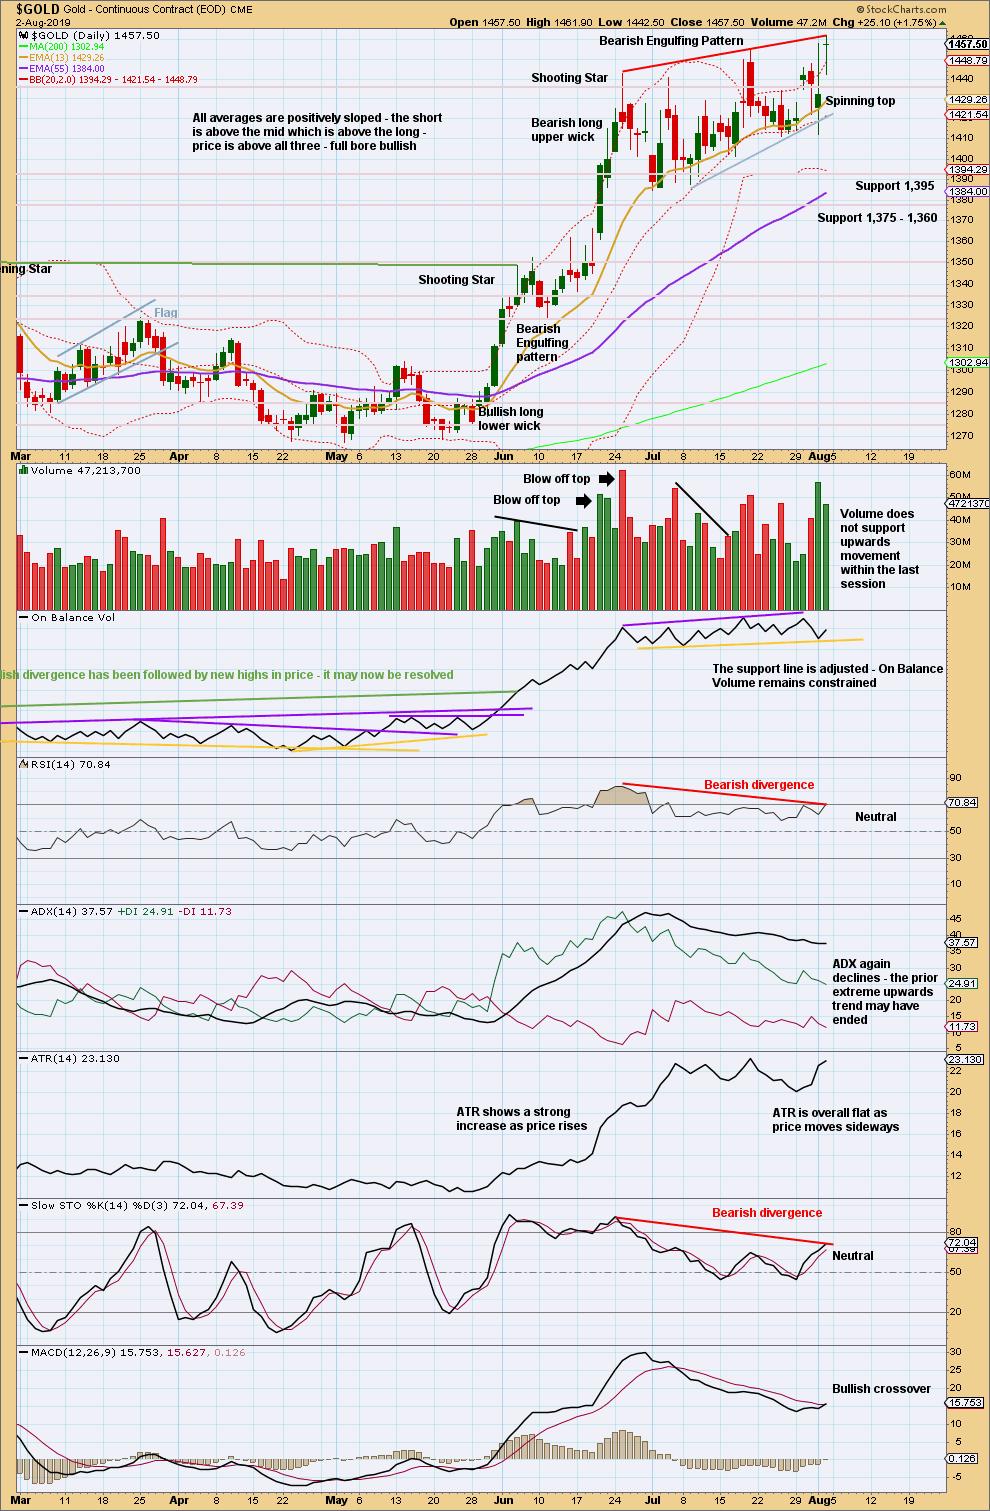
Click chart to enlarge. Chart courtesy of StockCharts.com.
Another new high lacks support from volume and the Doji candlestick indicates indecision.
The prior upward trend reached very extreme, and thereafter there is strong mid-term divergence between price and both of RSI and Stochastics. Some pullback or consolidation to relieve extreme conditions is reasonably strongly indicated as most likely by this chart.
Strongest support is about 1,375.
GDX WEEKLY CHART
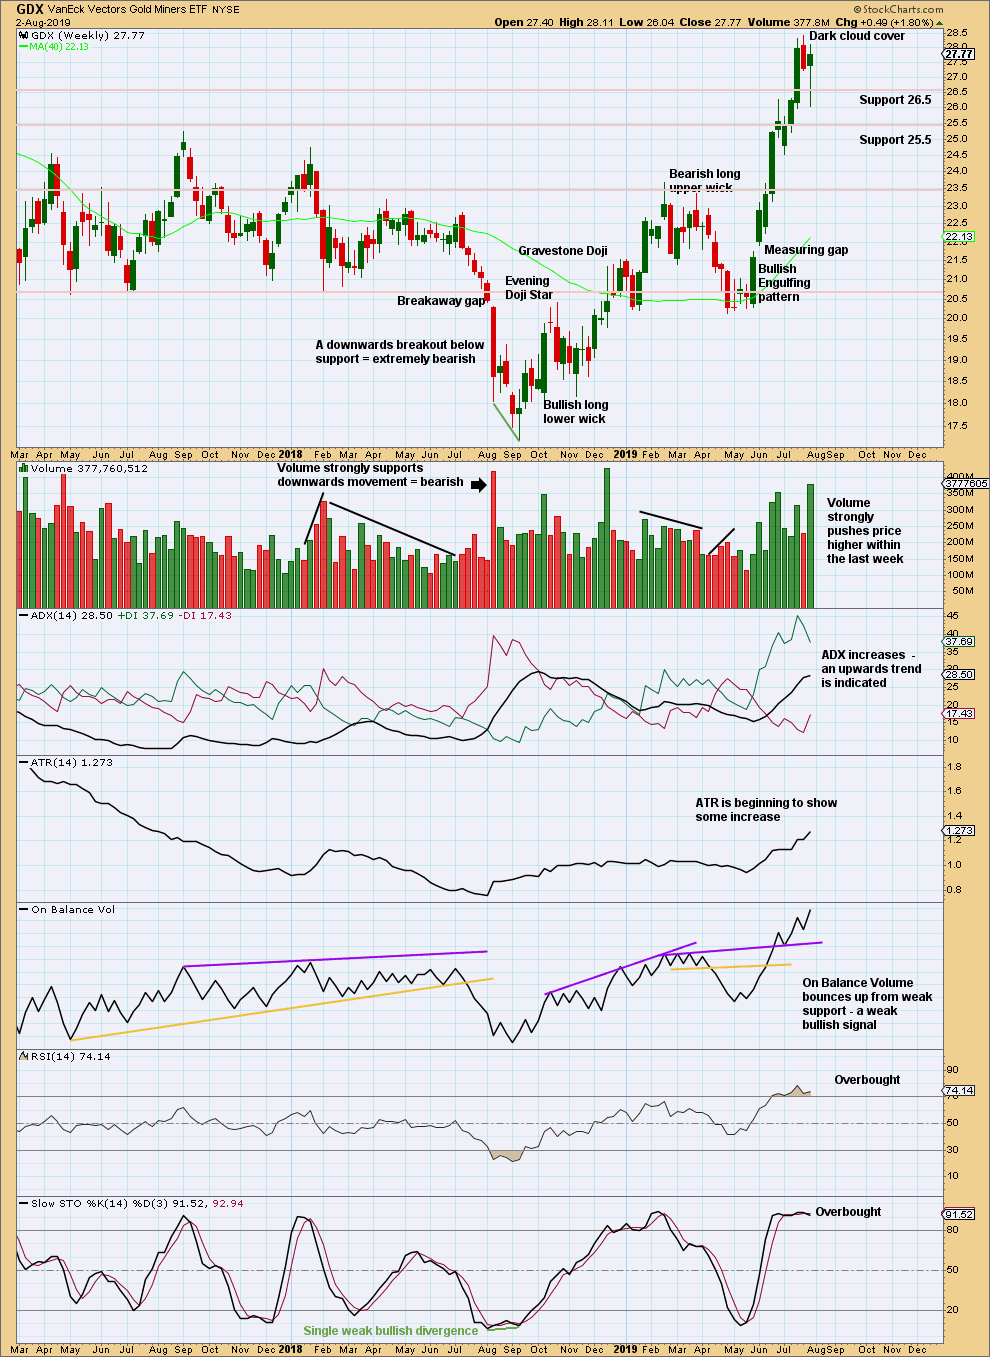
Click chart to enlarge. Chart courtesy of StockCharts.com.
This week completes a lower low and lower high, but the candlestick has closed green and the balance of volume was upwards. Upwards movement within the week may have support from volume, but daily volume bars would better be analysed to draw a conclusion here.
The upwards trend is not yet extreme. A long lower wick on this weekly candlestick is bullish.
GDX DAILY CHART
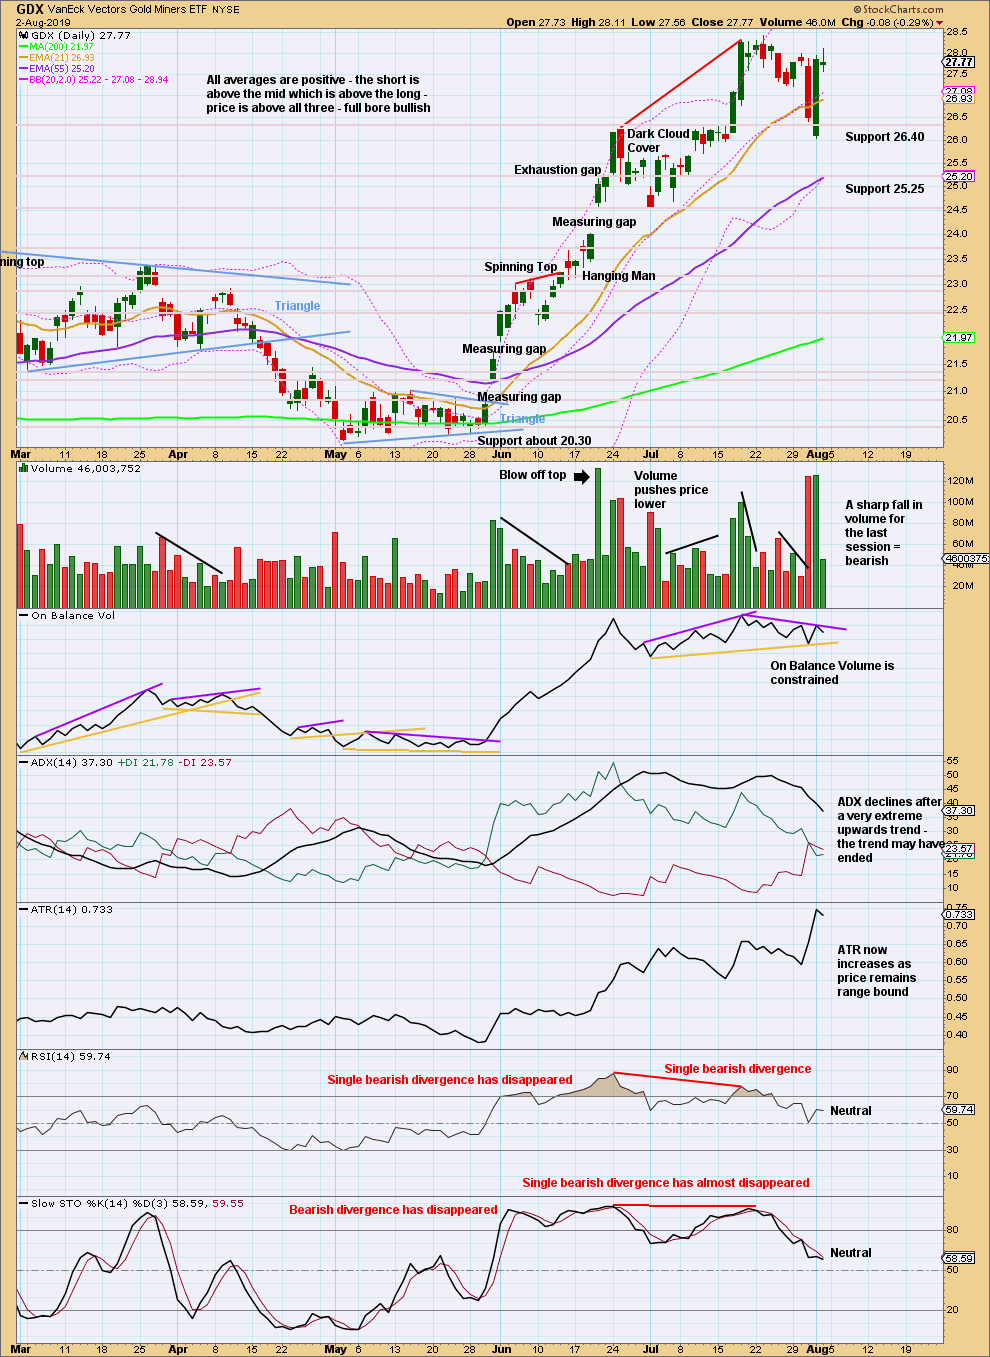
Click chart to enlarge. Chart courtesy of StockCharts.com.
Price remains range bound and is whipsawing within a consolidation zone. Resistance is about 28.50 and support about 26.40. A close outside of this zone is required to indicate the next direction.
A new swing low below 24.53 would confirm a trend change.
Published @ 10:36 p.m. EST.
—
Careful risk management protects your trading account(s).
Follow my two Golden Rules:
1. Always trade with stops.
2. Risk only 1-5% of equity on any one trade.
—
New updates to this analysis are in bold.
chart for hourly bear updated:
bullish hourly chart updated
On the bull side it could be a triangle wave intermediate 4?
Volume close to Friday’s with big up move still in place. Breakout would seem to favor the bullish alternative in my opinion. Macroeconomics seem to also be pointing up.
Gold at $1460. Alternate bearish weekly count is invalidated??
Lara:”A new high by any amount at any time frame above 1,450.65 would invalidate this wave count.”
Gold appears to be on the move.
Thanks Lara for your hard work.
Be careful – could still be a bear on the Main (Bear) count.
Yes. Lara has several counts she has not published. These are just three with high probability. These two remaining bear/bull count will stay with us for long time to come. Unless the bull count gets invalidated below 1345??
I wanted to mention that the COT report for gold showed a 10% contraction in open interest (over 50,000 contracts) from the previous week, and this was the highest price on a Tuesday close (7/30) since the breakout. Typically, if you’re bullish, you’d like to see open interest expanding as price increases – lower open interest as price increase portends, potentially, higher volatility. It seems 1375 will be tested eventually, and I think this definitely supports the bear case. Stay vigilant if gold gets a little wild here and makes a new high – could simply be the B wave.
GLTA
Good to know…thx, Corey!
C Wave down looks to be starting. I’ll be pressing all the way down to 1375.
Silver getting hammered after failing at another attempt at new high.
Silver target is 15.40 – 15.50 area.
Thanks Corey, I did get nervous. And now there was only 10 cents room and I would have been clueless again 🙂
I am cautious with this short, but could be a tremendously quick elevator down to 1375 (C wave that is an impulse). Also, this last move higher intra-day could have been a deep second wave…that means tomorrow could be a huge down day in gold. A bunch of PMs (gold miners) had long upper wicks today, so that might be a sign of a drop coming.
Also, looking at stock indices (like the Dow, SPX, and Nasdaq), there is a clear ending contracting diagonal setting up for a final 5th wave up. This, I believe, matches a quick drop in gold followed by a very steep upward move after the market tops out. My guess is we are now only 2 – 3 weeks away from a major market top in equities.
I would potentially throw all of this out and admit I’m wrong if equities get hammered overnight and gold (and silver) go to new highs. Watch out in that case!