
For the short to mid term, both the main daily chart and the main bullish daily chart expected some more upwards movement. The alternate wave count is today invalidated.
Summary: There remains an upwards trend in place at the weekly chart level. Conditions remain very extreme. This market is still susceptible to another deep pullback and whipsawing.
The main bearish wave count target for upwards movement to end is at 1,595, but first a deep pullback now to about 1,389 may relieve extreme conditions. There is strong support below about 1,375.
The bullish Elliott wave count expects upwards movement to continue here. The mid-term target is 1,565.
Grand SuperCycle analysis is here.
Monthly charts were last published here with video here.
BEARISH ELLIOTT WAVE COUNTS
MAIN WEEKLY CHART
Click chart to enlarge.
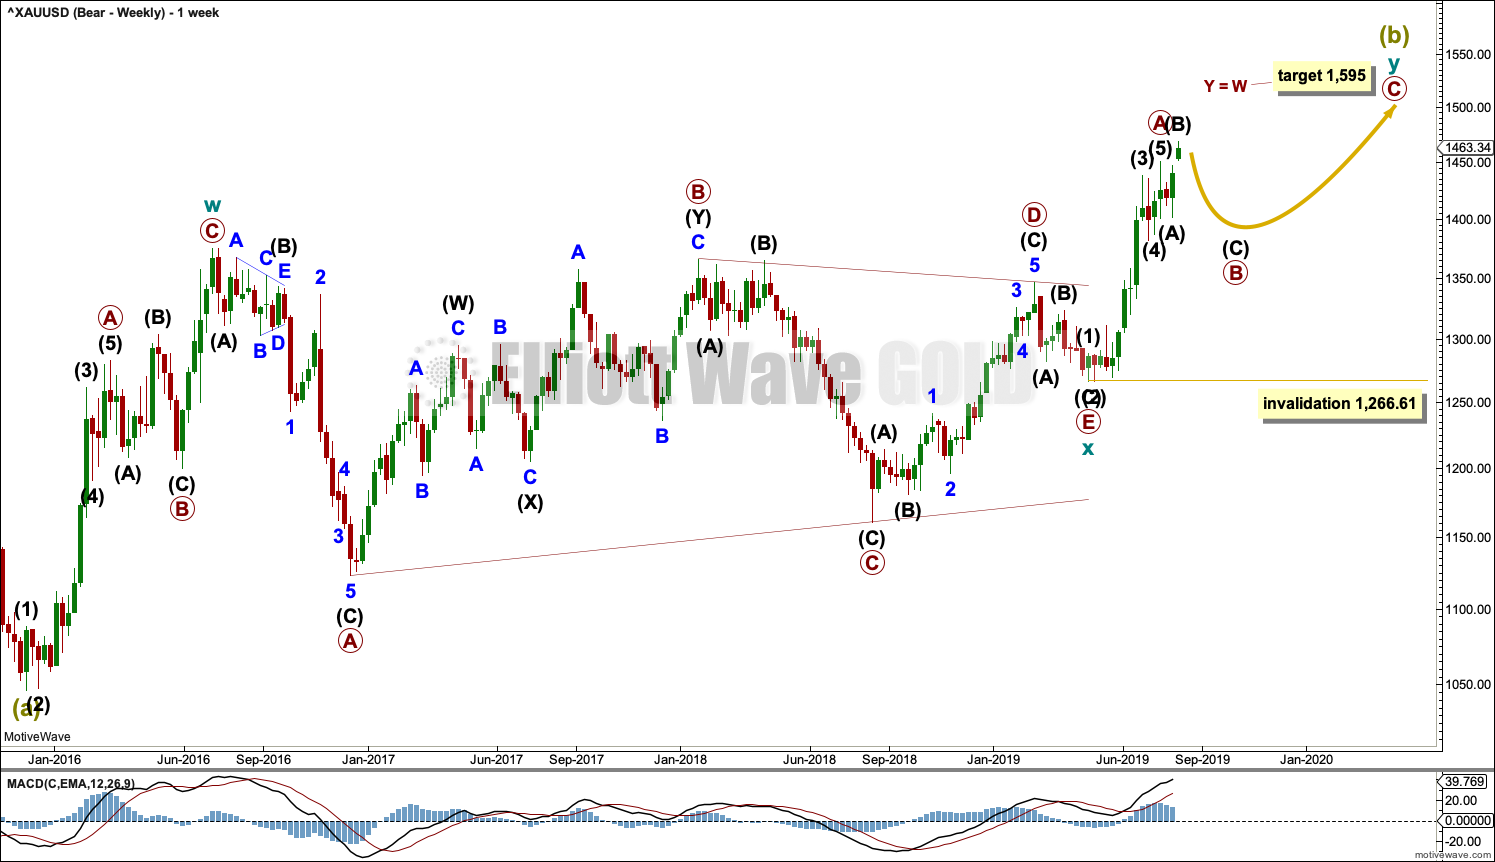
It remains possible that Super Cycle wave (b) is an incomplete double zigzag.
The first zigzag in the double is seen in the same way for both bearish wave counts, a zigzag labelled cycle wave w.
This main bearish wave count sees cycle wave x as regular contracting triangle. Cycle wave y must subdivide as a zigzag if Super Cycle wave (b) is a double zigzag. Within cycle wave y, primary wave A may now be complete, and primary wave B may not move beyond the start of primary wave A below 1,266.61.
Primary wave B may continue further for a few more weeks to relieve extreme conditions and complete a corrective Elliott wave structure. Primary wave B within cycle wave y may now be unfolding as an expanded flat correction. There is a good example of this structure on this chart: primary wave B within cycle wave w was an expanded flat from the beginning of March 2016 to the end of May 2016.
MAIN DAILY CHART
Click chart to enlarge.
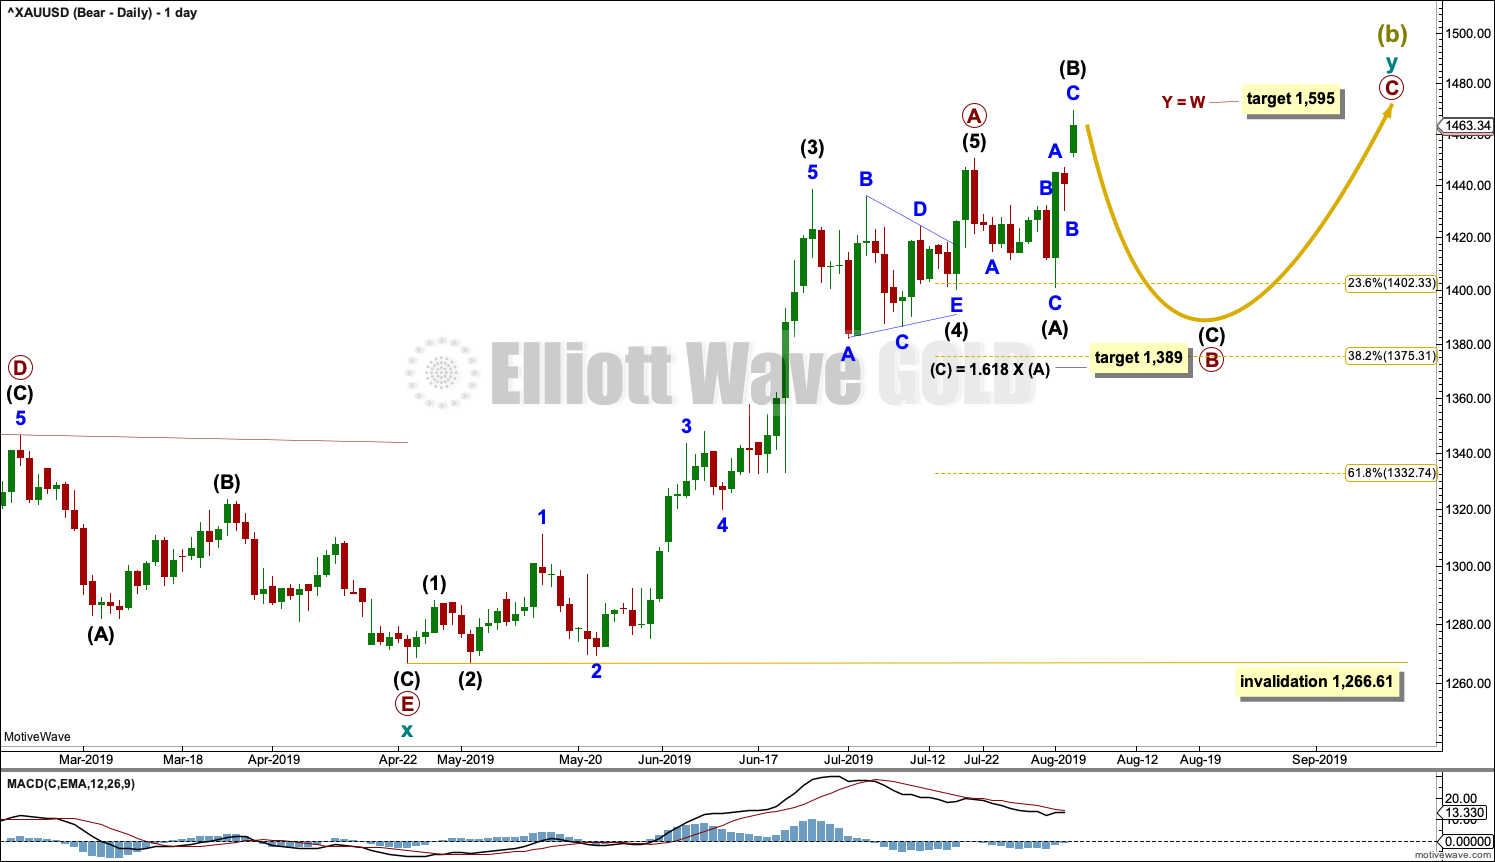
Within cycle wave y, primary wave A may now be a complete five wave impulse.
Primary wave B may unfold over a few weeks. Primary wave B may subdivide as any one of more than 23 possible corrective Elliott wave structures. At this stage, it may be a time consuming sideways consolidation as a combination, flat or triangle. The most likely of these possibilities is an expanded flat, which is how it is labelled today.
Primary wave B should exhibit weakness.
Within primary wave B, intermediate wave (B) may be complete here or very soon as a quick sharp zigzag.
HOURLY CHART
Click chart to enlarge.
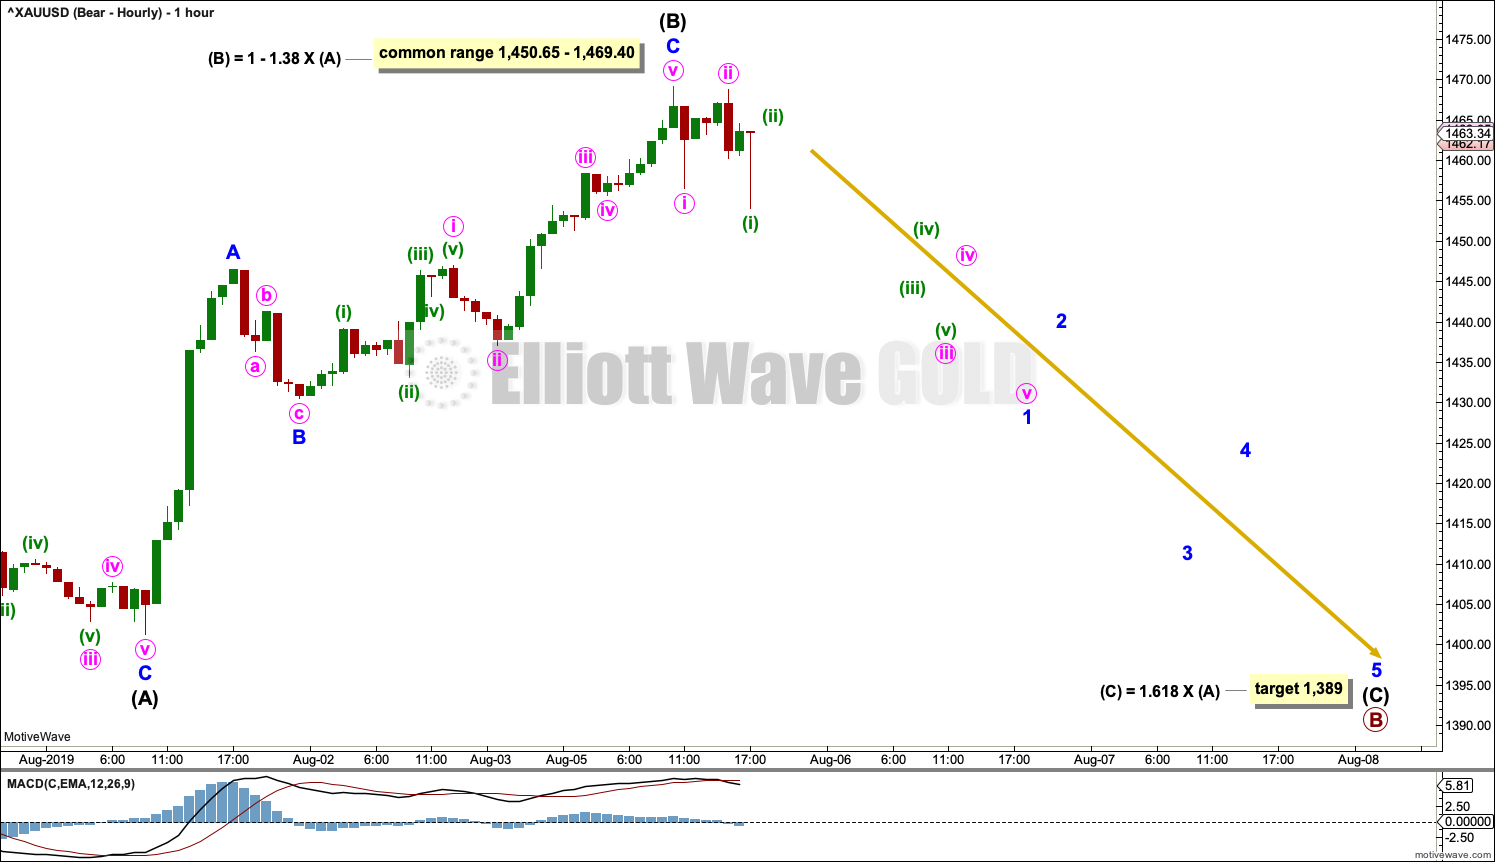
Primary wave B may be unfolding as an expanded flat correction. This is the most common type of flat, and it is a common structure in B wave positions. Within an expanded flat, intermediate wave (B) so far remains just within the normal range of 1 to 1.38 times the length of intermediate wave (A). There is no Elliott wave rule stating a limit for B waves within flats; they may be longer than the common range. They should be identified by technical weakness.
It is possible that intermediate wave (B) may yet move a little higher. There is no short-term upper invalidation point for this wave count at this stage.
Intermediate wave (C) of an expanded flat should move below the end of intermediate wave (A) at 1,401.30 to avoid a truncation and a very rare running flat.
Intermediate wave (C) must subdivide as a five wave structure.
Primary wave B may also be unfolding as a running triangle. This may see sideways movement in an ever decreasing range for another couple of weeks or so.
Primary wave B may also be unfolding as a combination. Within a combination, the first structure may be a complete zigzag labelled intermediate wave (W). The double may be joined by a three in the opposite direction, a zigzag labelled intermediate wave (X). A second structure in a double may now unfold sideways as either a flat or triangle labelled intermediate wave (Y).
BULLISH ELLIOTT WAVE COUNT
WEEKLY CHART
Click chart to enlarge.
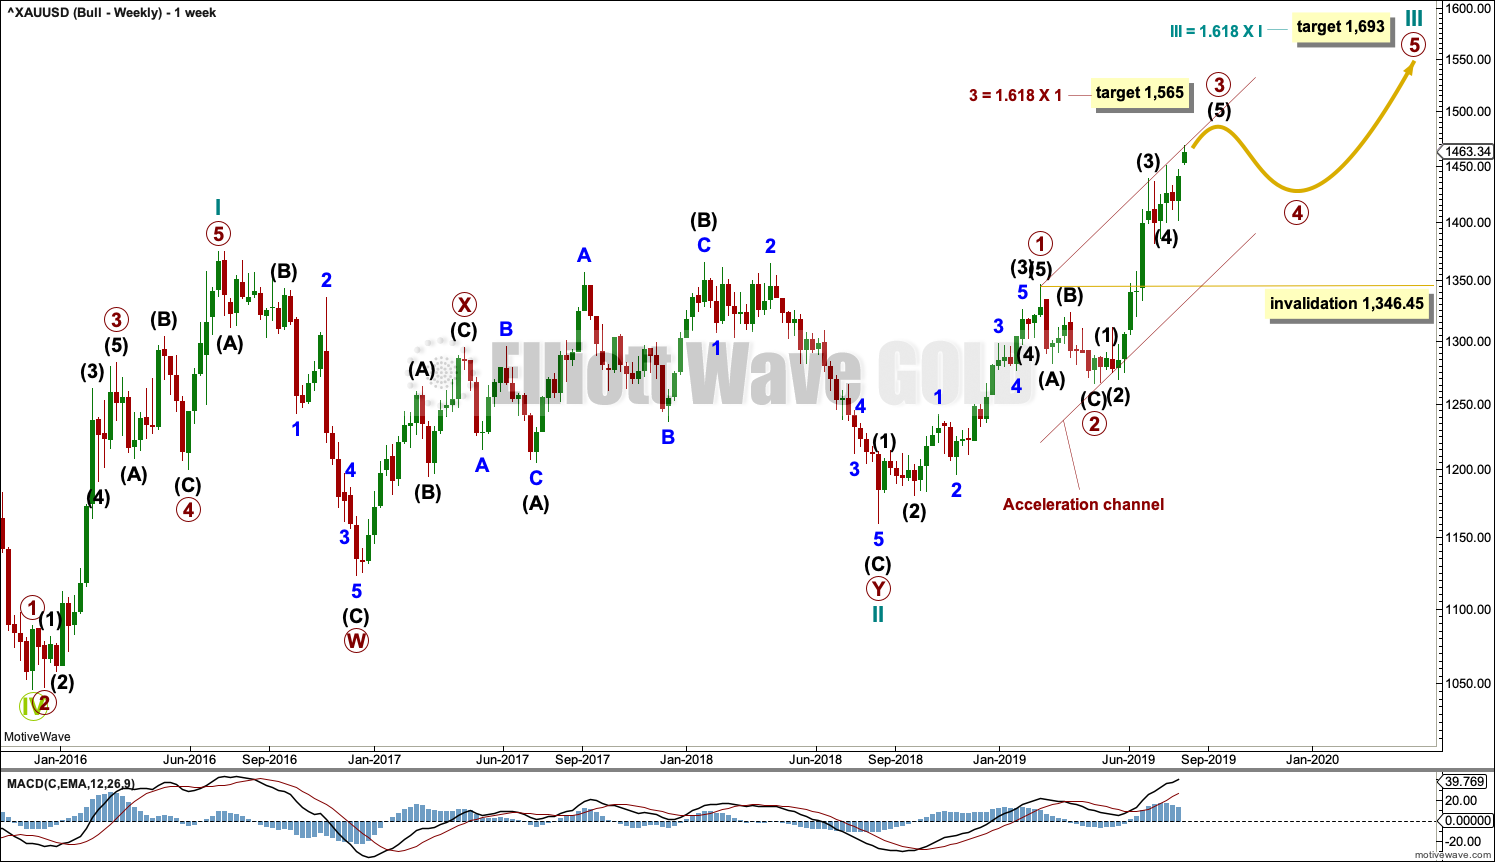
This wave count sees the the bear market complete at the last major low for Gold in November 2015.
If Gold is in a new bull market, then it should begin with a five wave structure upwards on the weekly chart. However, the biggest problem with this wave count is the structure labelled cycle wave I because this wave count must see it as a five wave structure, but it looks more like a three wave structure.
Commodities often exhibit swift strong fifth waves that force the fourth wave corrections coming just prior and just after to be more brief and shallow than their counterpart second waves. It is unusual for a commodity to exhibit a quick second wave and a more time consuming fourth wave, and this is how cycle wave I is labelled. This wave count still suffers from this very substantial problem, and for this reason bearish wave counts are still considered above as they have a better fit in terms of Elliott wave structure.
Cycle wave II subdivides well as a double combination: zigzag – X – expanded flat.
Cycle wave III may have begun. Within cycle wave III, primary waves 1 and 2 may now be complete. If it continues lower as a double zigzag, then primary wave 2 may not move beyond the start of primary wave 1 below 1,160.75.
Cycle wave III so far for this wave count would have been underway now for 51 weeks. It may be beginning to exhibit some support from volume and increasing ATR. If this increase continues, then this wave count would have some support from technical analysis.
Redraw an acceleration channel about primary waves 1 and 2: draw the first trend line from the end of primary wave 1 to the last high, then place a parallel copy on the low of primary wave 2. Keep redrawing the channel as price continues higher. When primary wave 3 is complete, then this channel would be drawn using Elliott’s first technique about the impulse. The lower edge may provide support.
Primary wave 4 may not move into primary wave 1 price territory below 1,346.45. Because the data used for this analysis is cash market data no overlap between primary waves 4 and 1 should be allowed. The invalidation point is absolute.
DAILY CHART
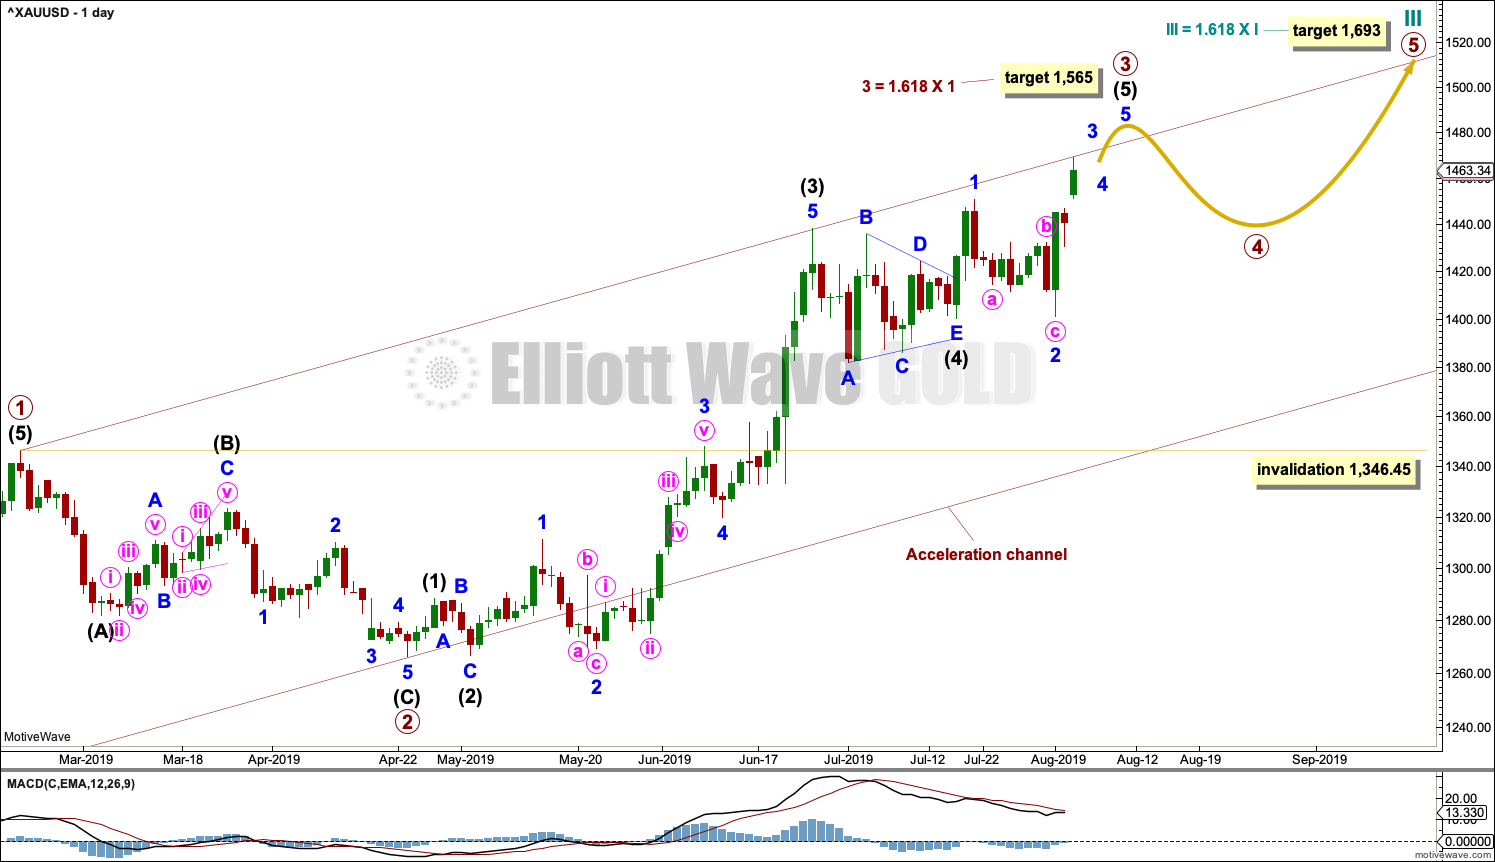
Click chart to enlarge.
Primary wave 3 may only subdivide as an impulse. Within the impulse, intermediate waves (1) through to (4) are all now complete. The structure of intermediate wave (5) is now incomplete, so it needs to move higher.
When it arrives, then primary wave 4 may not move into primary wave 1 price territory below 1,346.45.
HOURLY CHART
Click chart to enlarge.
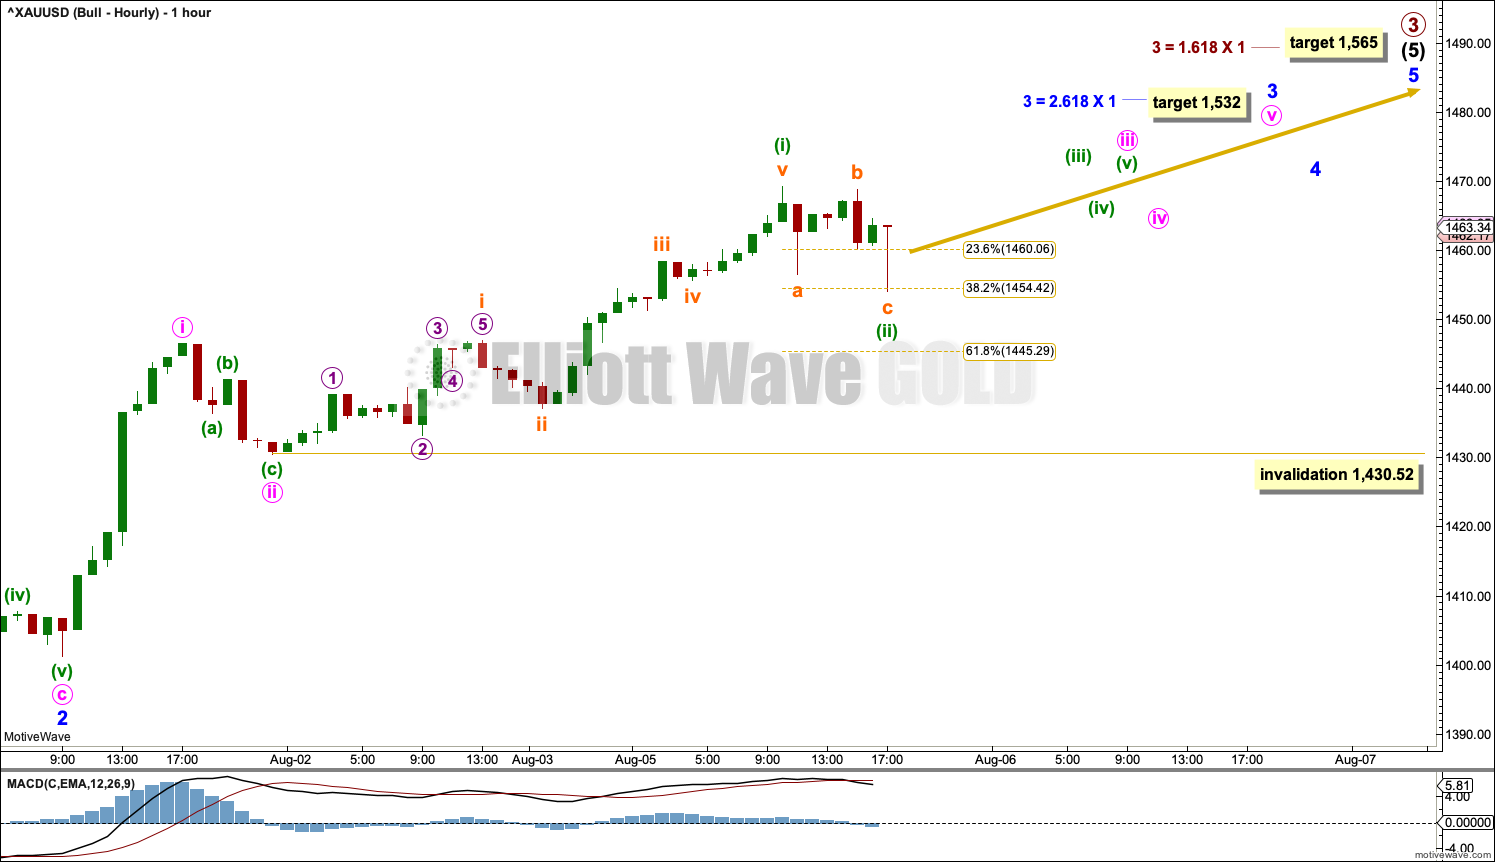
Intermediate wave (5) may only subdivide as a five wave structure, either an impulse or an ending diagonal. Fifth waves to end third waves one degree higher, as this one is, almost always subdivide as impulses (that is what shall be expected).
Within intermediate wave (5), minor waves 1 and 2 may now both be complete.
Minor wave 3 may only subdivide as an impulse. Within minor wave 3, minute waves i and ii may now be complete.
Within minute wave iii, minuette waves (i) and (ii) may be complete.
This wave count now expects there may be a series of three overlapping first and second waves within intermediate wave (5).
Because intermediate wave (5) is a fifth wave to end a third wave one degree higher, at primary degree, it may exhibit swift strong movement. It may end with a blow off top.
Minuette wave (ii) may not move beyond the start of minuette wave (i) below 1,430.52.
TECHNICAL ANALYSIS
MONTHLY CHART
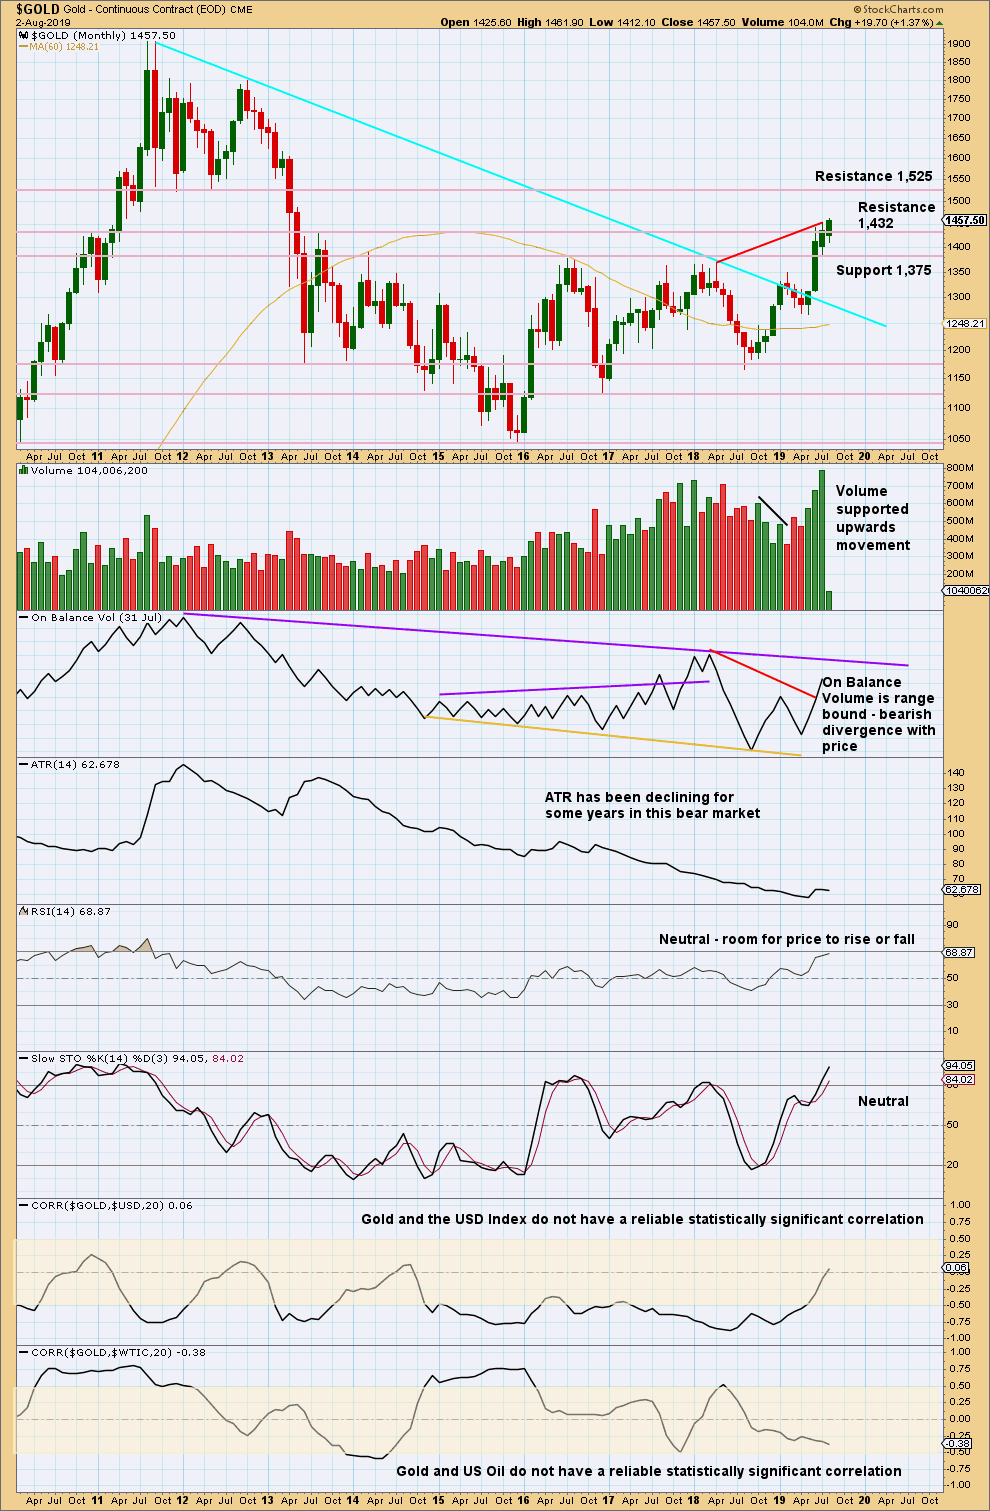
Click chart to enlarge. Chart courtesy of StockCharts.com.
Gold has effected an upwards breakout above multi-year resistance and above the cyan bear market trend line. Look for next resistance identified on the chart.
The new high in price above prior highs for March / April 2018 have not been matched by new highs for On Balance Volume. This divergence is bearish and supports a bearish Elliott wave count. This divergence may be given a little weight because it is strong and evident on the monthly chart.
WEEKLY CHART
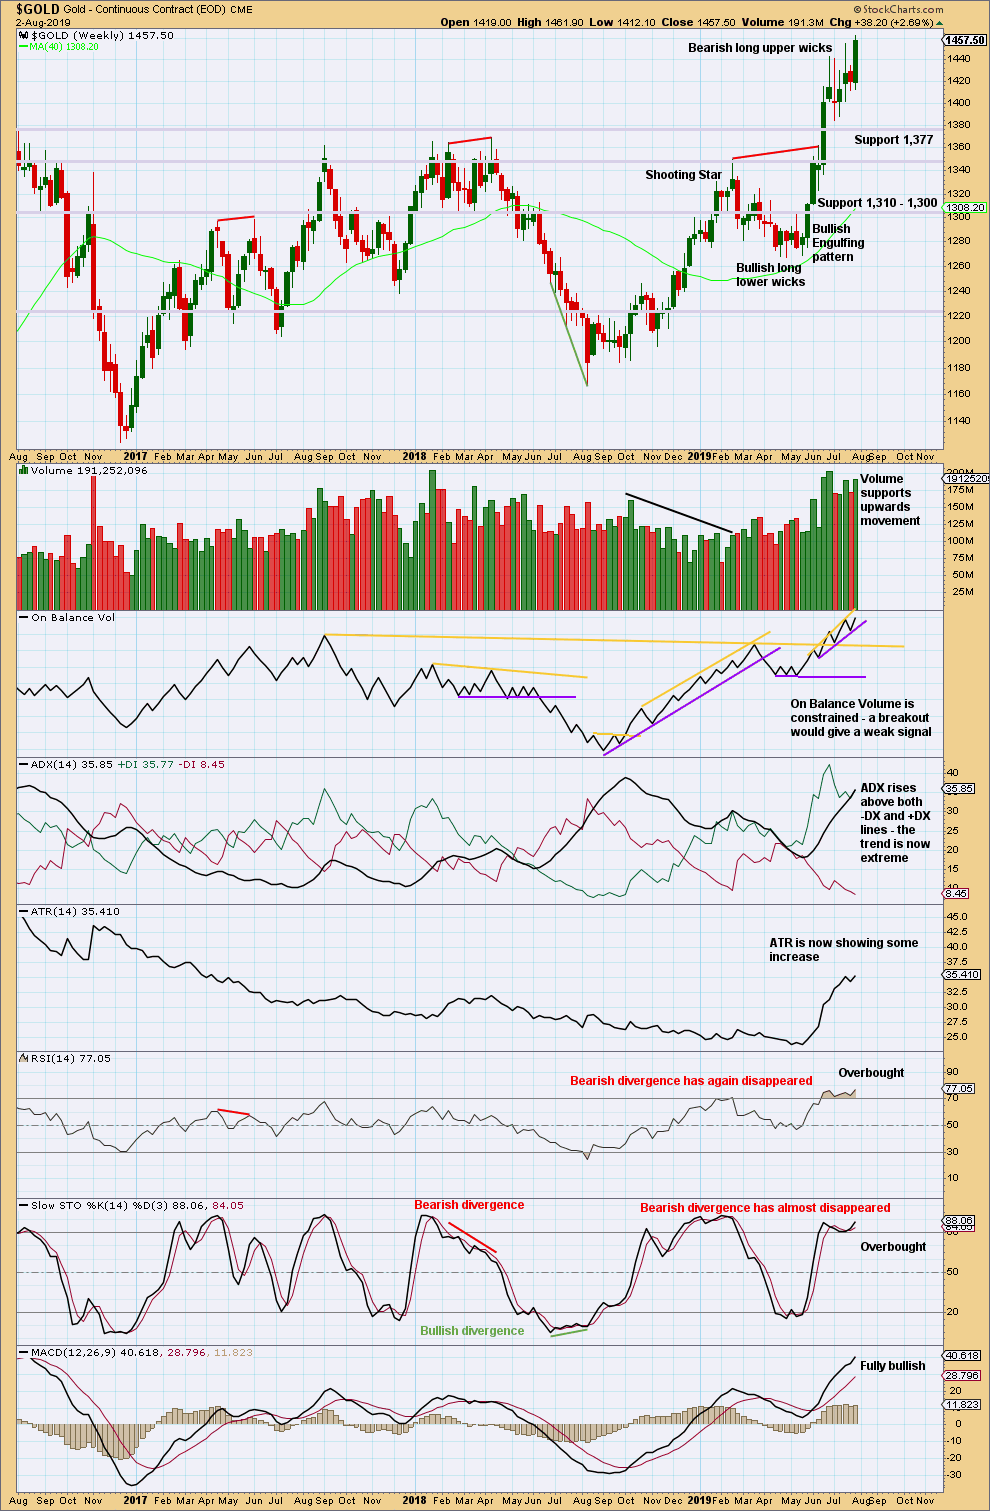
Click chart to enlarge. Chart courtesy of StockCharts.com.
The bottom line remains that a multi year breakout occurred a few weeks ago, and it occurred with strength in volume.ADX is now extreme and conditions are overbought. Some consolidation or pullback may reasonably be expected here to relieve extreme conditions.
The last weekly candlestick closes strong with support from volume. This is not however matched by strength on the daily chart.
DAILY CHART
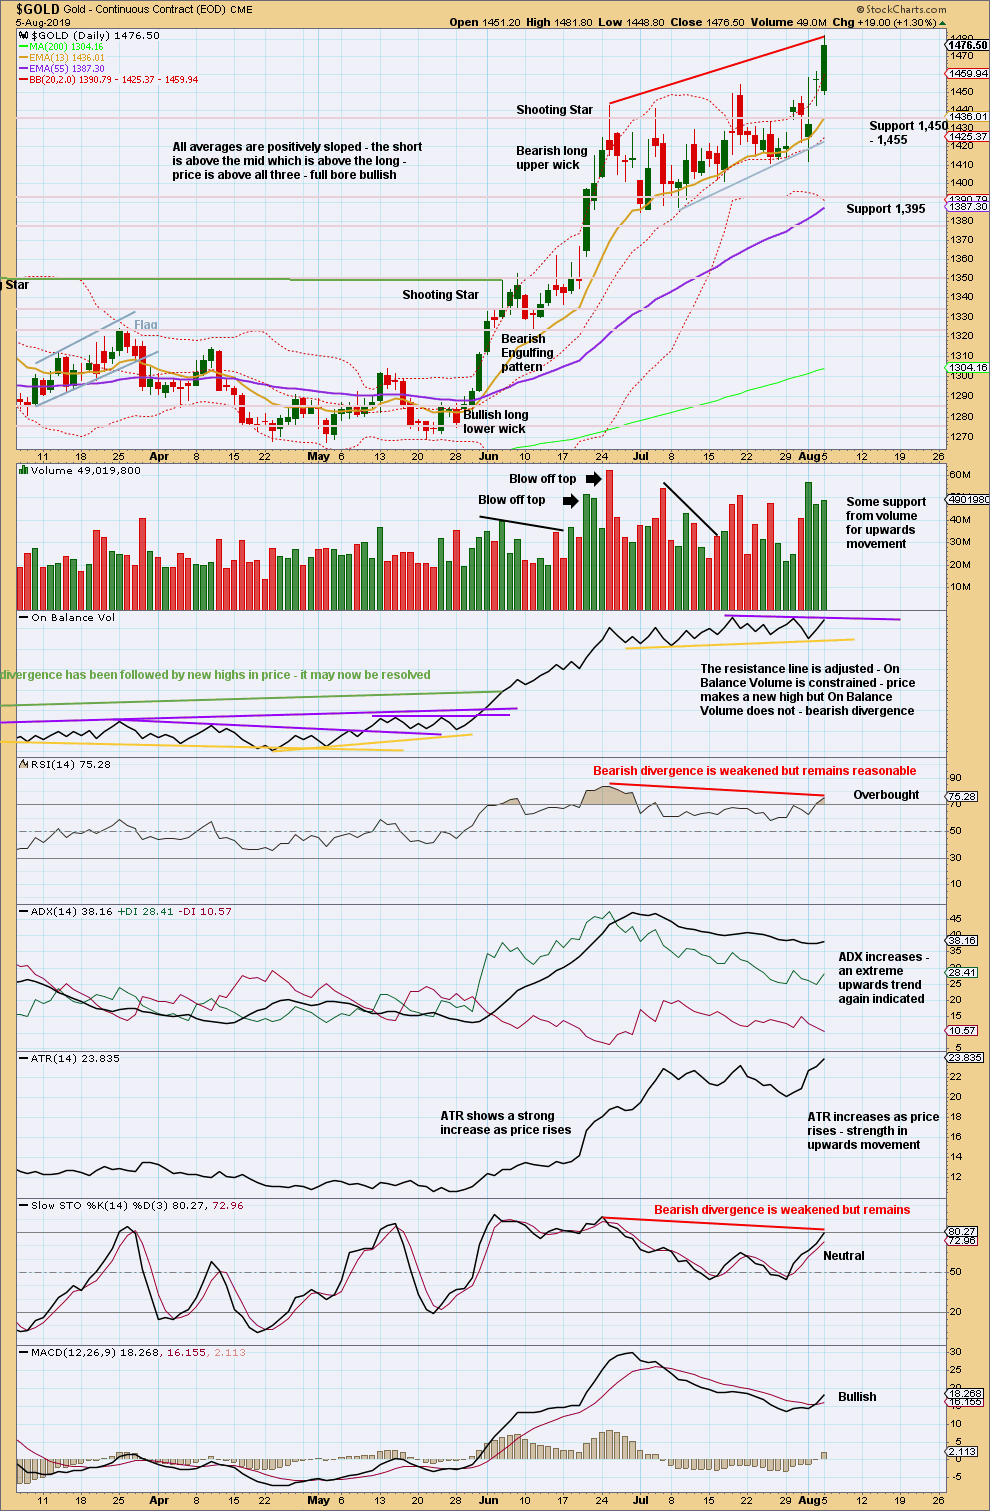
Click chart to enlarge. Chart courtesy of StockCharts.com.
Today price has closed above resistance with a little support from volume.
However, volume remains lighter than two days prior. This is a little suspicious; upwards breakouts require support from volume for confidence.
With the new high today, there is divergence between price and all of On Balance Volume, RSI and Stochastics. ADX again indicates the trend is extreme.
On Balance Volume is at resistance. This may halt the rise in price.
Look for support in the first instance at last resistance, which is now at 1,455. Assume an upwards breakout may have occurred while price remains above this point. If price closes back below this point, the breakout may be then considered false. Risk may be judged today to be at 1,455 for long positions.
GDX WEEKLY CHART
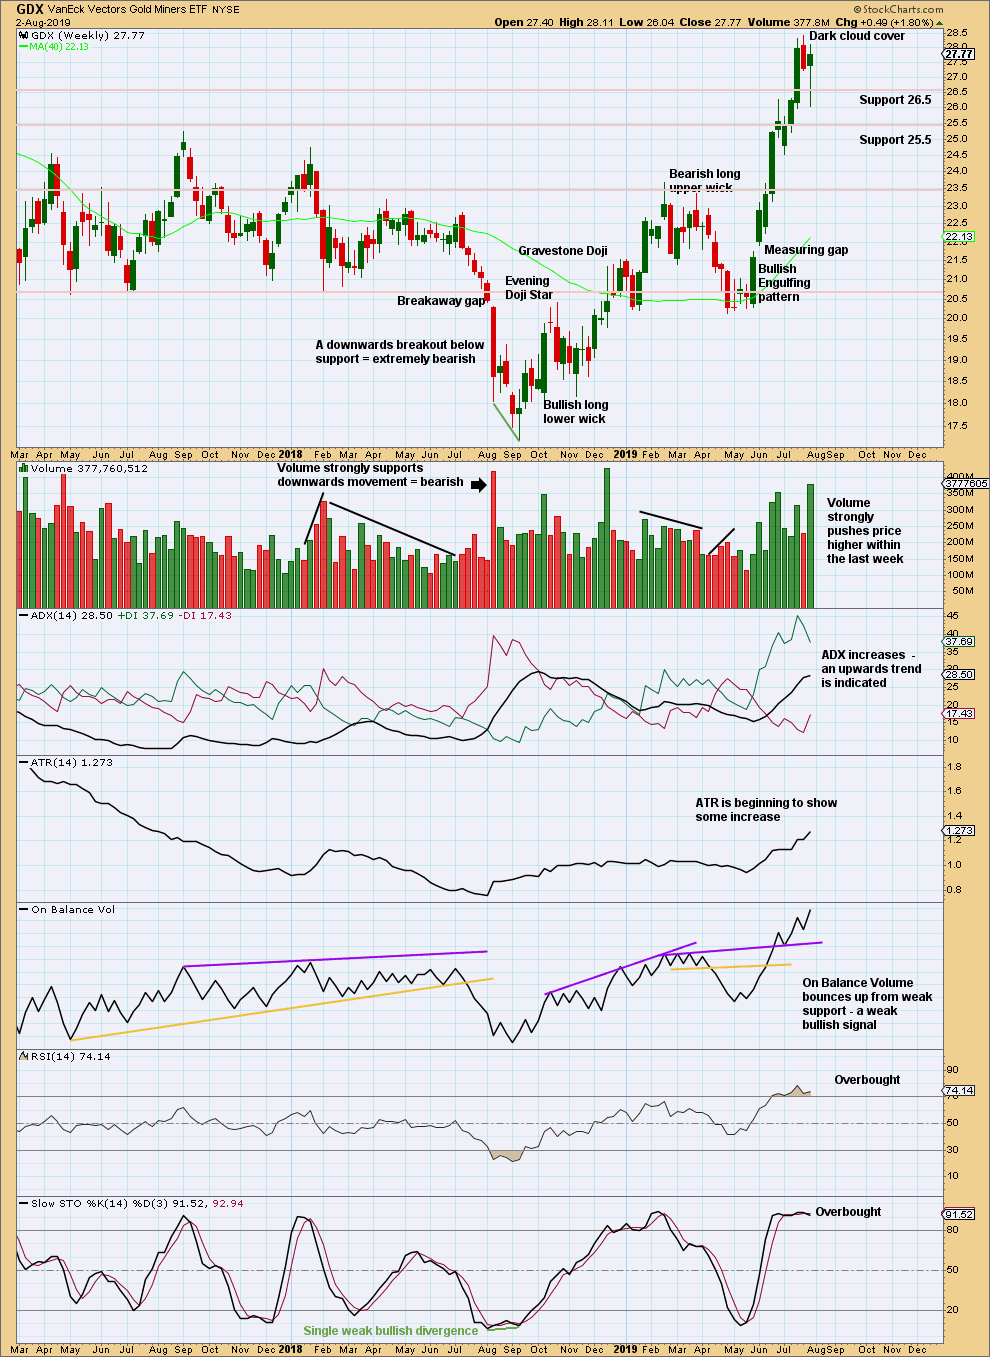
Click chart to enlarge. Chart courtesy of StockCharts.com.
Last week completes a lower low and lower high, but the candlestick has closed green and the balance of volume was upwards. Upwards movement within the week may have support from volume, but daily volume bars would better be analysed to draw a conclusion here.
The upwards trend is not yet extreme. A long lower wick on this weekly candlestick is bullish.
GDX DAILY CHART
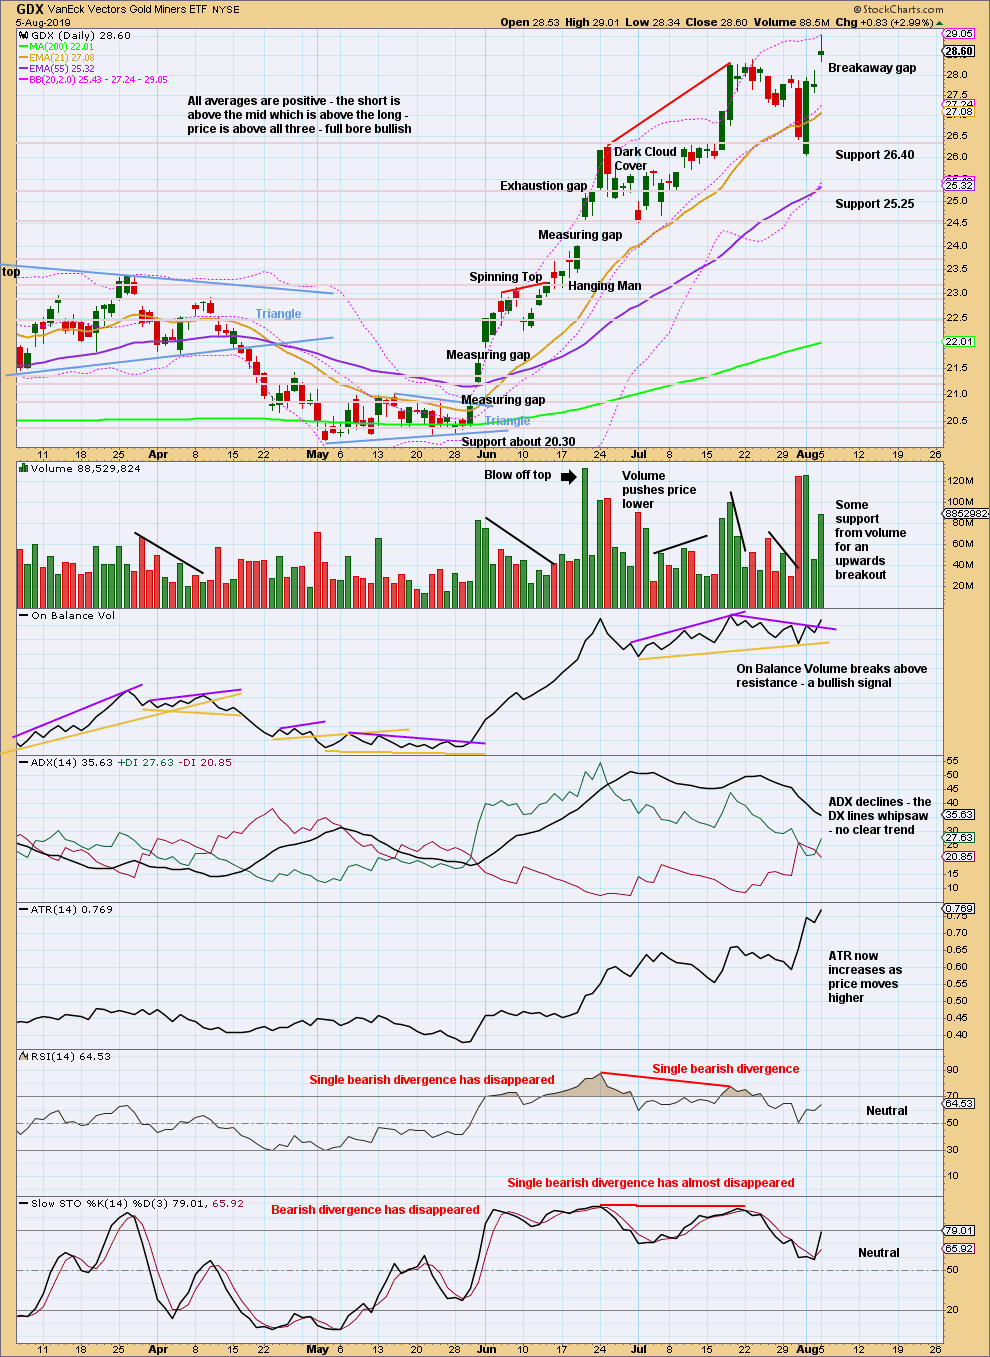
Click chart to enlarge. Chart courtesy of StockCharts.com.
An upwards breakout today has support from volume. If the upwards breakout holds, then price should not close the breakaway gap. Support may be at the lower edge of the gap at 28.11. Assume price will continue higher while it remains above this point.
If price makes a new low below 28.11 and closes the gap, it would be then correctly named an exhaustion gap. A pullback, consolidation or trend change may then be expected.
Published @ 07:08 p.m. EST.
—
Careful risk management protects your trading account(s).
Follow my two Golden Rules:
1. Always trade with stops.
2. Risk only 1-5% of equity on any one trade.
—
New updates to this analysis are in bold.
Hourly bull chart updated:
Hourly bear chart updated:
I’m still maintaining my short gold/silver positions. Incredibly frustrating to watch market rebound so strongly with gold/silver staying up…but I understand and am being patient.
A number of short-term (day) set-ups I’m watching are indicating another move down is close, but if we don’t start a move down tomorrow, or Thursday at the latest, then I’m likely out of the short positions.
Good luck (and watch that contracting ending diagonal in the DOW & SPX…so far looking textbook – but not the primary count, just something to consider).
The last cot report on silver suggests there are more shorts in silver than longs. There is a triangle about to end in silver and it could go up in short order. Historically silver has some dramatic short squeezes. I don’t envy your position here!!!!!!!!
My appetite for this trade is pretty minimal on the loss side. However, my basis for Dec Silver short is 16.55 and Dec gold is 1470 average. Would love to go long here, but my analysis won’t let me!
Also, in my trading futures for 14.5 years, I’ve never seen a COT report where the total long positions does not match the total short positions. For every contract purchased, there is a contract written. They are equal. It’s the category of holders of those positions that changes. Right now, the commercials are betting for a decline (e.g. they are writing the contracts), and the funds/specs are betting for further gains.
Again, though, I want to be long…but also willing to be patient to see how next few days plays out.
Corey