A little more upwards movement fits the bullish wave count better, but both Elliott wave counts remain valid. Support has held.
Summary: There remains an upwards trend in place at the weekly chart level. Conditions remain very extreme. This market is still susceptible to another deep pullback and whipsawing.
The main bearish wave count target for upwards movement to end is at 1,595, but first a deep pullback now to about 1,375 may relieve extreme conditions. There is strong support in this area.
The bullish Elliott wave count expects upwards movement to continue here. The mid-term target is 1,565. The bullish wave count may see a very strong blow off top ahead in coming days.
Grand SuperCycle analysis is here.
Monthly charts were last published here with video here.
BEARISH ELLIOTT WAVE COUNT
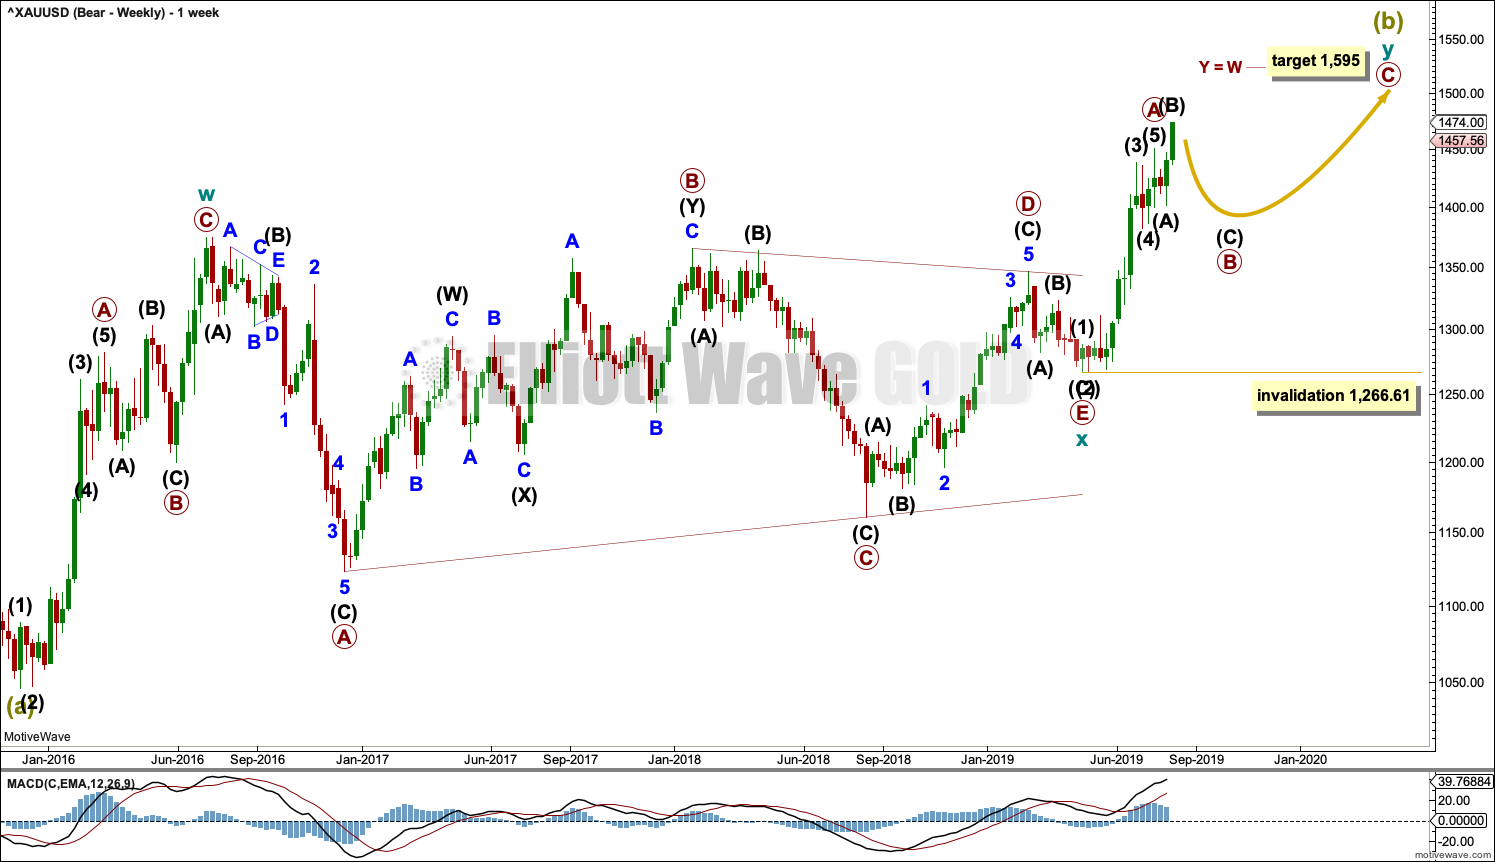
MAIN WEEKLY CHART
It remains possible that Super Cycle wave (b) is an incomplete double zigzag.
The first zigzag in the double is seen in the same way for both bearish wave counts, a zigzag labelled cycle wave w.
This bearish wave count sees cycle wave x as regular contracting triangle. Cycle wave y must subdivide as a zigzag if Super Cycle wave (b) is a double zigzag. Within cycle wave y, primary wave A may now be complete, and primary wave B may not move beyond the start of primary wave A below 1,266.61.
Primary wave B may continue further for a few more weeks to relieve extreme conditions and complete a corrective Elliott wave structure. Primary wave B within cycle wave y may now be unfolding as an expanded flat correction. There is a good example of this structure on this chart: primary wave B within cycle wave w was an expanded flat from the beginning of March 2016 to the end of May 2016.
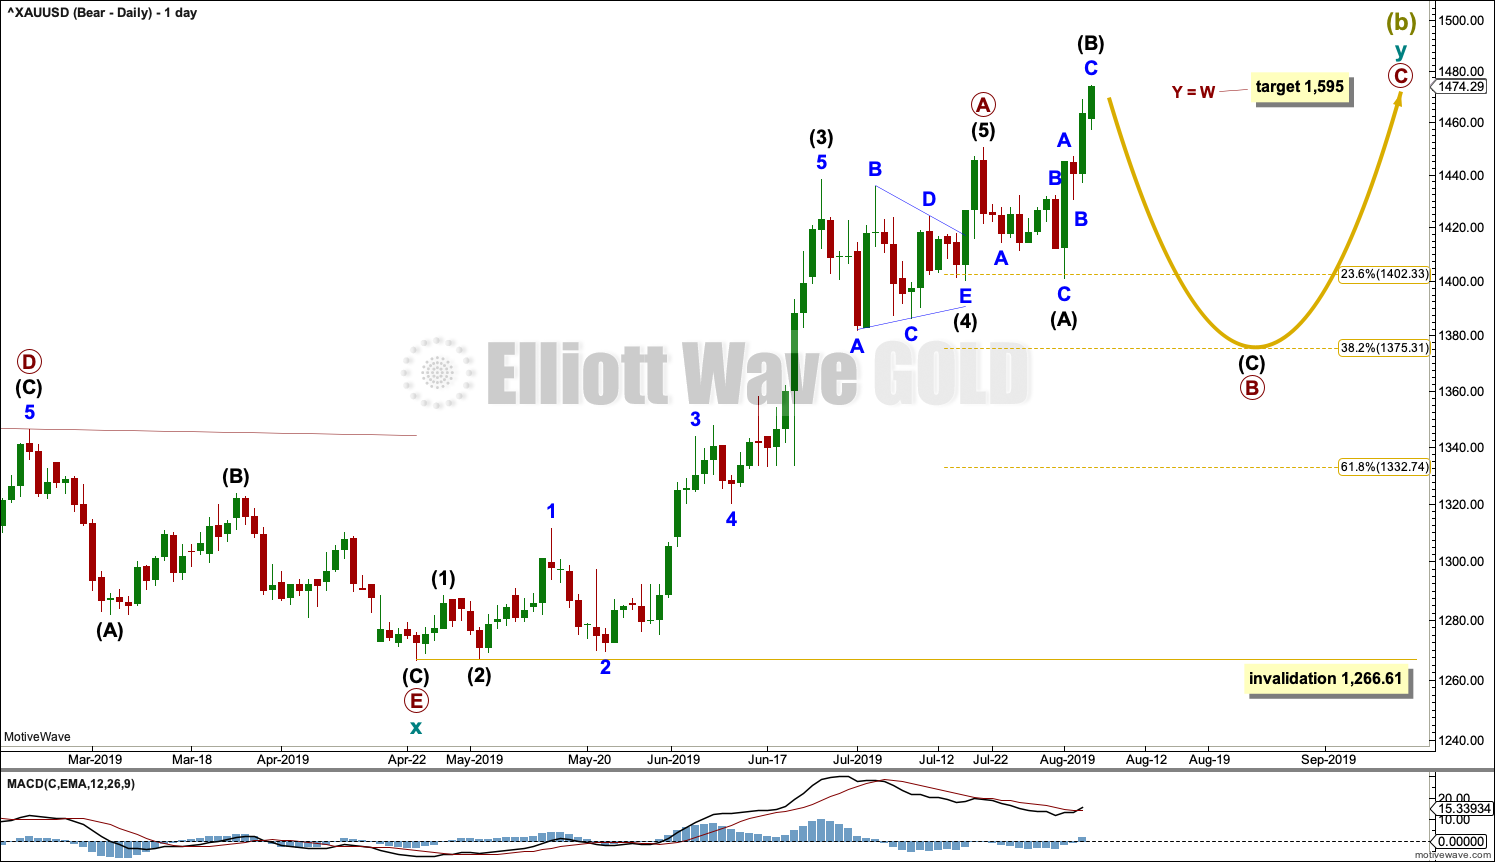
DAILY CHART
Within cycle wave y, primary wave A may now be a complete five wave impulse.
Primary wave B may unfold over a few weeks. Primary wave B may subdivide as any one of more than 23 possible corrective Elliott wave structures. At this stage, it may be a time consuming sideways consolidation as a combination, flat or triangle. The most likely of these possibilities is an expanded flat, which is how it is labelled today. However, the common range for intermediate wave (B) within an expanded flat is up to 1.38 times the length of intermediate wave (A), which was reached at 1,469.40. Intermediate wave (B) is now longer, so the probability of this wave count has decreased and decreases the higher intermediate wave (B) goes.
Primary wave B should exhibit weakness.
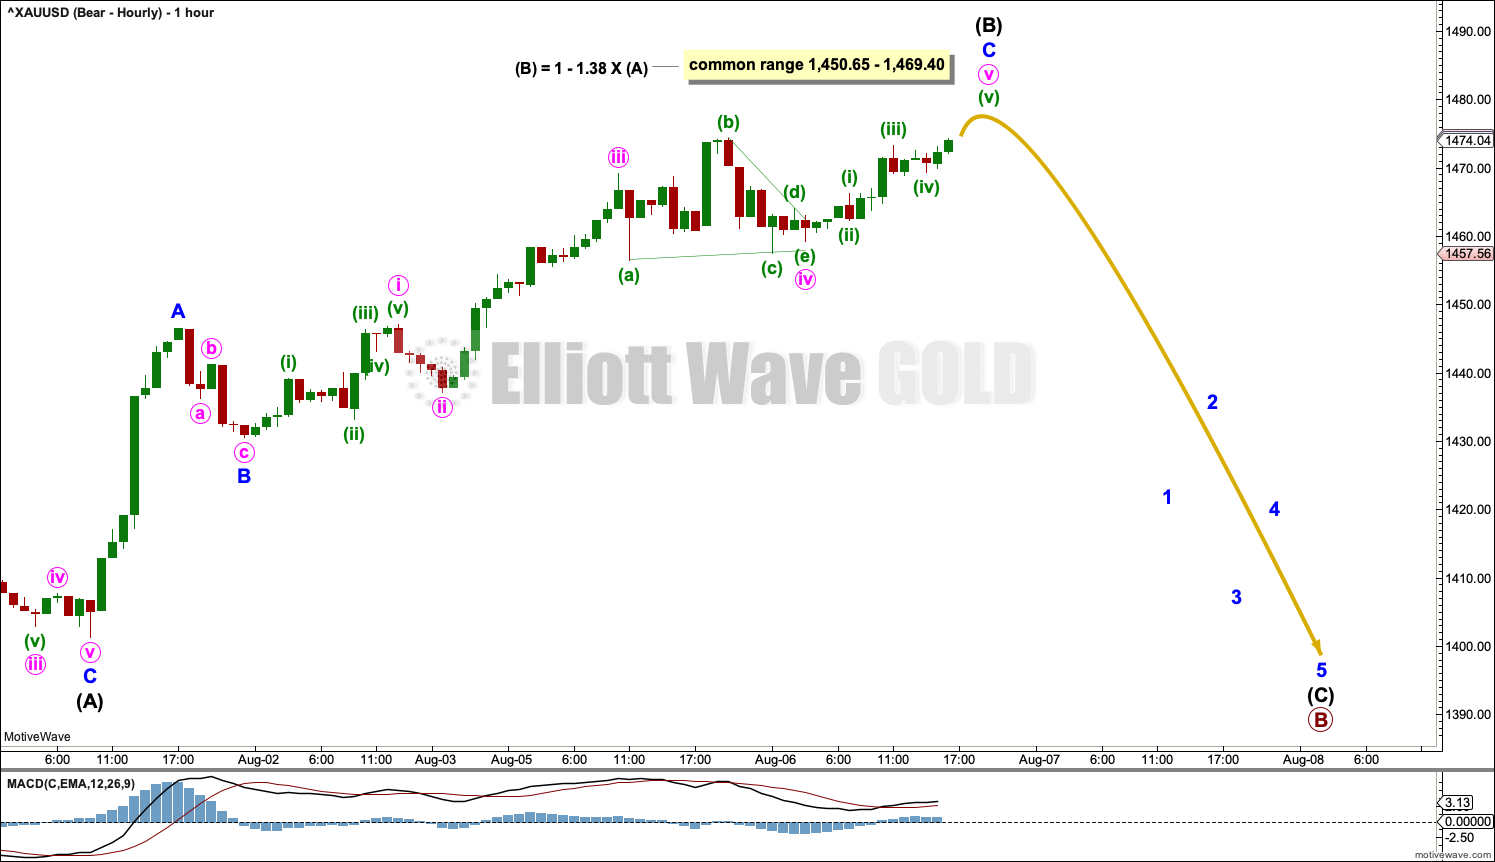
HOURLY CHART
Primary wave B may be unfolding as an expanded flat correction. This is the most common type of flat, and it is a common structure in B wave positions. There is no Elliott wave rule stating a limit for B waves within flats; they may be longer than the common range. They should be identified by technical weakness.
It is possible that intermediate wave (B) may yet move a little higher. There is no short-term upper invalidation point for this wave count at this stage.
Intermediate wave (C) of an expanded flat should move below the end of intermediate wave (A) at 1,401.30 to avoid a truncation and a very rare running flat.
Intermediate wave (C) must subdivide as a five wave structure.
Primary wave B may also be unfolding as a running triangle. This may see sideways movement in an ever decreasing range for another couple of weeks or so.
Primary wave B may also be unfolding as a combination. Within a combination, the first structure may be a complete zigzag labelled intermediate wave (W). The double may be joined by a three in the opposite direction, a zigzag labelled intermediate wave (X). A second structure in a double may now unfold sideways as either a flat or triangle labelled intermediate wave (Y).
BULLISH ELLIOTT WAVE COUNT
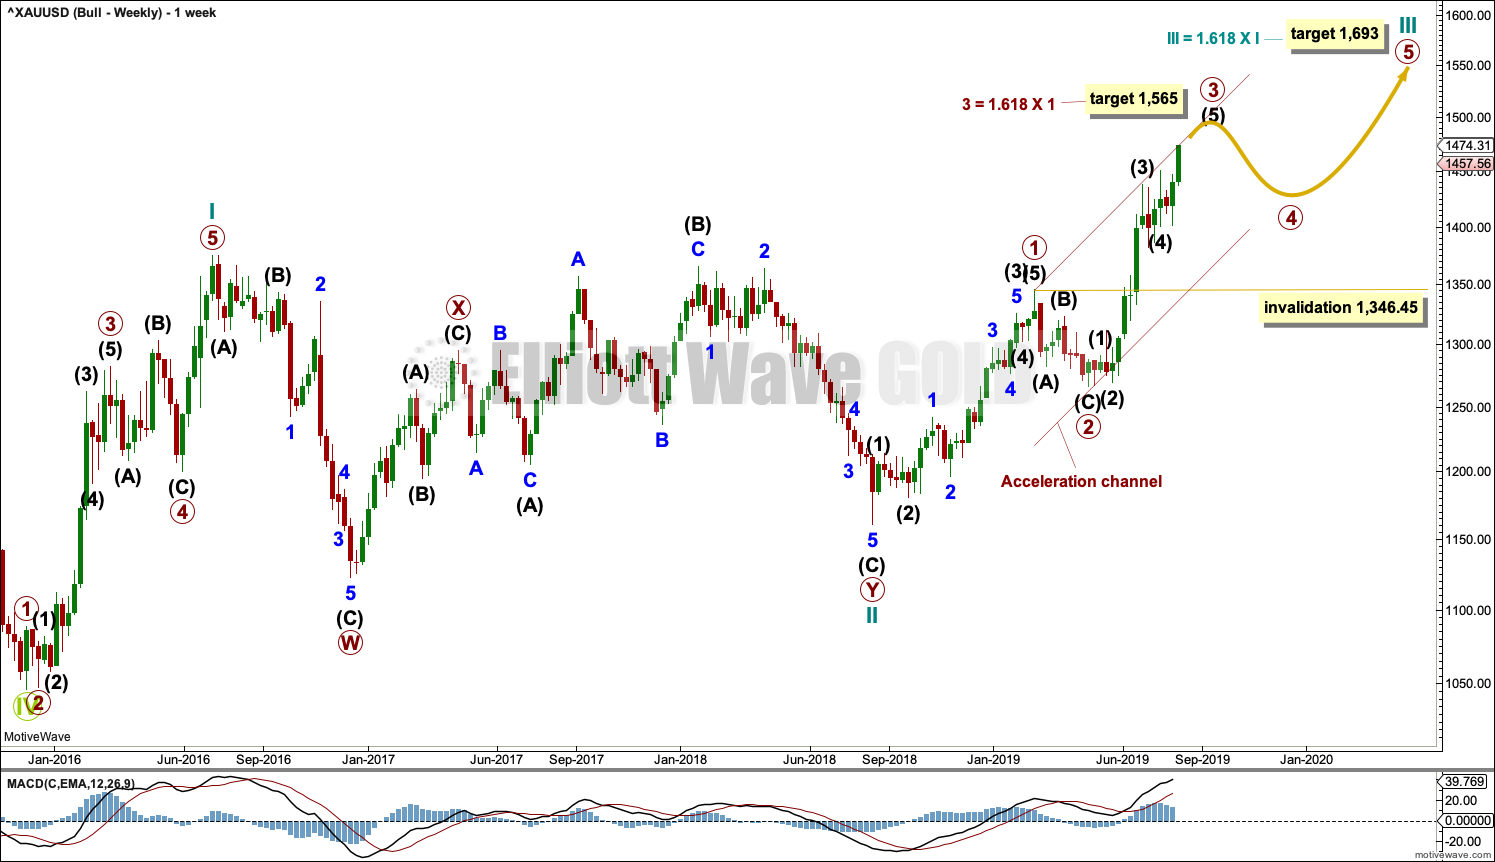
WEEKLY CHART
This wave count sees the the bear market complete at the last major low for Gold in November 2015.
If Gold is in a new bull market, then it should begin with a five wave structure upwards on the weekly chart. However, the biggest problem with this wave count is the structure labelled cycle wave I because this wave count must see it as a five wave structure, but it looks more like a three wave structure.
Commodities often exhibit swift strong fifth waves that force the fourth wave corrections coming just prior and just after to be more brief and shallow than their counterpart second waves. It is unusual for a commodity to exhibit a quick second wave and a more time consuming fourth wave, and this is how cycle wave I is labelled. This wave count still suffers from this very substantial problem, and for this reason bearish wave counts are still considered above as they have a better fit in terms of Elliott wave structure.
Cycle wave II subdivides well as a double combination: zigzag – X – expanded flat.
Cycle wave III may have begun. Within cycle wave III, primary waves 1 and 2 may now be complete. If it continues lower as a double zigzag, then primary wave 2 may not move beyond the start of primary wave 1 below 1,160.75.
Cycle wave III so far for this wave count would have been underway now for 51 weeks. It may be beginning to exhibit some support from volume and increasing ATR. If this increase continues, then this wave count would have some support from technical analysis.
Redraw an acceleration channel about primary waves 1 and 2: draw the first trend line from the end of primary wave 1 to the last high, then place a parallel copy on the low of primary wave 2. Keep redrawing the channel as price continues higher. When primary wave 3 is complete, then this channel would be drawn using Elliott’s first technique about the impulse. The lower edge may provide support.
Primary wave 4 may not move into primary wave 1 price territory below 1,346.45. Because the data used for this analysis is cash market data no overlap between primary waves 4 and 1 should be allowed. The invalidation point is absolute.
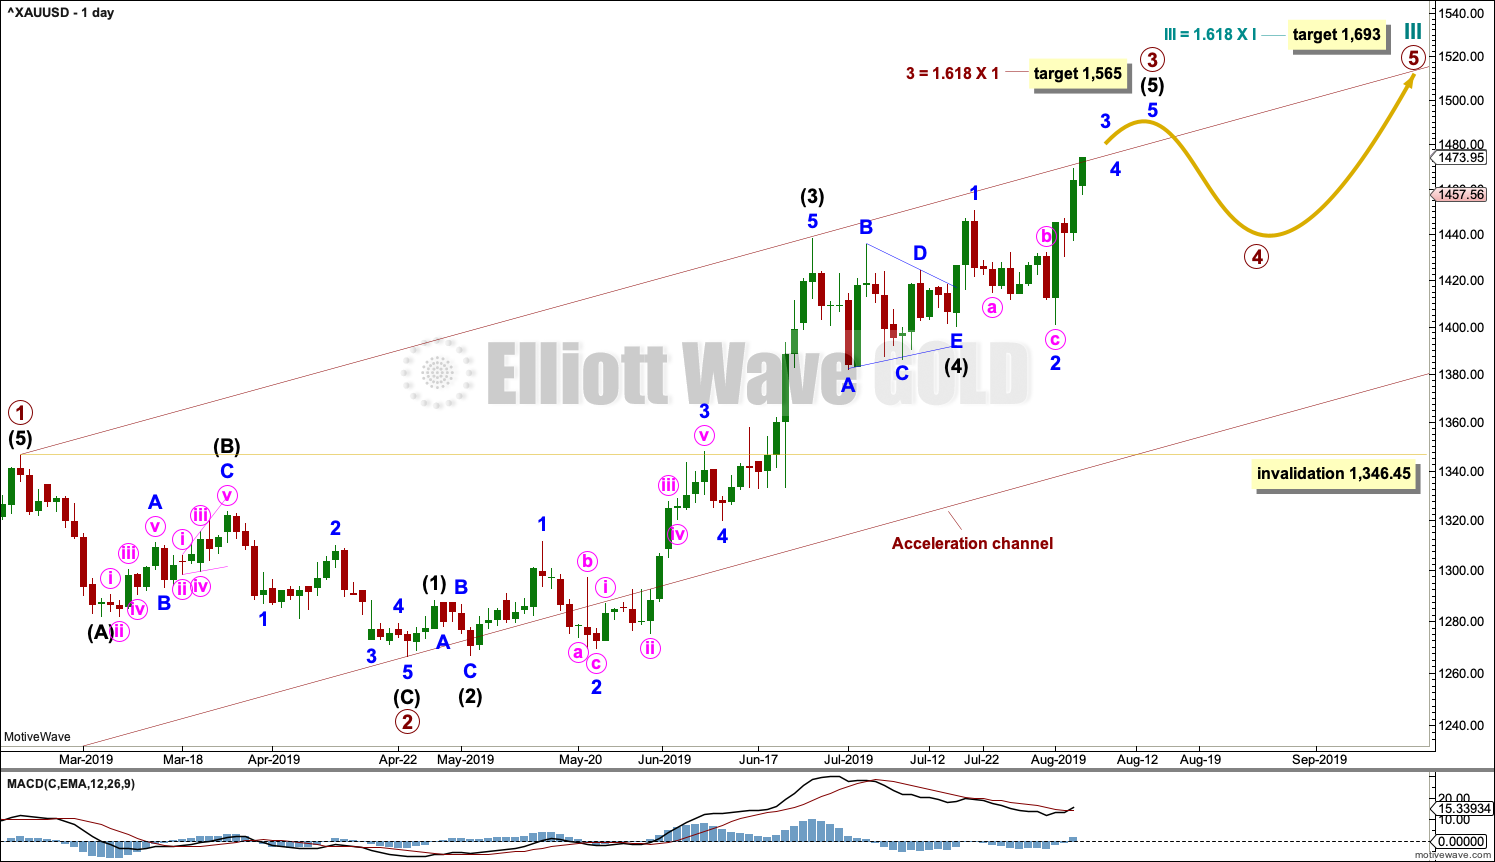
DAILY CHART
Primary wave 3 may only subdivide as an impulse. Within the impulse, intermediate waves (1) through to (4) are all now complete. The structure of intermediate wave (5) is now incomplete, so it needs to move higher.
When it arrives, then primary wave 4 may not move into primary wave 1 price territory below 1,346.45.
Because intermediate wave (5) is a fifth wave to end a third wave one degree higher, at primary degree, it may exhibit swift strong movement. It may end with a blow off top.
HOURLY CHART
Intermediate wave (5) may only subdivide as a five wave structure, either an impulse or an ending diagonal. Fifth waves to end third waves one degree higher, as this one is, almost always subdivide as impulses (that is what shall be expected).
Within intermediate wave (5), minor waves 1 and 2 may now both be complete.
Minor wave 3 may only subdivide as an impulse. Within minor wave 3, minute waves i and ii may now be complete.
Within minute wave iii, minuette waves (i) and (ii) may be complete.
This wave count now expects there may very soon be a series of three overlapping first and second waves within intermediate wave (5).
Minuette wave (ii) may not move beyond the start of minuette wave (i) below 1,430.52.
TECHNICAL ANALYSIS
MONTHLY CHART
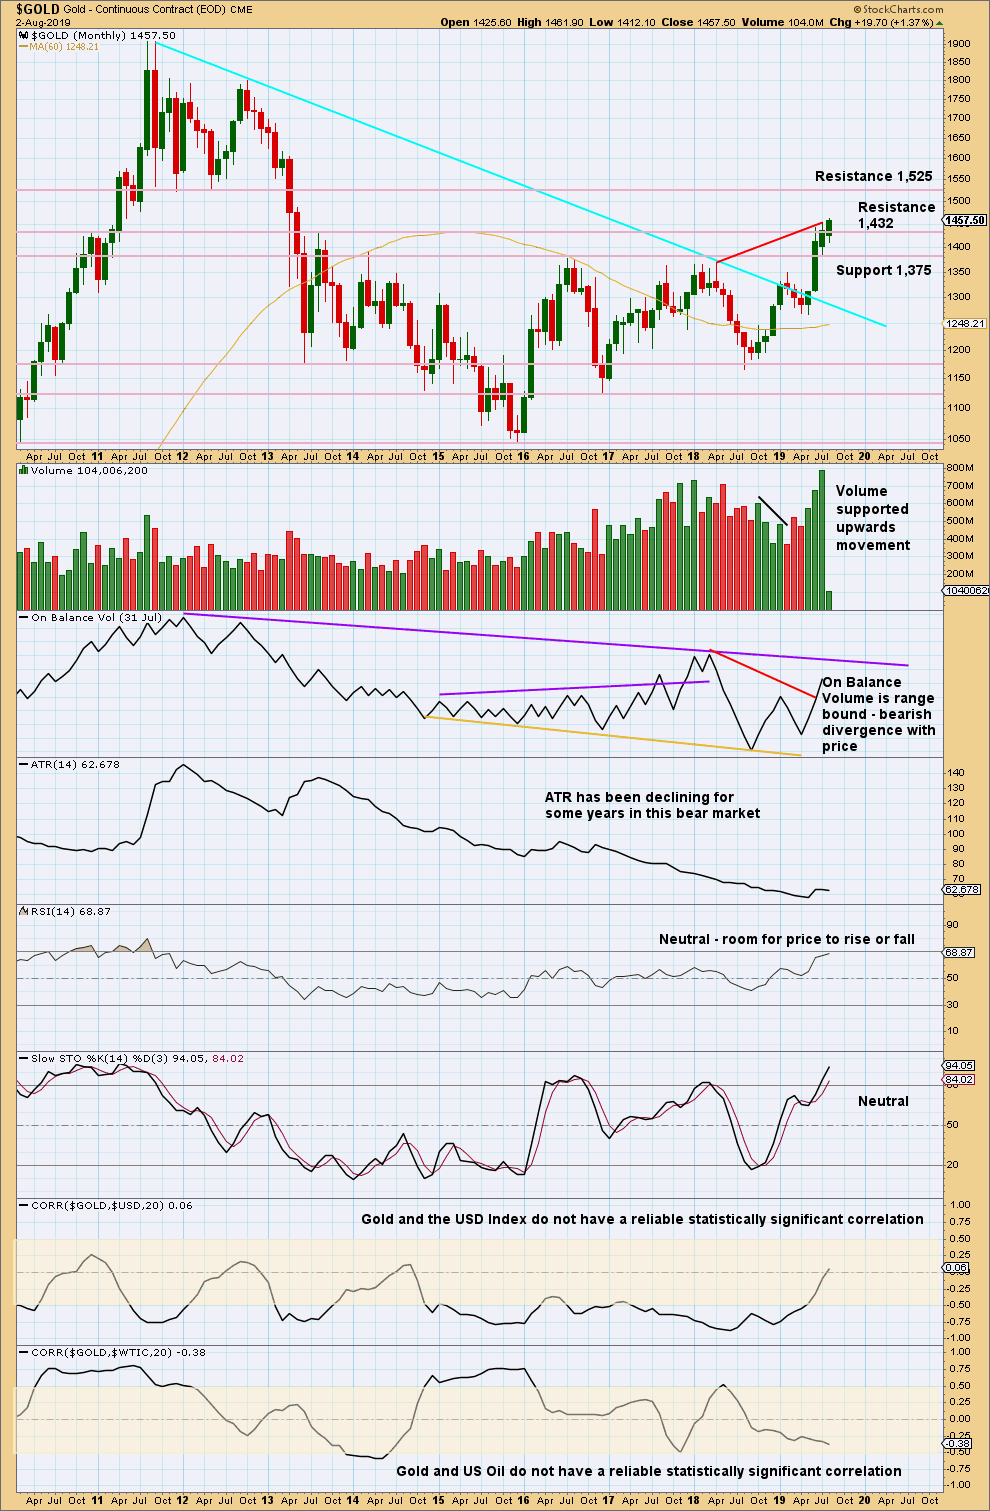
Click chart to enlarge. Chart courtesy of StockCharts.com.
Gold has effected an upwards breakout above multi-year resistance and above the cyan bear market trend line. Look for next resistance identified on the chart.
The new high in price above prior highs for March / April 2018 have not been matched by new highs for On Balance Volume. This divergence is bearish and supports a bearish Elliott wave count. This divergence may be given a little weight because it is strong and evident on the monthly chart.
WEEKLY CHART
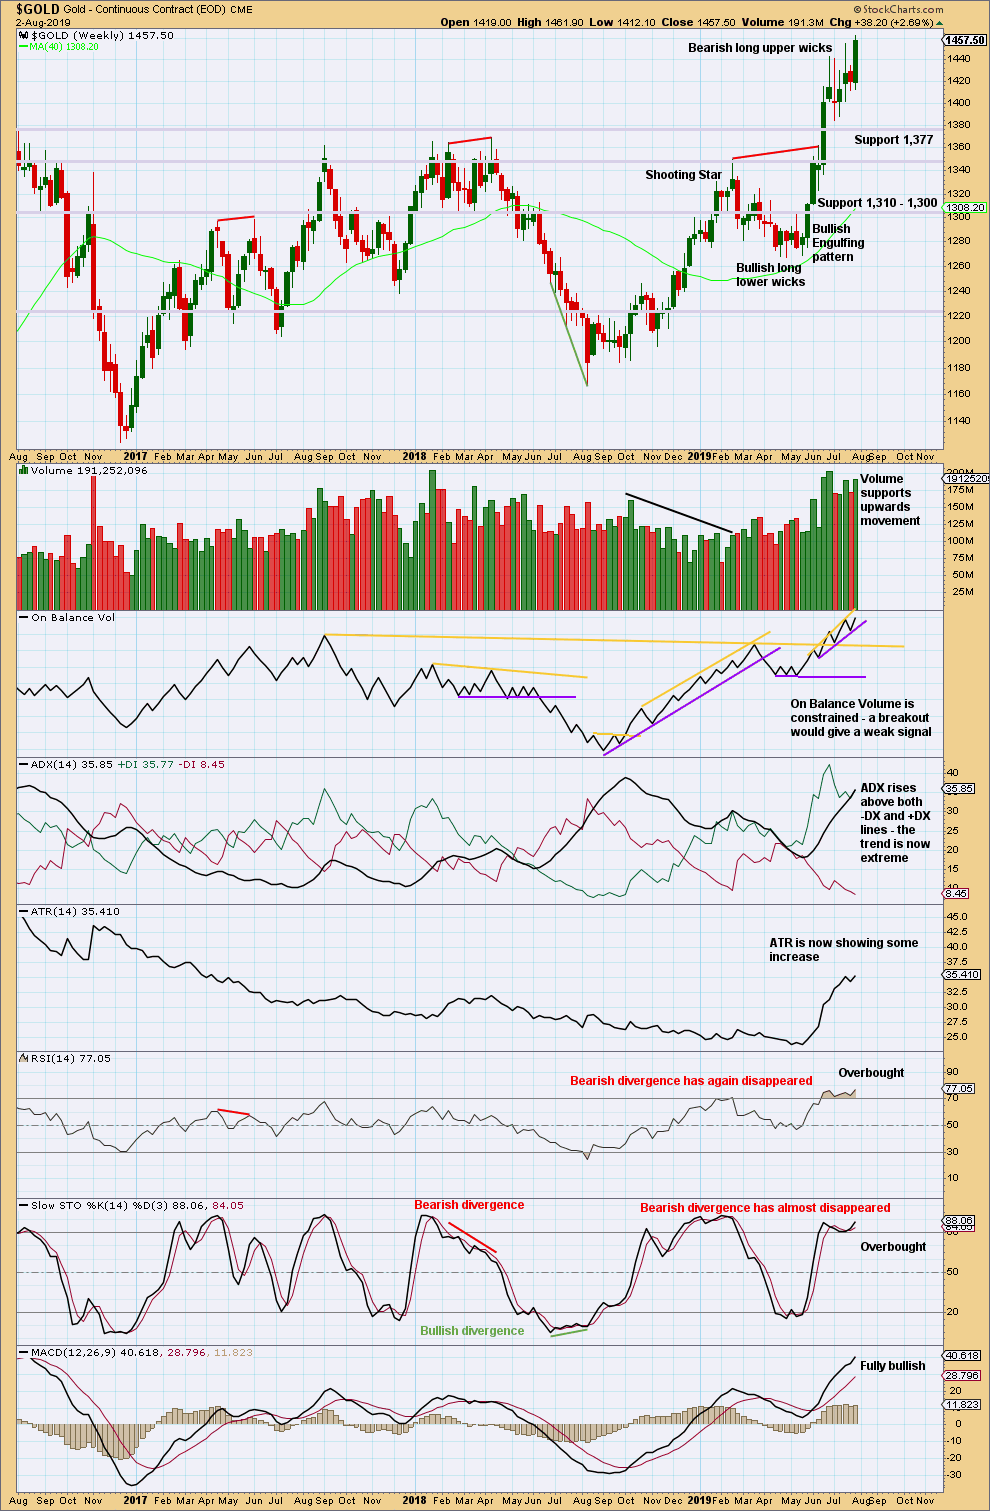
Click chart to enlarge. Chart courtesy of StockCharts.com.
The bottom line remains that a multi year breakout occurred a few weeks ago, and it occurred with strength in volume.ADX is now extreme and conditions are overbought. Some consolidation or pullback may reasonably be expected here to relieve extreme conditions.
The last weekly candlestick closes strong with support from volume. This is not however matched by strength on the daily chart.
DAILY CHART
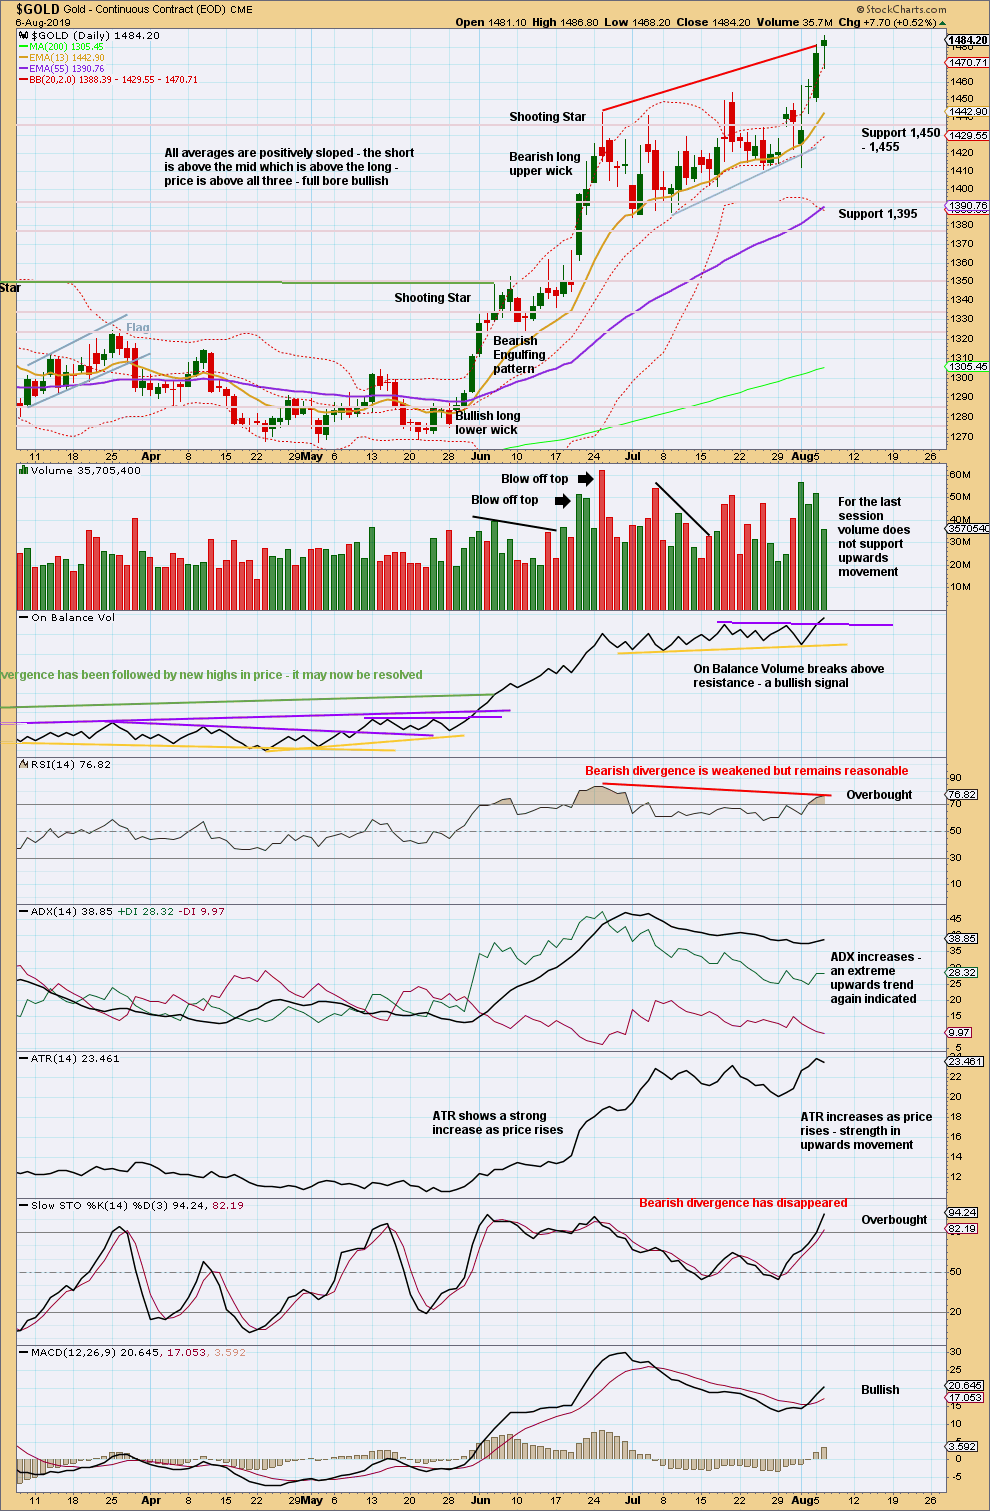
Click chart to enlarge. Chart courtesy of StockCharts.com.
Price has closed above resistance with a little support from volume.
However, overall volume is now showing some decline as price rises. The breakout is still a little suspicious.
Look for support in the first instance at last resistance, which is now at 1,455. Assume an upwards breakout may have occurred while price remains above this point. If price closes back below this point, the breakout may be then considered false. Risk may be judged today to be at 1,455 for long positions.
The divergence between price and On Balance Volume is no longer there and between price and RSI has weakened. The trend remains extreme, but may yet continue further before it ends.
GDX WEEKLY CHART
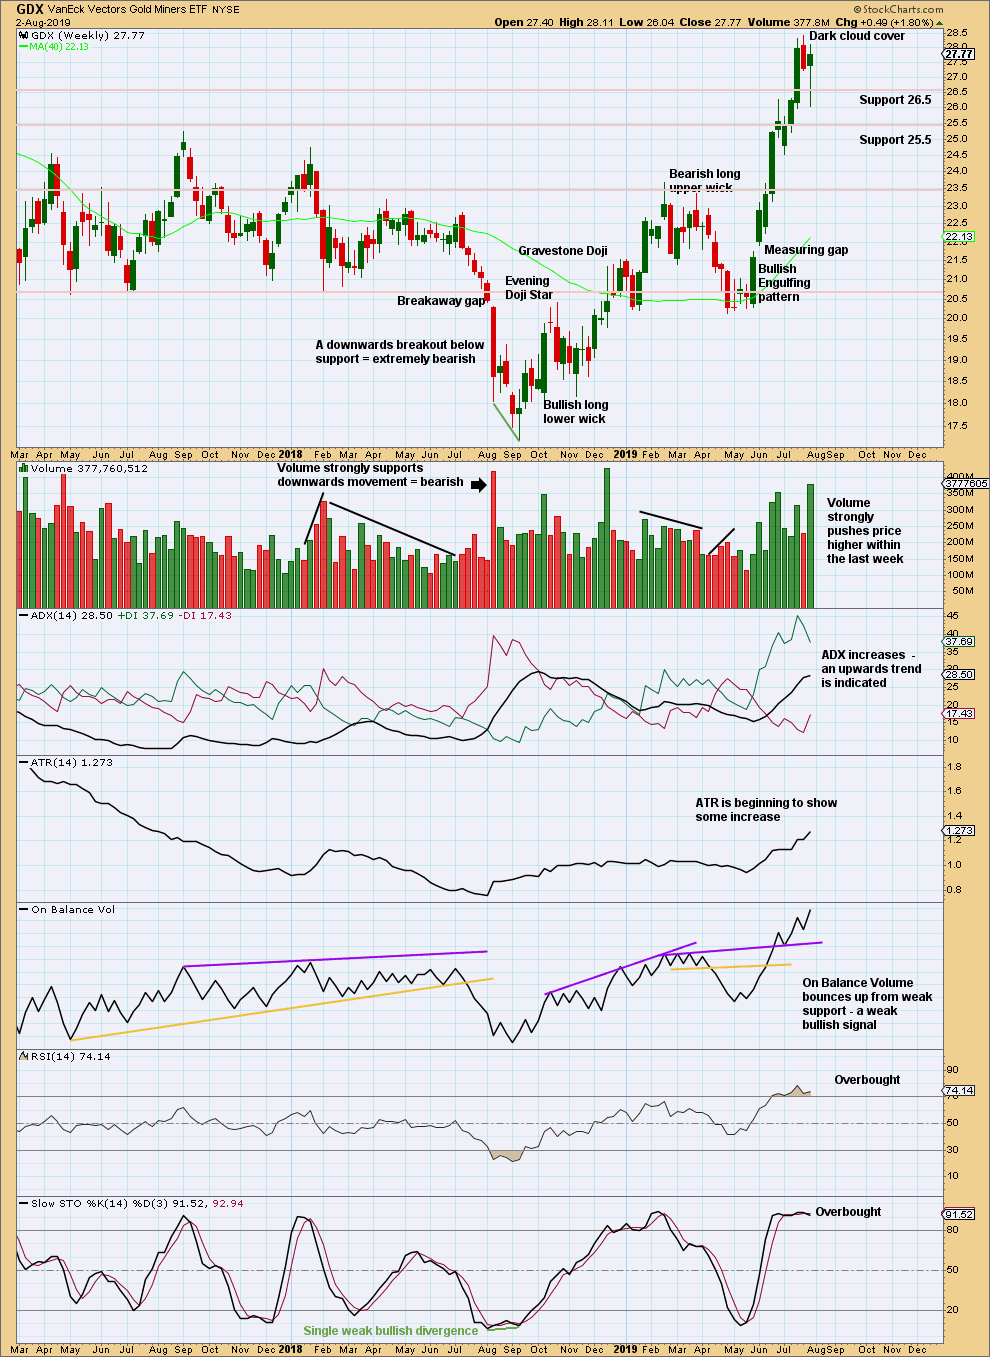
Click chart to enlarge. Chart courtesy of StockCharts.com.
Last week completes a lower low and lower high, but the candlestick has closed green and the balance of volume was upwards. Upwards movement within the week may have support from volume, but daily volume bars would better be analysed to draw a conclusion here.
The upwards trend is not yet extreme. A long lower wick on this weekly candlestick is bullish.
GDX DAILY CHART
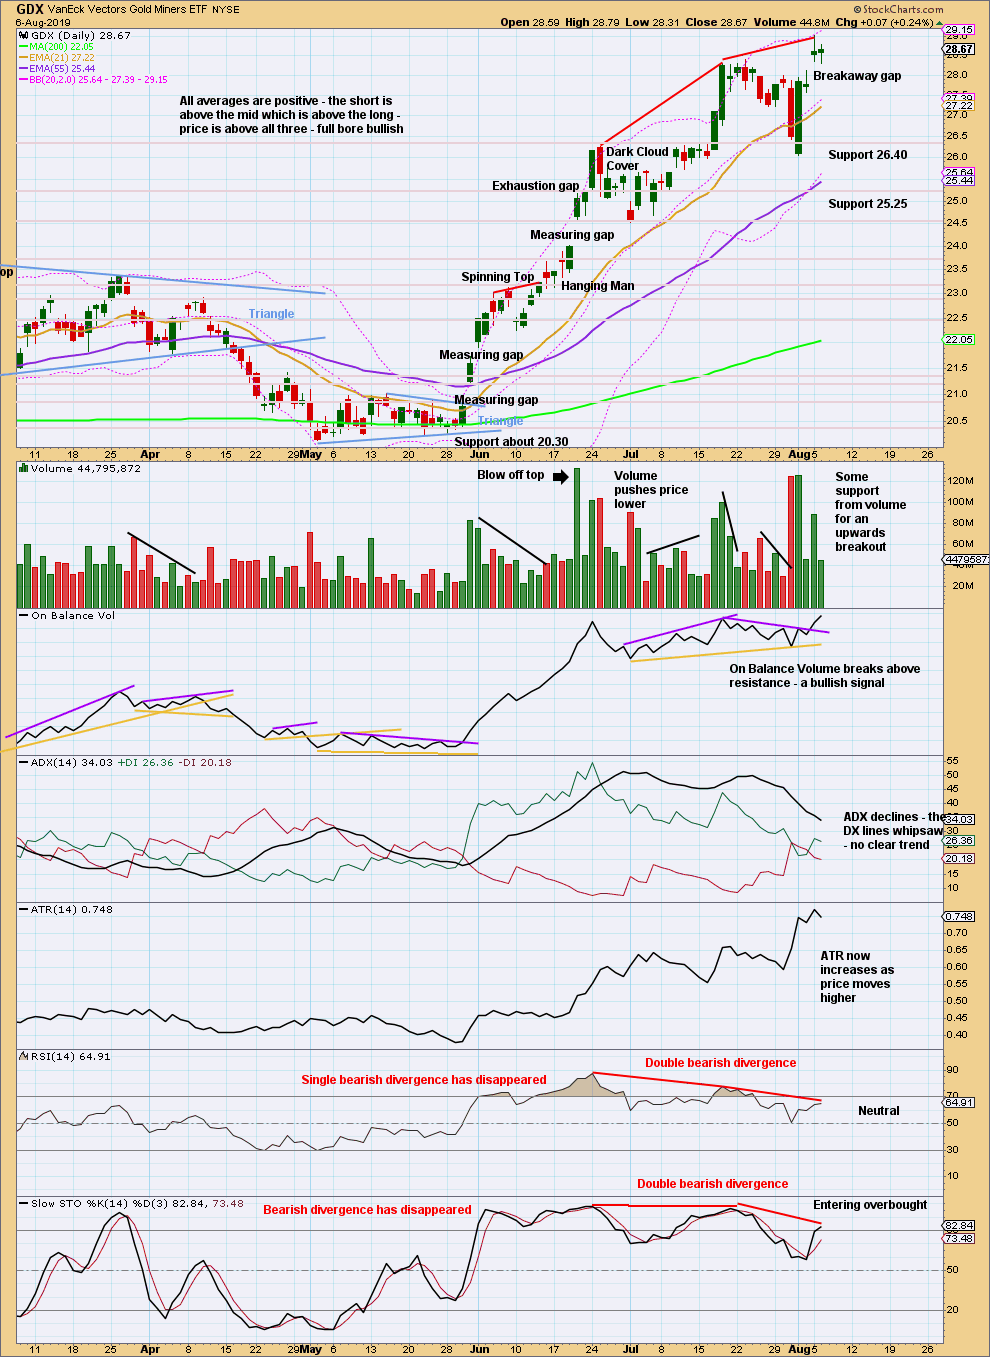
Click chart to enlarge. Chart courtesy of StockCharts.com.
An upwards breakout yesterday has support from volume. If the upwards breakout holds, then price should not close the breakaway gap. Support may be at the lower edge of the gap at 28.11. Assume price will continue higher while it remains above this point.
If price makes a new low below 28.11 and closes the gap, it would be then correctly named an exhaustion gap. A pullback, consolidation or trend change may then be expected.
The trend remains extreme and conditions have reached overbought and then exhibited bearish divergence with price. Normally (not always) this cluster of conditions is seen at or very near a high.
Published @ 05:55 p.m. EST.
—
Careful risk management protects your trading account(s).
Follow my two Golden Rules:
1. Always trade with stops.
2. Risk only 1-5% of equity on any one trade.
—
New updates to this analysis are in bold.

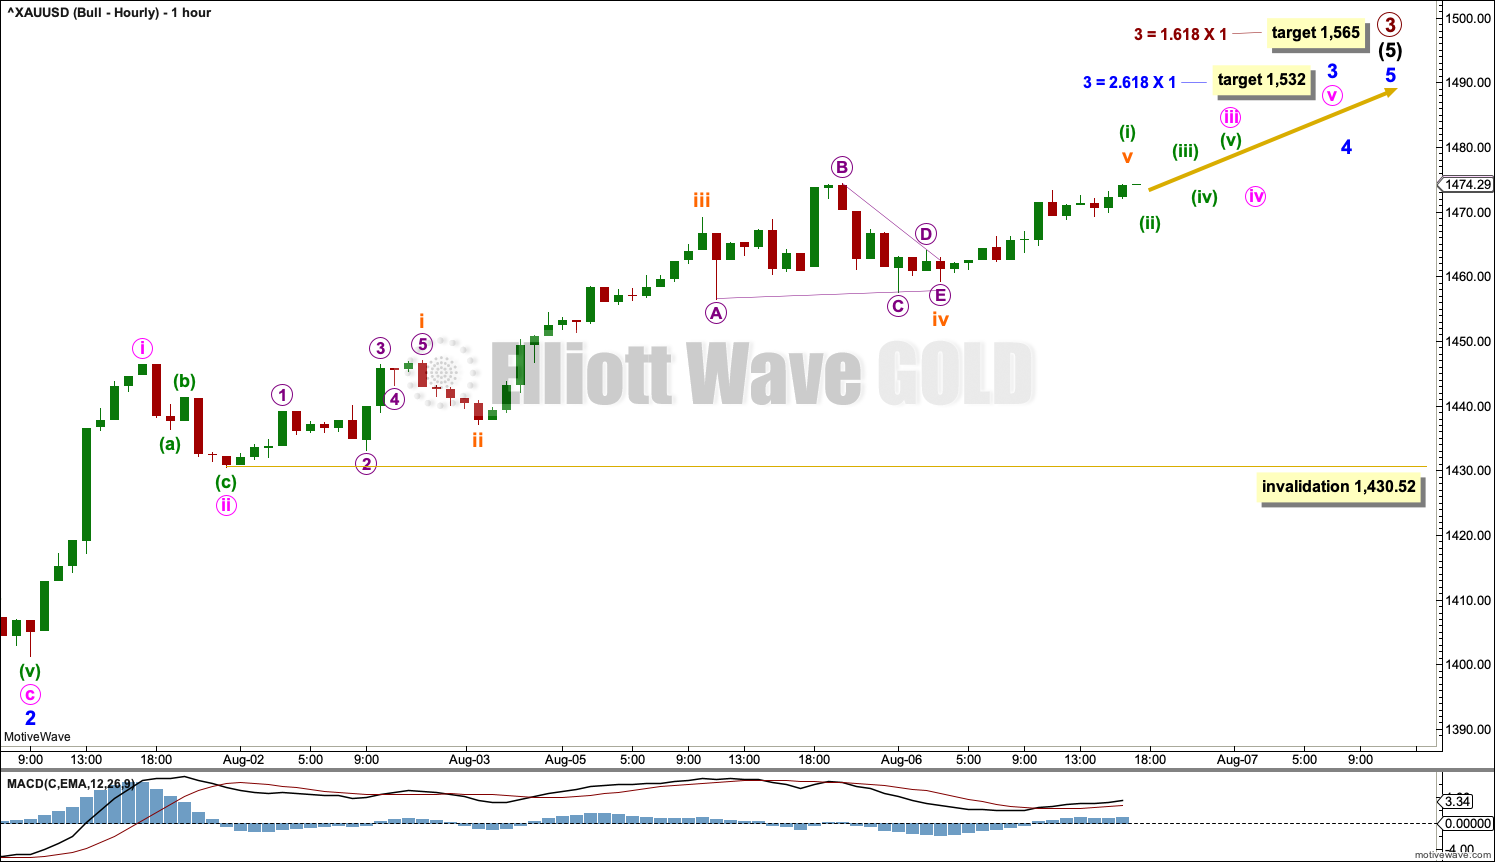
Bullish hourly chart updated:
The middle of the third wave may now have passed.
For this count, be aware of the possibility of a blow off top approaching now quite soon.
Bearish daily chart updated:
The correction for primary B now has to be labelled as complete. Price has moved too high and shows too much strength for this to be a continuation of that.
It was remarkably shallow and brief.
This count needs more upwards movement as well. After the structure for primary wave C may be complete this count expects a very significant trend change.
The gap up today is a measuring gap. These aren’t usually closed and they can be used to calculate targets. The target from this one is 1,555
Please note: both charts expect more upwards movement. What happens after a high is finally reached may tell which count is correct.
If we see a strong bearish candlestick pattern at a high, and then strong downwards movement, then a high may be in place.
But if we see just a sideways drift, then the bullish count would be correct.
Hi Lara,
I know that gold and silver don’t correlate perfectly. However, the larger degree trends are almost always the same. If silver reaches 17.78, would it be reasonable to conclude that the bull count is likely for both markets?
Thanks for the updates Lara, they make it clear how we can position future entries and handle open positions. I am sure the traders will agree. The updates are very helpful. I am thinking of putting a short up there near 1533 on Gold and watching Silver for a short entry,.
Andrew:
“If silver reaches 17.78, would it be reasonable to conclude that the bull count is likely for both markets?”
Yes, I think that would be reasonable.
Lara: Conditions remain very extreme.
It is market saying: Market can remain extreme longer than one thinks.
I have seen market remains extreme for months upto six months RSI above 90 and price keeps rising.
Short such market at your financial peril specially Gold.
Gold should never be short.
That’s true. Conditions can remain very extreme and yet price can continue for a considerable distance before it turns.
Also, conditions can reach very extreme and price can turn fairly quickly.
We don’t know which scenario is going to play out. We only need to heed the warning and exercise caution.
I do hope that makes sense?
The trend is straight up. Why do people like to short it? If they choose to go against the trend, the position size needs to be small and stop needs to be tight… It should be very systematic and discipline… Nobody has a crystal ball…
Not a fun after hours trading session being short. Half my position has been stopped out. I’m still waiting to see how tomorrow morning pans out considering that an overnight spike followed by a morning decline could still happen. I certainly wish I were on the long side of this trade from 1430 onward however my p&l this year is extremely strong and I’m willing to give this a wide berth. Good luck everyone.
All of us that follow Lara and listen have done very well. She warned you to set your stop loss at break even on this board. Silver is in the beginning of a breakout and you are now in an upside down position. Don’t get cocky listen to Lara she knows what she is doing. This one is all on you.
Andrewlee,
I’m very often in upside down positions, especially when I enter initial position sizes. Basis for Dec silver is 16.55 short and 1470 for Dec gold. This isn’t end of the world for me. I rode silver up from 15.15 to 16.00. I went long gold at 1270 to 1350. I caught a gold short from 1430 to 1401 and bottom ticked it for another 25 up. I was just short Dow for 700 pts down. Anyway, I’m out of half the trade, since your’re right, Lara’s bull count might play out. I’ve had a very nice run this year, and I take 100% ownership for my trading. Also, I don’t use any one analyst exclusively, and neither should you.
You haven’t replied to my previous comment on last post about COT reports… I thought I offered up some decent info for you that might help for the future when analyzing it. There is never a situation where there are “more shorts”. The nature of futures is always 1 long for every 1 short. They are always equal. Always. It’s the buckets of holders that changes and right now the commercials are short and the specs/funds are long. This is very extreme in gold right now… About as extreme as it gets.
Also, there is no such thing as a break even stop unless you catch a market perfectly. You are always risking something when entering a new trade, which this short position was.
I offer up my trading as a way for me to be held accountable and potentially to show others that trading futures can be very profitable. 15 years of trading has taught me a lot. Maybe there is a better way for me to do this.
Corey
Thanks for being so open Corey please keep up your comments on your trades. One wrong trade doesn’t make a year.
Everyone on here has been stuck in a trade going the wrong way. You’re clever and experienced enough to cope with it.
Good luck.
That depends on what that one trade is. Some of the historic bond trading kings have been ruined by one bad trade. Corey is correct about my COT comment being technically wrong. However, silver is not over extended like gold and I would not want to be holding a short position in silver after a breakout has started. Whether or not the bear count invalidates who knows at this point. However, that possibility is rapidly increasing. I also, disagree with Corey I don’t need to follow other analysts. I do well following Lara. Oh, and Corey I don’t trade futures because I don’t want to risk any more than my principle investment. I also, don’t have enough capital to adequately defend a position. The volatile markets are controlled by players that know how to take people out by busting through there stops. I prefer 3X ETF’s for safety. I would hate to get called out in a losing bet.
Andrewlee
I have proper money management and it doesn’t matter what that trade is.
Also if you trade futures with a guaranteed stop lose then you can’t lose any more than your initial investment. I only risk £10-£25 on a bet and that’s all I will lose, many of them I turn into £500+
If I lose one trade it doesn’t matter because of money management. I don’t touch anything that could go against me big time.
can you provide a chart of the breakout in silver. I agree it has more room to run than gold. The commercials were heavy neg gold (and wrong so far).
I will do, on the post for Silver.
Lara, you last published your Grand SuperCycle chart and a monthly which dated price action back to 2000, about 3 years ago. Do you think you could update those to show recent activity ? These are exciting times, yes?
Sure, but they’ll barely change.