
Upwards movement continues as the bullish Elliott wave count has expected. The bearish Elliott wave count remains valid, and the target zone has been widened.
Summary: The upwards trend is extreme. Divergence is weakening. Volume and On Balance Volume are bullish.
The bullish Elliott wave count expects a large interruption to the trend to begin about 1,565.
The bearish Elliott wave count expects the upwards trend to end about 1,582 to 1,595.
Grand SuperCycle analysis is here.
Monthly charts were last published here with video here.
BEARISH ELLIOTT WAVE COUNT
WEEKLY CHART
Click chart to enlarge.
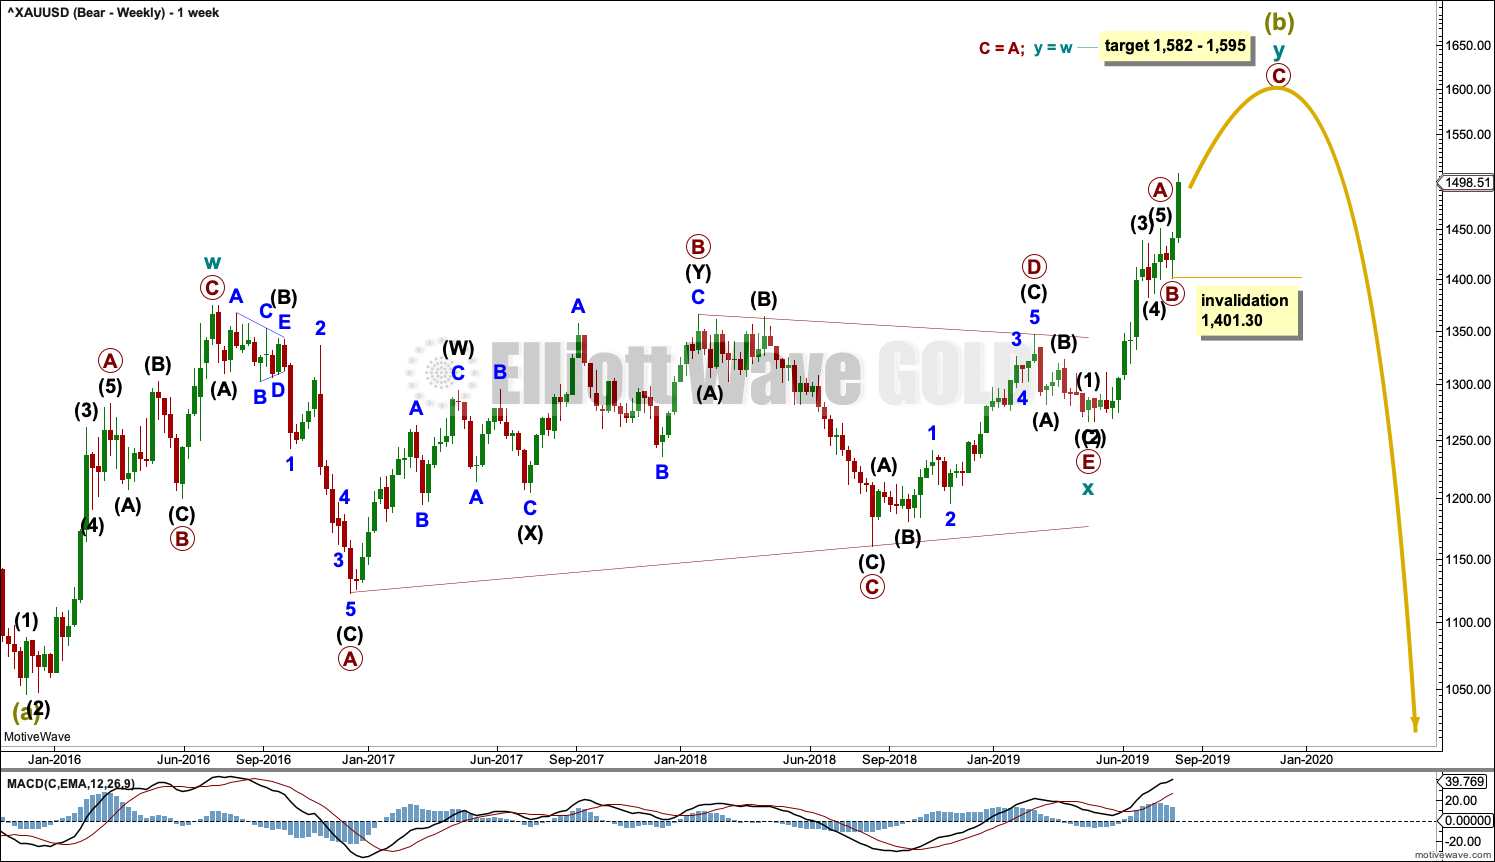
It remains possible that Super Cycle wave (b) is an incomplete double zigzag.
The first zigzag in the double is seen in the same way for both bearish wave counts, a zigzag labelled cycle wave w.
This bearish wave count sees cycle wave x as regular contracting triangle. Cycle wave y must subdivide as a zigzag if Super Cycle wave (b) is a double zigzag. Within cycle wave y, primary waves A and B may now be complete. No second wave correction within primary wave B may move beyond its start below 1,401.30.
DAILY CHART
Click chart to enlarge.
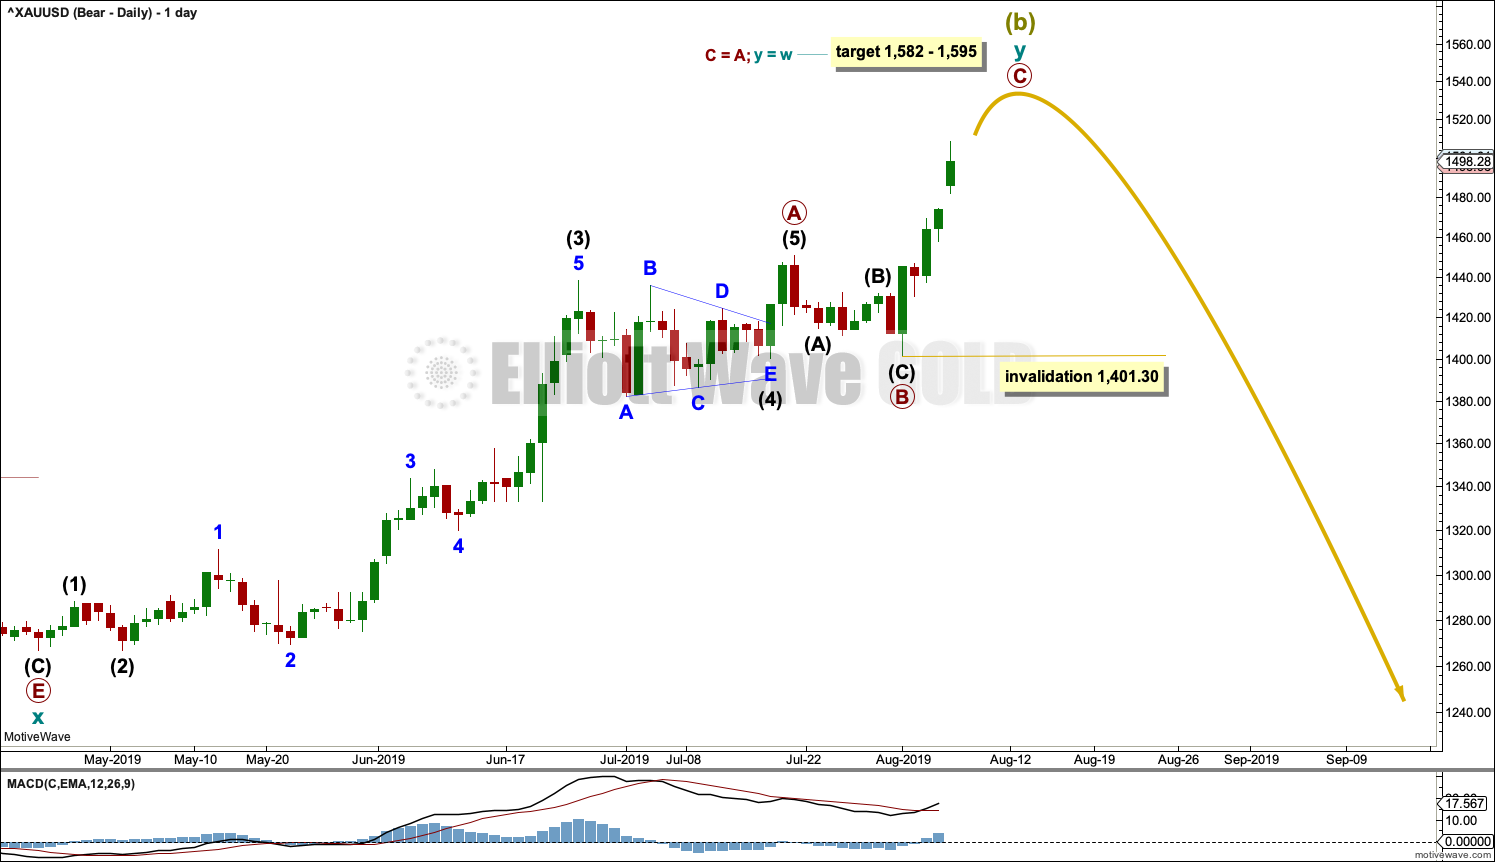
Upwards movement has now moved too far and is too strong to be part of primary wave B. Primary wave B must have been over as a relatively brief and shallow zigzag.
Primary wave C must complete as a five wave structure. So far intermediate waves (1) and (2) may be complete. Intermediate wave (4) may not move into intermediate wave (1) price territory below 1,446.51 (this price point is taken from the hourly chart).
The target is widened to a zone. When intermediate waves (3) and (4) may be complete, then the target calculation may be added to at intermediate degree. At that stage, it may be narrowed or change.
HOURLY CHART
Click chart to enlarge.
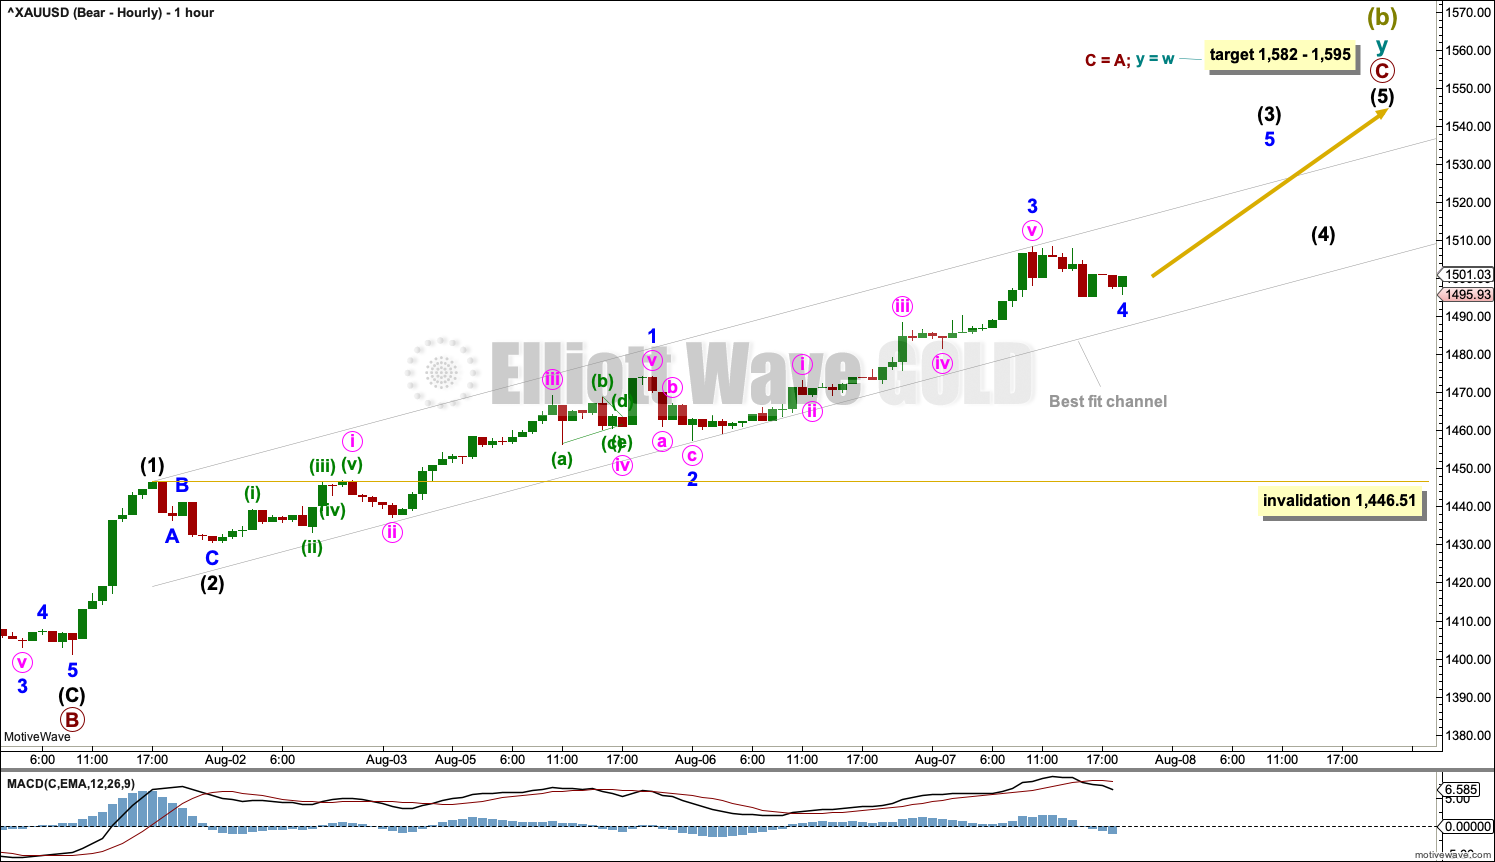
Primary wave C must complete as a five wave structure, most likely an impulse, which is what it looks to be unfolding as.
A best fit channel is drawn about primary wave C. When the channel is strongly breached by downwards movement, then primary wave C may be complete.
BULLISH ELLIOTT WAVE COUNT
WEEKLY CHART
Click chart to enlarge.
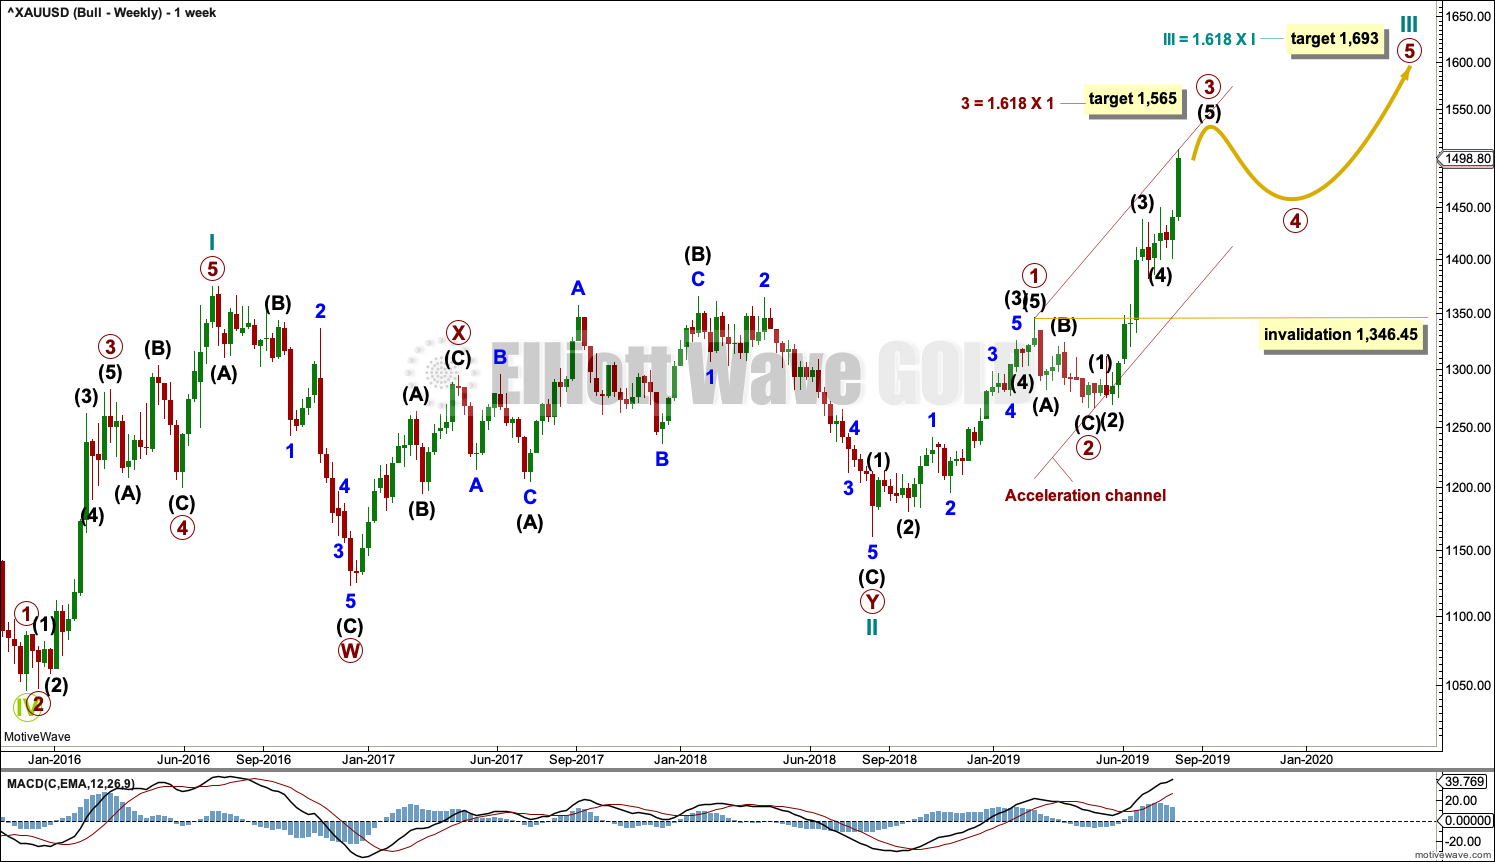
This wave count sees the the bear market complete at the last major low for Gold in November 2015.
If Gold is in a new bull market, then it should begin with a five wave structure upwards on the weekly chart. However, the biggest problem with this wave count is the structure labelled cycle wave I because this wave count must see it as a five wave structure, but it looks more like a three wave structure.
Commodities often exhibit swift strong fifth waves that force the fourth wave corrections coming just prior and just after to be more brief and shallow than their counterpart second waves. It is unusual for a commodity to exhibit a quick second wave and a more time consuming fourth wave, and this is how cycle wave I is labelled. This wave count still suffers from this very substantial problem, and for this reason bearish wave counts are still considered above as they have a better fit in terms of Elliott wave structure.
Cycle wave II subdivides well as a double combination: zigzag – X – expanded flat.
Cycle wave III may have begun. Within cycle wave III, primary waves 1 and 2 may now be complete. If it continues lower as a double zigzag, then primary wave 2 may not move beyond the start of primary wave 1 below 1,160.75.
Cycle wave III so far for this wave count would have been underway now for 51 weeks. It may be beginning to exhibit some support from volume and increasing ATR. If this increase continues, then this wave count would have some support from technical analysis.
Redraw an acceleration channel about primary waves 1 and 2: draw the first trend line from the end of primary wave 1 to the last high, then place a parallel copy on the low of primary wave 2. Keep redrawing the channel as price continues higher. When primary wave 3 is complete, then this channel would be drawn using Elliott’s first technique about the impulse. The lower edge may provide support.
Primary wave 4 may not move into primary wave 1 price territory below 1,346.45. Because the data used for this analysis is cash market data no overlap between primary waves 4 and 1 should be allowed. The invalidation point is absolute.
DAILY CHART
Click chart to enlarge.
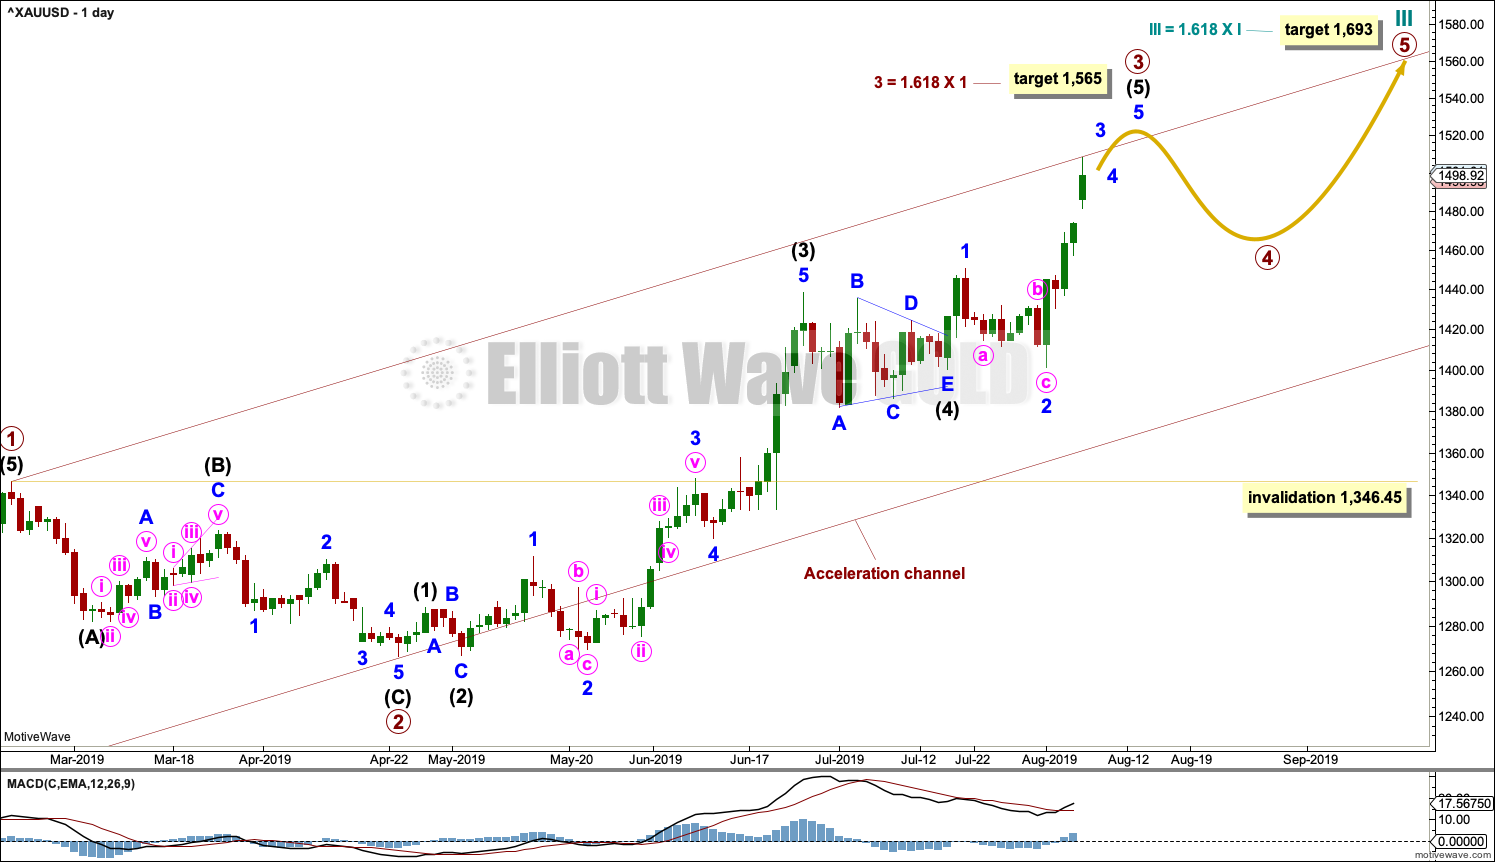
Primary wave 3 may only subdivide as an impulse. Within the impulse, intermediate waves (1) through to (4) are all now complete. The structure of intermediate wave (5) is now incomplete, so it needs to move higher.
When it arrives, then primary wave 4 may not move into primary wave 1 price territory below 1,346.45.
Because intermediate wave (5) is a fifth wave to end a third wave one degree higher, at primary degree, it may exhibit swift strong movement. It may end with a blow off top.
HOURLY CHART
Click chart to enlarge.
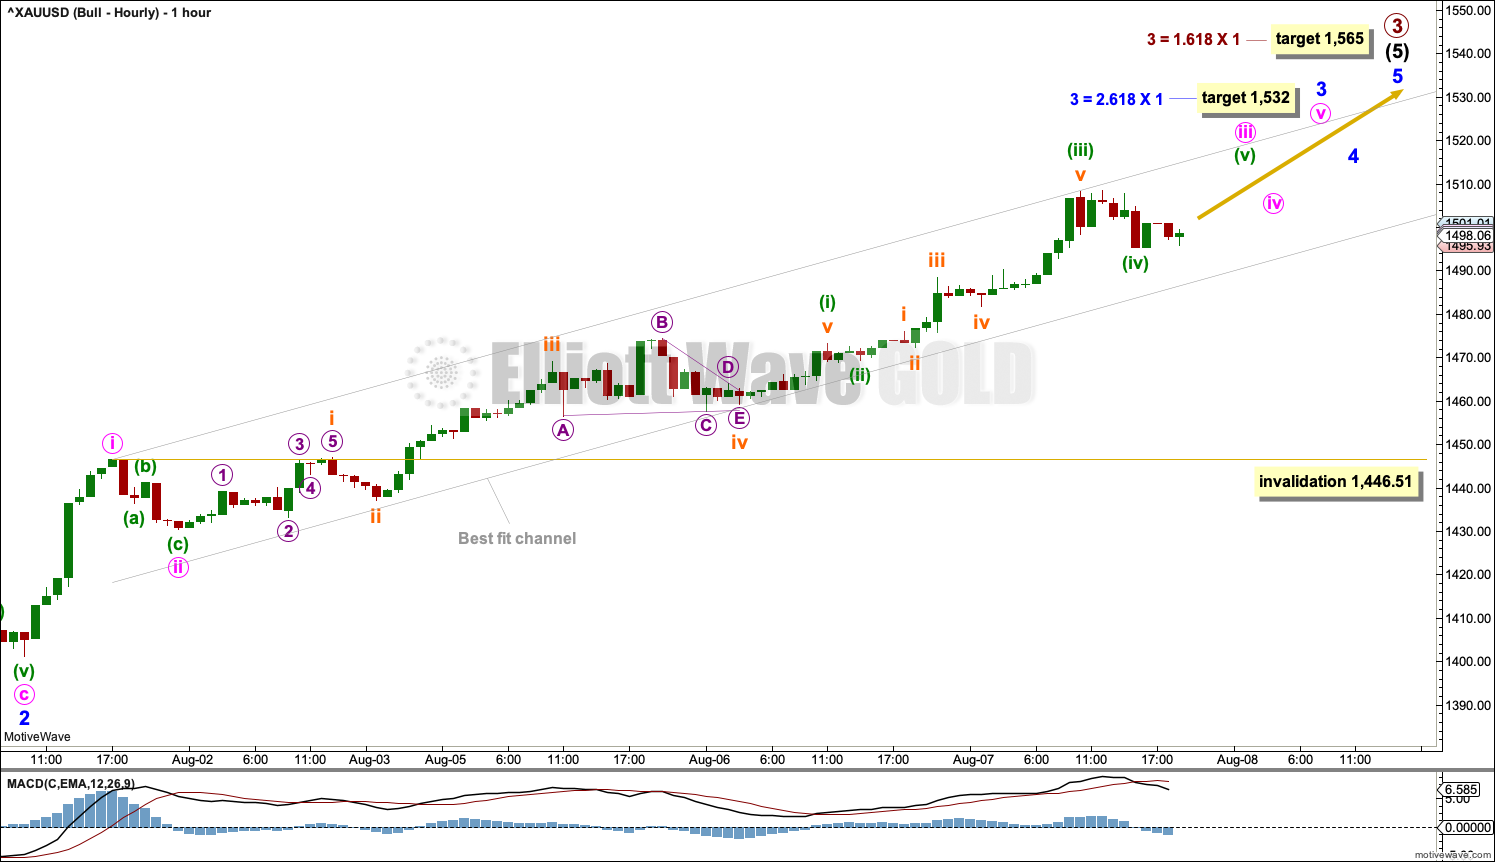
Intermediate wave (5) may only subdivide as a five wave structure, either an impulse or an ending diagonal. Fifth waves to end third waves one degree higher, as this one is, almost always subdivide as impulses (that is what shall be expected).
Within intermediate wave (5), minor waves 1 and 2 may now both be complete.
Minor wave 3 may only subdivide as an impulse. Within minor wave 3, minute waves i and ii may now be complete.
Within minute wave iii, minuette waves (i), (ii) and now (iii) may be complete.
Minuette wave (iv) may complete shortly.
Minute wave iv may not move into minute wave i price territory below 1,446.51.
Look out for the possibility of one or both of minute wave v to end minor wave 3 or minor wave 5 to end primary wave 3 to be blow off tops.
The best fit channel is drawn the same way on both hourly charts today. Expect the lower edge to provide support for pullbacks along the way up. If the lower edge is breached, then the upwards trend may be either over or a larger pullback or consolidation to last a few days or so may have begun.
TECHNICAL ANALYSIS
MONTHLY CHART
Click chart to enlarge. Chart courtesy of StockCharts.com.
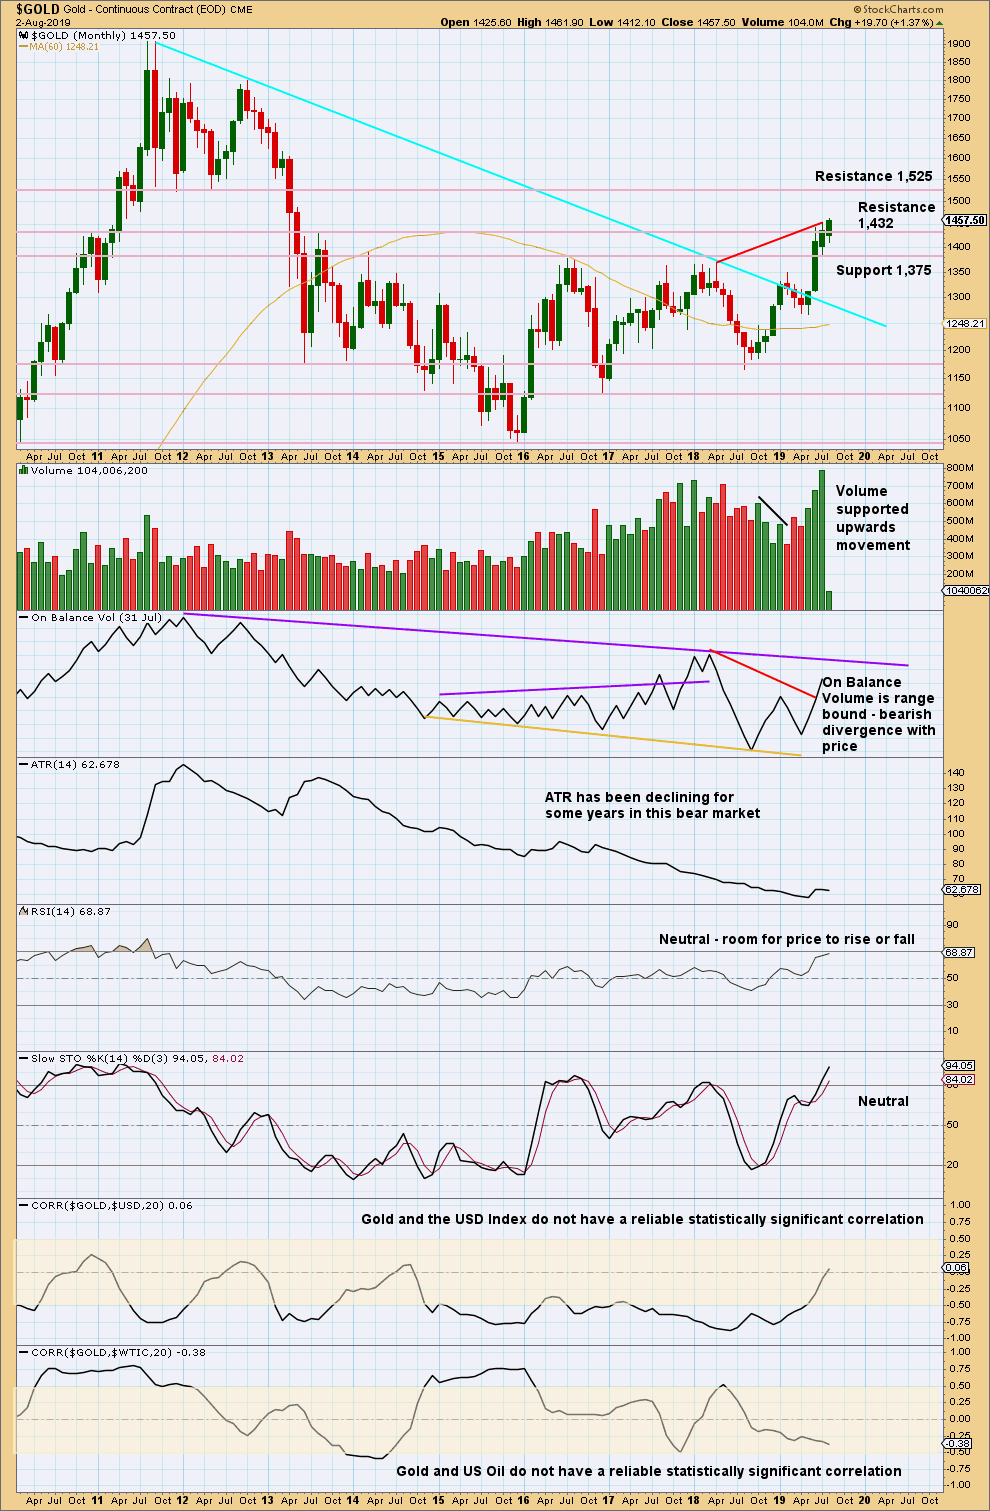
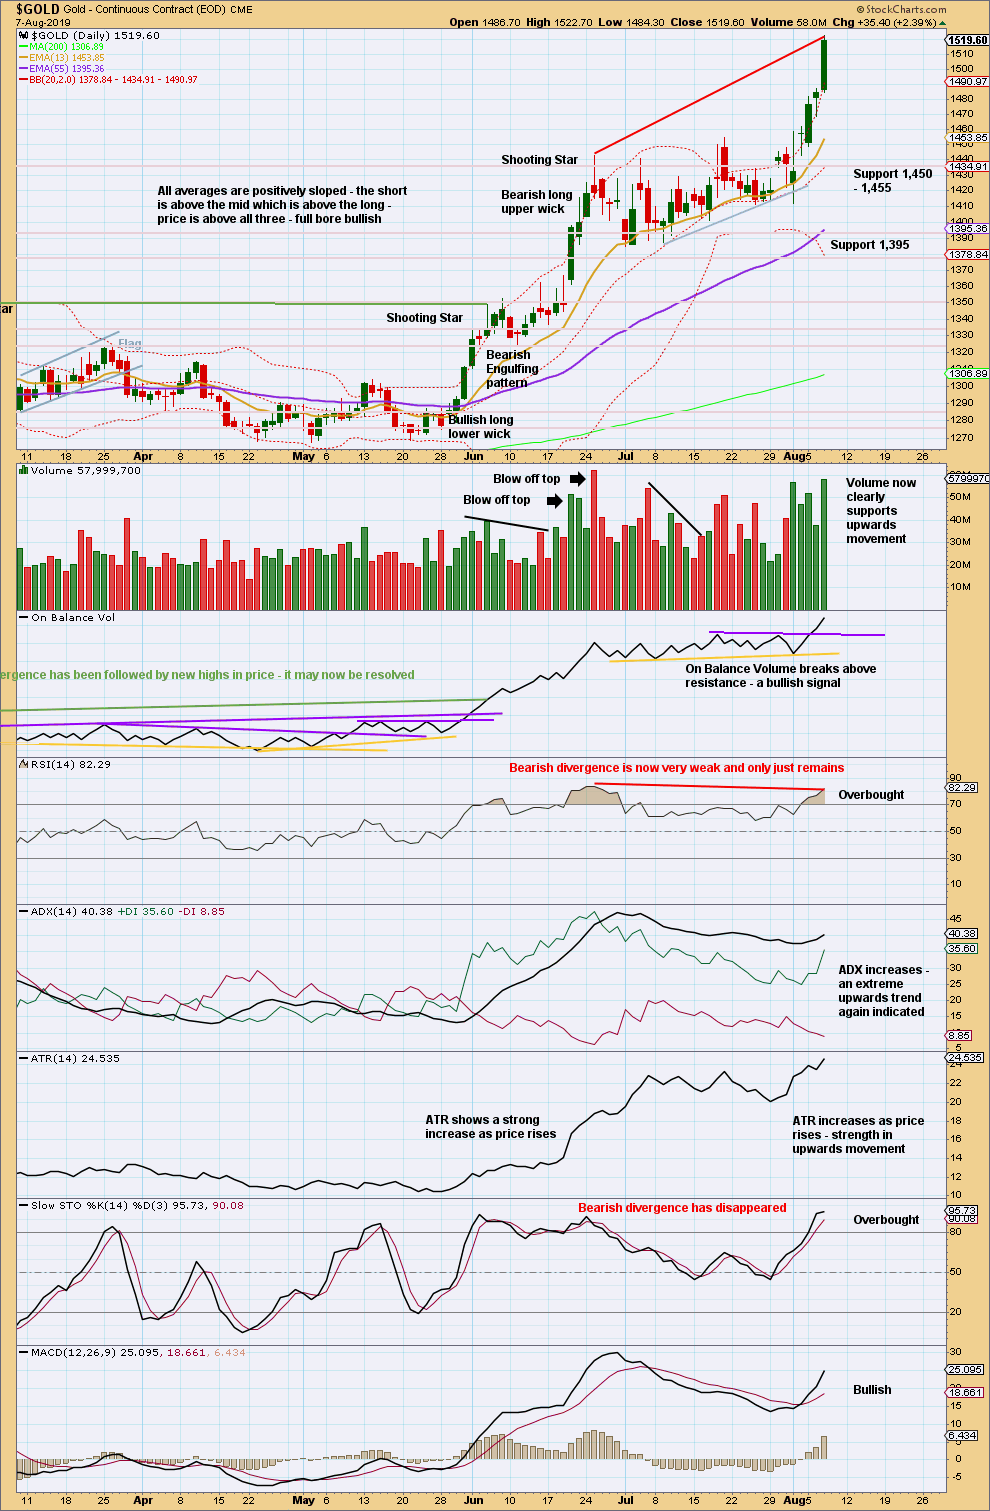
Gold has effected an upwards breakout above multi-year resistance and above the cyan bear market trend line. Look for next resistance identified on the chart.
The new high in price above prior highs for March / April 2018 have not been matched by new highs for On Balance Volume. This divergence is bearish and supports a bearish Elliott wave count. This divergence may be given a little weight because it is strong and evident on the monthly chart.
WEEKLY CHART
Click chart to enlarge. Chart courtesy of StockCharts.com.
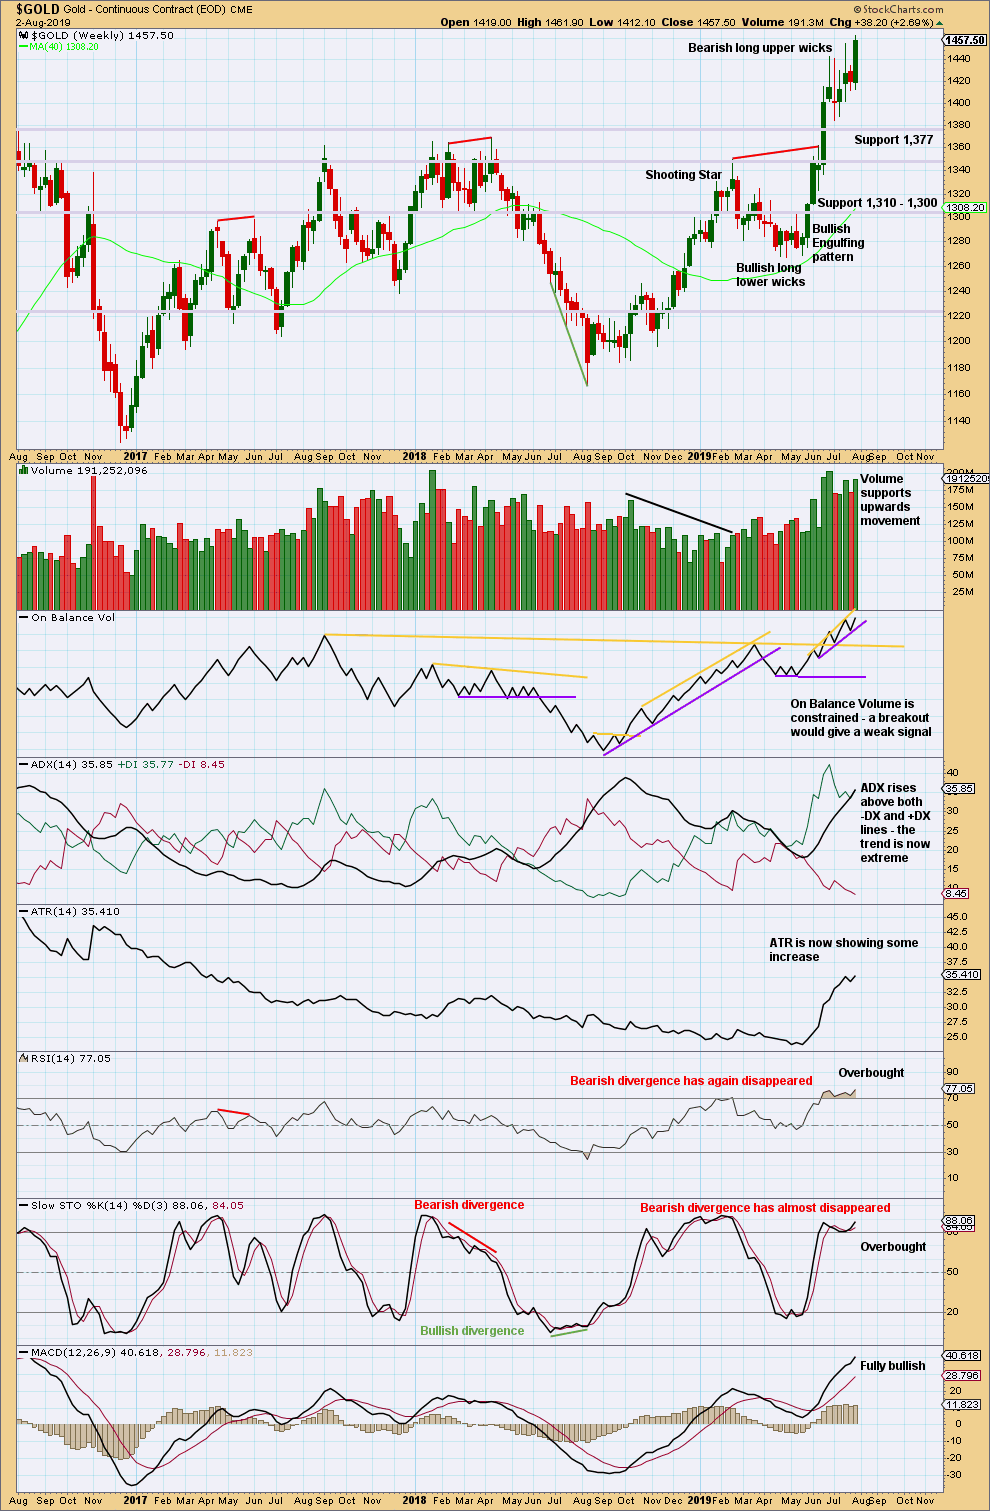
The bottom line remains that a multi year breakout occurred a few weeks ago, and it occurred with strength in volume. ADX is now extreme and conditions are overbought. Some consolidation or pullback may reasonably be expected here to relieve extreme conditions.
The last weekly candlestick closes strong with support from volume. This is not however matched by strength on the daily chart.
DAILY CHART
Click chart to enlarge. Chart courtesy of StockCharts.com.
Look for support in the first instance at last resistance, which is now at 1,455. Assume an upwards breakout has occurred while price remains above this point.
There is resistance about here at 1,520. Next reasonable resistance above is about 1,600.
Assume the upwards trend remains in place until proven otherwise. Proven otherwise may be a strong bearish candlestick pattern, particularly if it comes after a blow off top.
GDX WEEKLY CHART
Click chart to enlarge. Chart courtesy of StockCharts.com.
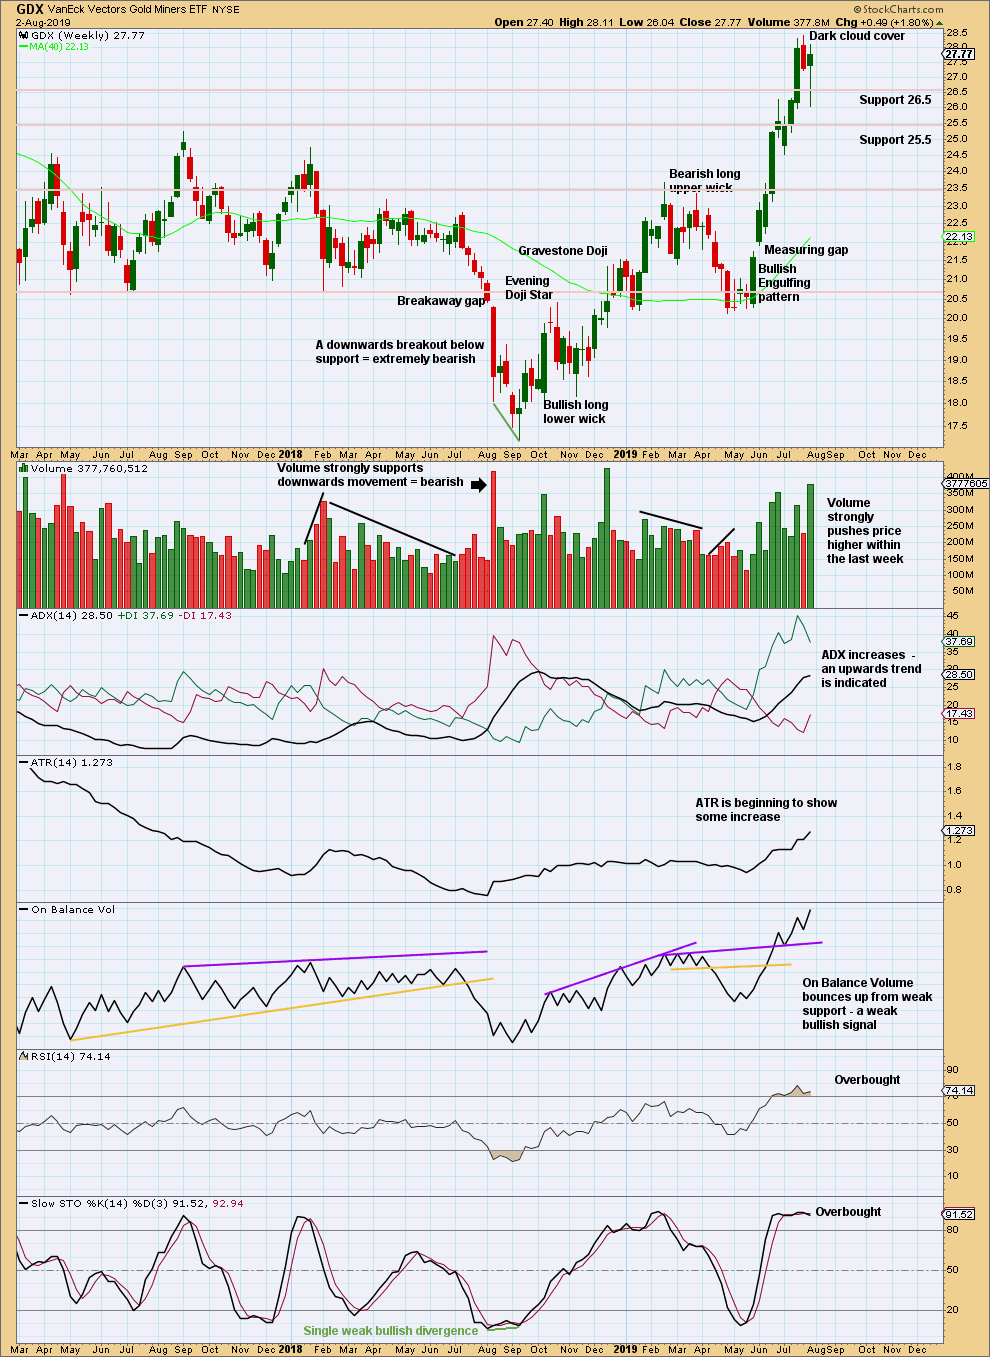
Last week completes a lower low and lower high, but the candlestick has closed green and the balance of volume was upwards. Upwards movement within the week may have support from volume, but daily volume bars would better be analysed to draw a conclusion here.
The upwards trend is not yet extreme. A long lower wick on this weekly candlestick is bullish.
GDX DAILY CHART
Click chart to enlarge. Chart courtesy of StockCharts.com.
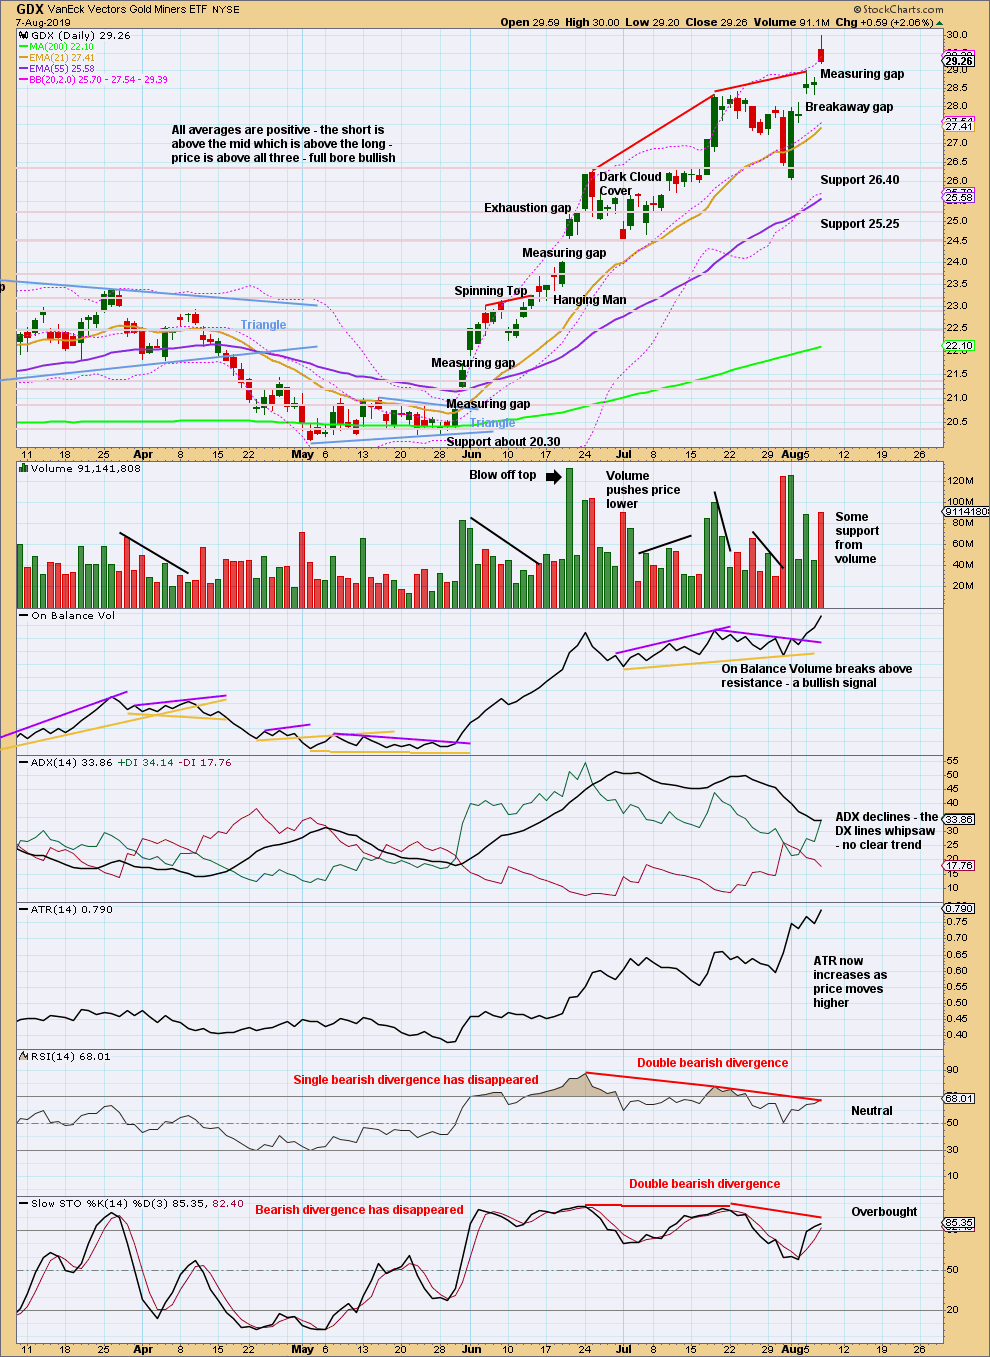
The target from the breakaway gap is at 30.38.
The next gap is a measuring gap, but its target has already been passed. Assume the upwards trend remains while this gap remains open. If this gap is closed, be aware the upwards trend may have ended and either a larger consolidation or a trend change may have occurred. Support at this gap should be at 29.01.
Published @ 09:03 p.m. EST.
—
Careful risk management protects your trading account(s).
Follow my two Golden Rules:
1. Always trade with stops.
2. Risk only 1-5% of equity on any one trade.
—
New updates to this analysis are in bold.
Hourly bullish count updated:
The invalidation point and targets remain the same. The channel is slightly adjusted.
Bear hourly chart updated:
Notice please that both hourly and daily charts for both bull and bear counts see this upwards structure as incomplete, and have higher targets.
More upwards movement is expected at this time for both counts.
Playing wait and see. Stopped out of positions today during an all day board meeting for my day job! It was very difficult to keep my phone off 😉
The most interesting price move to watch, I think, is if gold continues higher with the stock market. I find it amazing if that happens…not sure why, just interesting.
Long term, gold does best when the rate of worldwide inflation is increasing. Although there may be a near term spike in inflation, medium term says deflation is likely on the horizon. Look at oil, CRB etc.
My analysis makes me lean bearish (in fact I think many of the miners will go BK if gold goes below 1000) even though I really want to be long gold and silver for the long term.
Yeah, my recent attempt at trading this B wave down stunk (which is what B waves can do to any good trader – make you look dumb), but I have to imagine there is a better long-term term trade coming where we can make a boatload of profits.
If silver keeps leading and clears the breakout hurdle… Then I’ll definitely reconsider the bullish thesis. Crap, a move from 18 to 30 would be killer, and who cares if you miss the first 3 bucks!
Thank you for everyone’s input, and if you have any thoughts, then please share! I’m all ears.
Corey
I’m sure I’ll suffer abuse, but I’m opening a small short on gold/silver/and the PMs via JDUST.
I’m primarily using silver as a guide, but I certainly understand if it goes to another new high.
If silver drops and can hold the 16.55 area, then I’d consider going long…
Depending on where you do it, the spread on Silver is too big for me on small trades – but I can see why you would short gold at this time …
I’m short the ALTs and BTC – looks like a nice Elliot wave that needs to complete down (mostly on Neo but i think the catalyst will be BTC falling)
Good luck
No one ever should be suffering any abuse here on this forum.
The comments policy is very clear on this.
This message below is not to you Corey, as I’ve already made my comment to you on this and we’re all good there. This is to newer and less experienced members:
The trend is your friend. Currently the trend is up, until proven otherwise. While the upwards trend is extreme, it’s still an upwards trend. Anyone here trading against the trend is trading against what my analysis is telling you.
Corey seems to have a plan and some experience. He’s also taking responsibility for his own decisions and is aware it’s counter to my advice.
I’m just a bit wary here because from time to time we have new inexperienced members come in, take a few trades, make a few losses and then blame me for it.
I think Lara was talking about me. Corey, you are much more experienced then me and I was off base. I am truly sorry for my ill advised comments and I’m sorry if it was insulting to you.
I wouldn’t call what you said exactly abuse AndrewLee. It could have been worded more politely, but it wasn’t at the point where I was going to delete it as counter to the comments policy.
But, it is always better to err on the side of being more polite and gentle.
That’s a message for all of us. Something I try to live with, and often fail 🙂
Hey guys no worries!!!
The “abuse” comment was more of a metaphor since my last trade did not go so well!
I’m interested in two things: 1) Sharing and being part of a community of traders, and 2) figuring out a way to pass on some of my knowledge.
I think I’ll stick to posting more “analysis” type info, and less on trading. It can get annoying for both me and other traders to “keep score”.
Also, I’m thinking about logging my trades on a website in a format that will help people that are trading futures. It keeps me accountable, and it is something that a trader did for me 15 years ago.
Anyway more to come.
Also, I’m out of short positions (again).
I’m looking for a long entry here overnight.
Corey
Gold has broken out to new highs in a few currencies. This may make corrections less extreme as buyers in other currencies will be propping up prices after its recent breakout. One worry is that gold stocks don’t seem to be really firing on all cylinders.