
At the end of the week, two small sideways days do not change the overall expectation from both Elliott wave counts.
Summary: There is an upwards trend in place that is very extreme. Conditions are overbought. This can continue while price moves a considerable distance further, or a trend change may occur at any time now. Caution is warranted. Risk management is essential.
The bullish Elliott wave count expects a large interruption to the trend to begin about 1,565.
The bearish Elliott wave count expects the upwards trend to end about 1,582 to 1,586.
Grand SuperCycle analysis is here.
Monthly charts were last published here with video here.
BEARISH ELLIOTT WAVE COUNT
WEEKLY CHART
Click chart to enlarge.
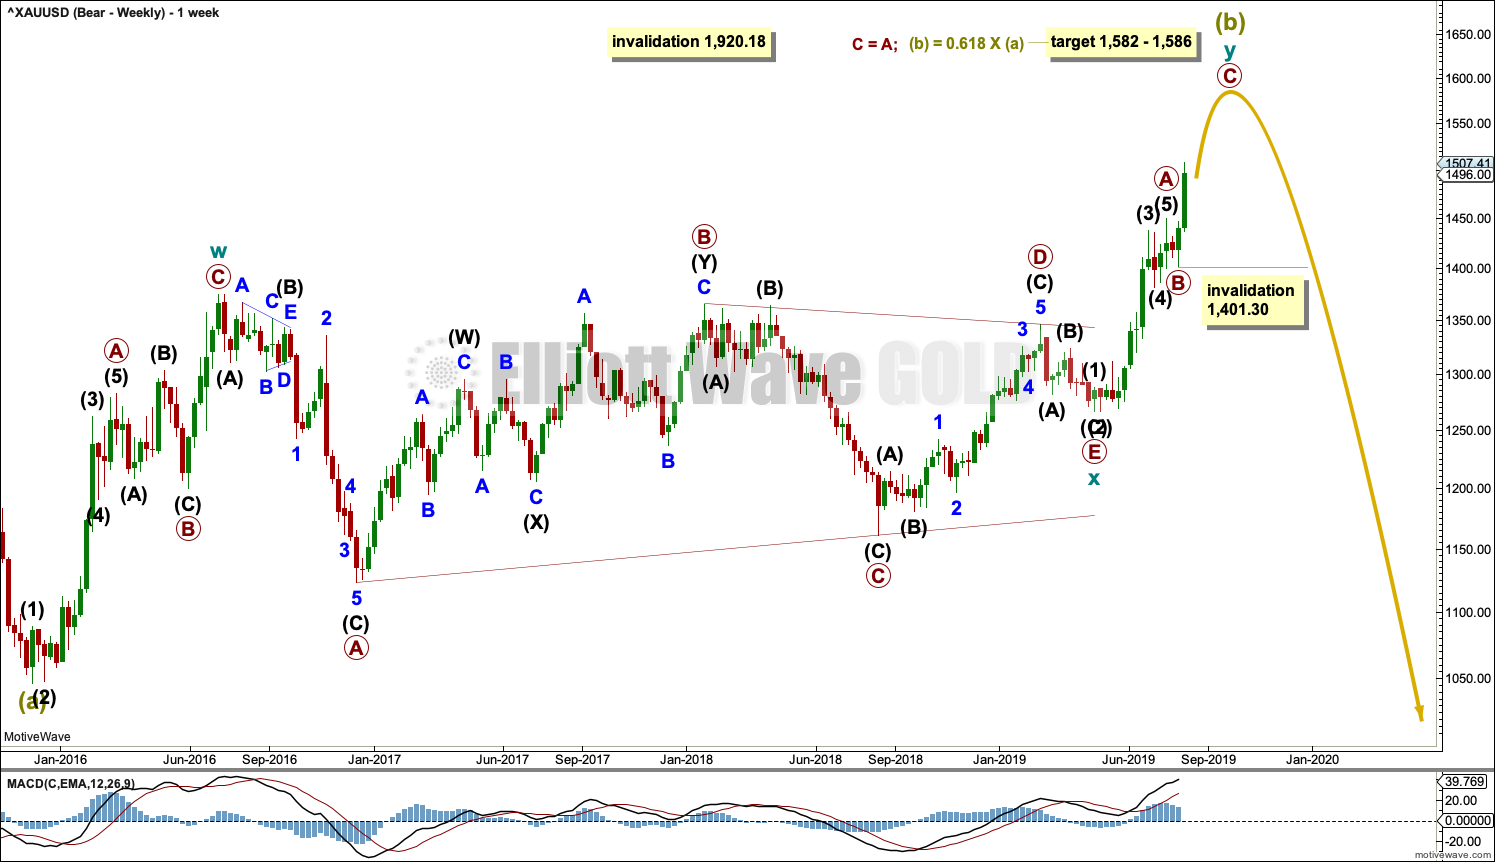
This is now the sole remaining bearish Elliott wave count.
It remains possible that Super Cycle wave (b) is an incomplete double zigzag.
The first zigzag in the double is labelled cycle wave w. The double is joined now by a three in the opposite direction, a triangle labelled cycle wave x. The second zigzag in the double is labelled cycle wave y.
Cycle wave y must subdivide as a zigzag if Super Cycle wave (b) is a double zigzag. Within cycle wave y, primary waves A and B may now be complete. No second wave correction within primary wave B may move beyond its start below 1,401.30.
The purpose of the second zigzag in a double is to deepen the correction. So far cycle wave y has already achieved this purpose.
The 0.618 Fibonacci Ratio of Super Cycle wave (a) is at 1,586.
Super Cycle wave (b) may not move beyond the start of Super Cycle wave (a) above 1,920.18.
DAILY CHART
Click chart to enlarge.
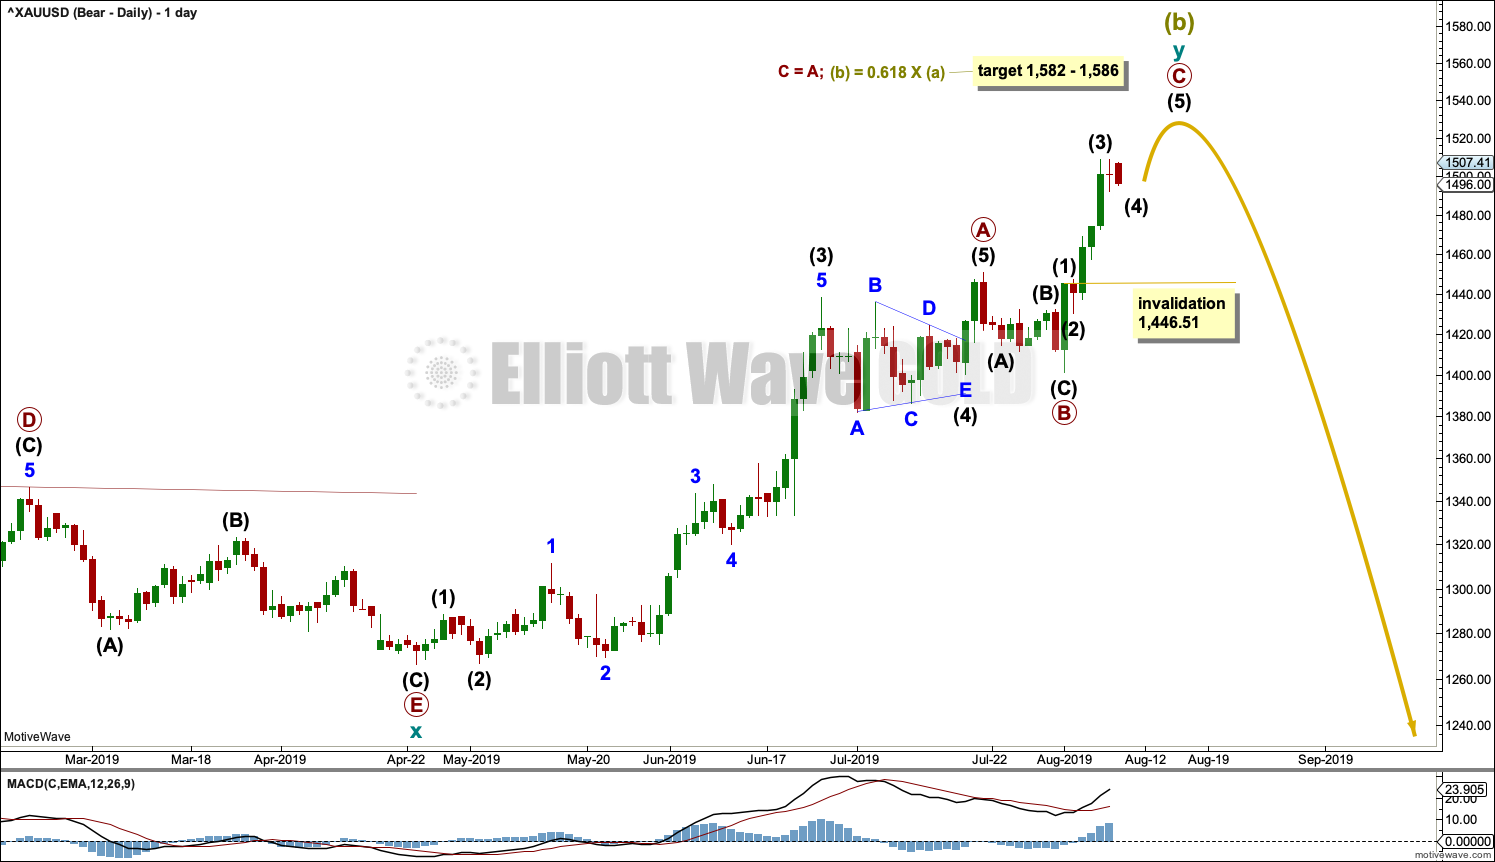
Primary wave C must complete as a five wave structure. So far intermediate waves (1) through to (3) may be complete. Intermediate wave (4) may not move into intermediate wave (1) price territory below 1,446.51 (this price point is taken from the hourly chart).
When intermediate waves (3) and (4) may be complete, then the target calculation may be added to at intermediate degree. At that stage, it may change.
HOURLY CHART
Click chart to enlarge.
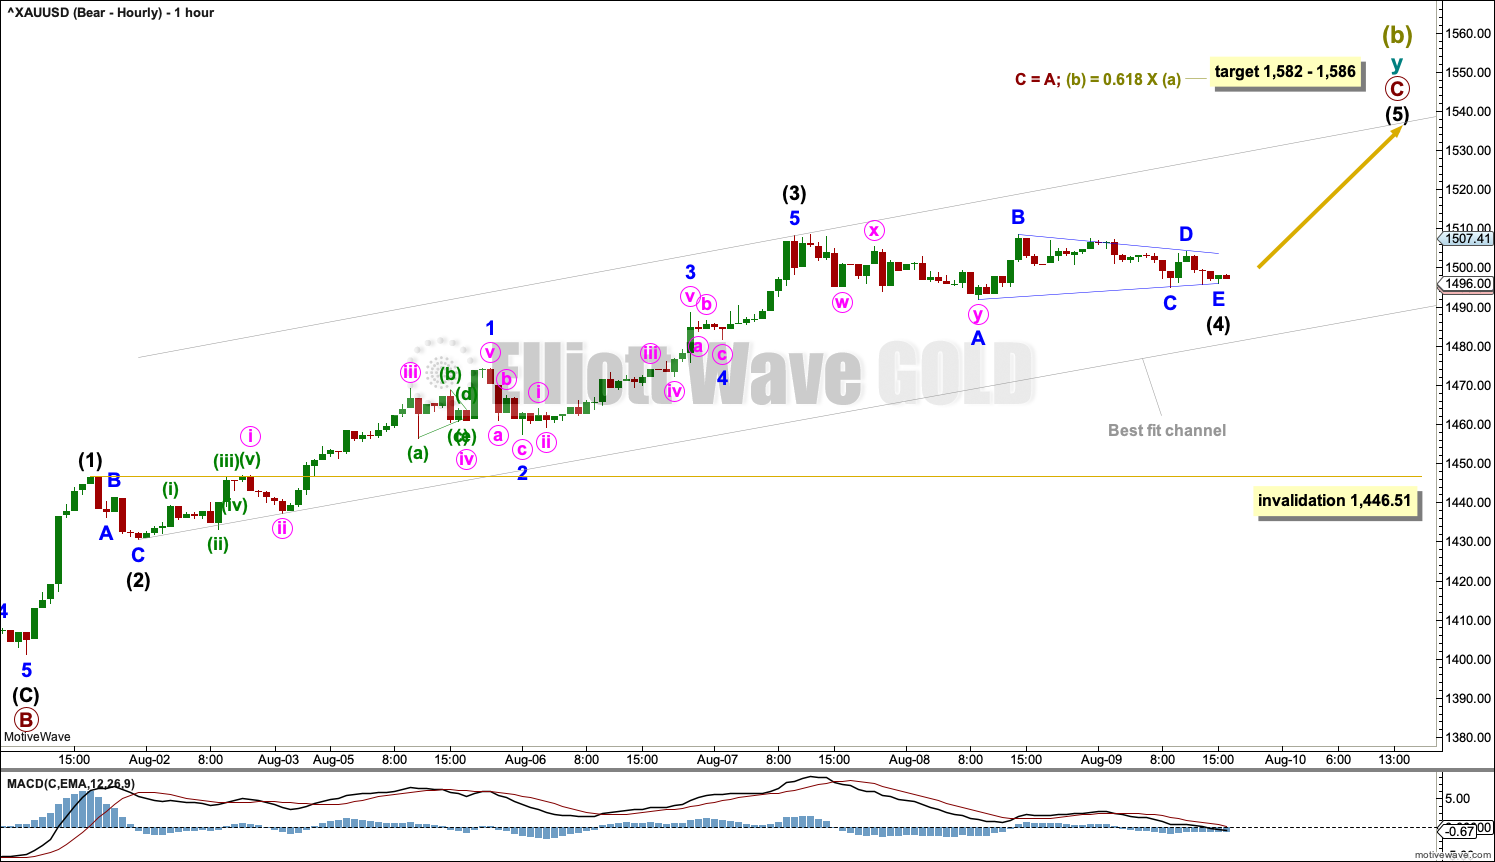
Primary wave C must complete as a five wave structure, most likely an impulse, which is what it looks to be unfolding as.
Within primary wave C, intermediate waves (1) through to (3) may be complete. Intermediate wave (4) may be unfolding sideways as a triangle, combination or flat correction. Intermediate wave (4) may not move into intermediate wave (1) price territory below 1,446.51.
The best fit channel is again adjusted.
BULLISH ELLIOTT WAVE COUNT
WEEKLY CHART
Click chart to enlarge.
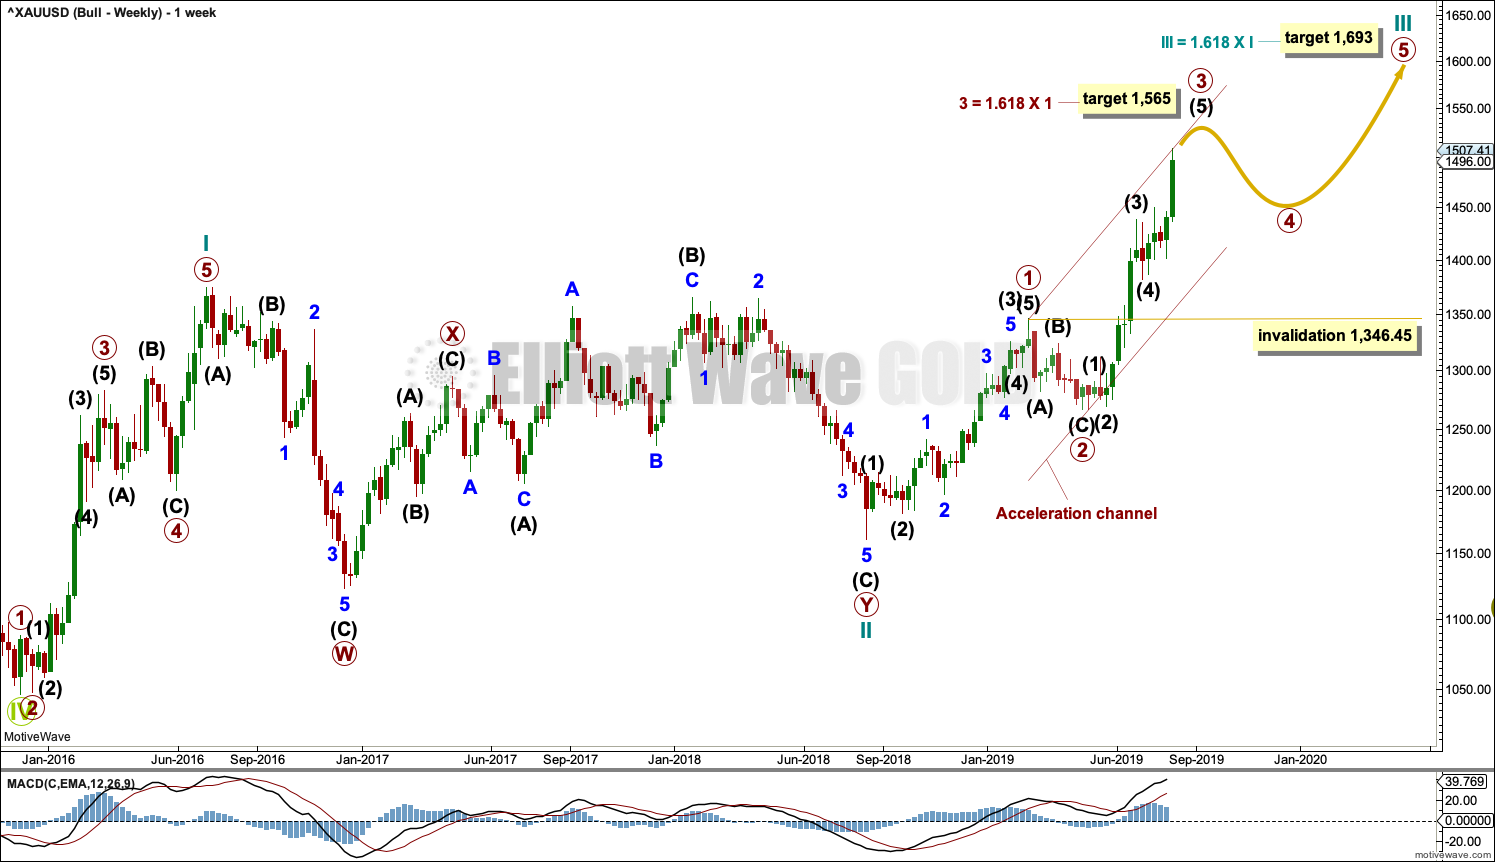
This wave count sees the the bear market complete at the last major low for Gold in November 2015.
If Gold is in a new bull market, then it should begin with a five wave structure upwards on the weekly chart. However, the biggest problem with this wave count is the structure labelled cycle wave I because this wave count must see it as a five wave structure, but it looks more like a three wave structure.
Commodities often exhibit swift strong fifth waves that force the fourth wave corrections coming just prior and just after to be more brief and shallow than their counterpart second waves. It is unusual for a commodity to exhibit a quick second wave and a more time consuming fourth wave, and this is how cycle wave I is labelled. This wave count still suffers from this very substantial problem, and for this reason the bearish wave count is still considered because it has a better fit in terms of Elliott wave structure.
Cycle wave II subdivides well as a double combination: zigzag – X – expanded flat.
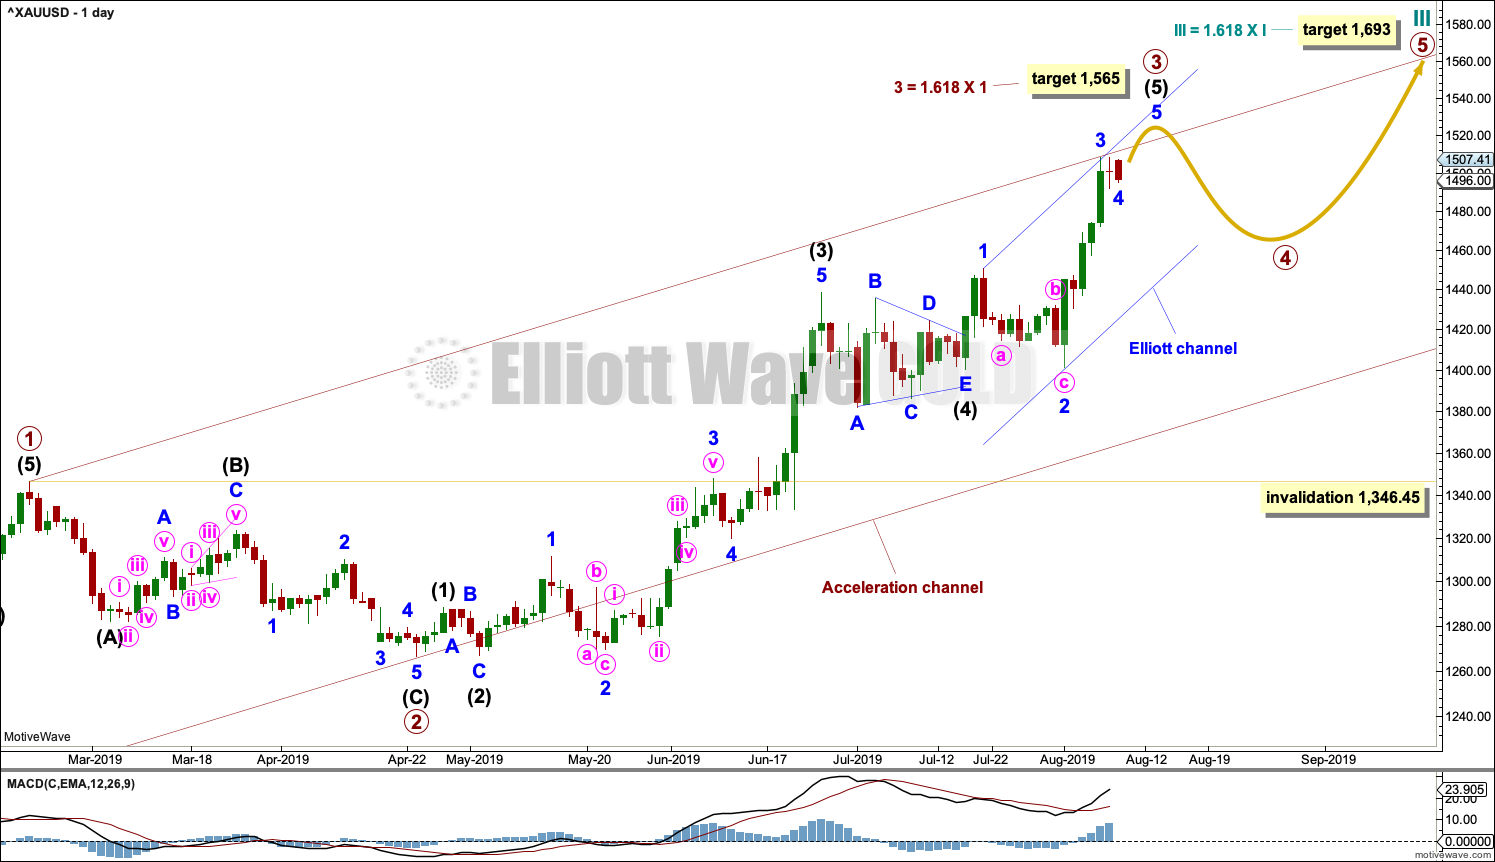
Cycle wave III may have begun. Within cycle wave III, primary waves 1 and 2 may now be complete. Primary wave 3 has now moved above the end of primary wave 1 meeting a core Elliott wave rule. It has now moved far enough to allow room for primary wave 4 to unfold and remain above primary wave 1 price territory. Primary wave 4 may not move into primary wave 1 price territory below 1,346.45.
Cycle wave III so far for this wave count would have been underway now for 51 weeks. It is beginning to exhibit some support from volume and increasing ATR. This wave count now has some support from classic technical analysis.
Redraw an acceleration channel about primary waves 1 and 2: draw the first trend line from the end of primary wave 1 to the last high, then place a parallel copy on the low of primary wave 2. Keep redrawing the channel as price continues higher. When primary wave 3 is complete, then this channel would be drawn using Elliott’s first technique about the impulse. The lower edge may provide support.
DAILY CHART
Click chart to enlarge.
Primary wave 3 may only subdivide as an impulse. Within the impulse, intermediate waves (1) through to (4) are all now complete. The structure of intermediate wave (5) is now incomplete, so it needs to move higher.
When it arrives, then primary wave 4 may not move into primary wave 1 price territory below 1,346.45.
Because intermediate wave (5) is a fifth wave to end a third wave one degree higher, at primary degree, it may exhibit swift strong movement. It may end with a blow off top.
Draw a channel using Elliott’s technique about intermediate wave (5) as shown in blue. The upper edge may provide resistance for minor wave 5.
HOURLY CHART
Click chart to enlarge.
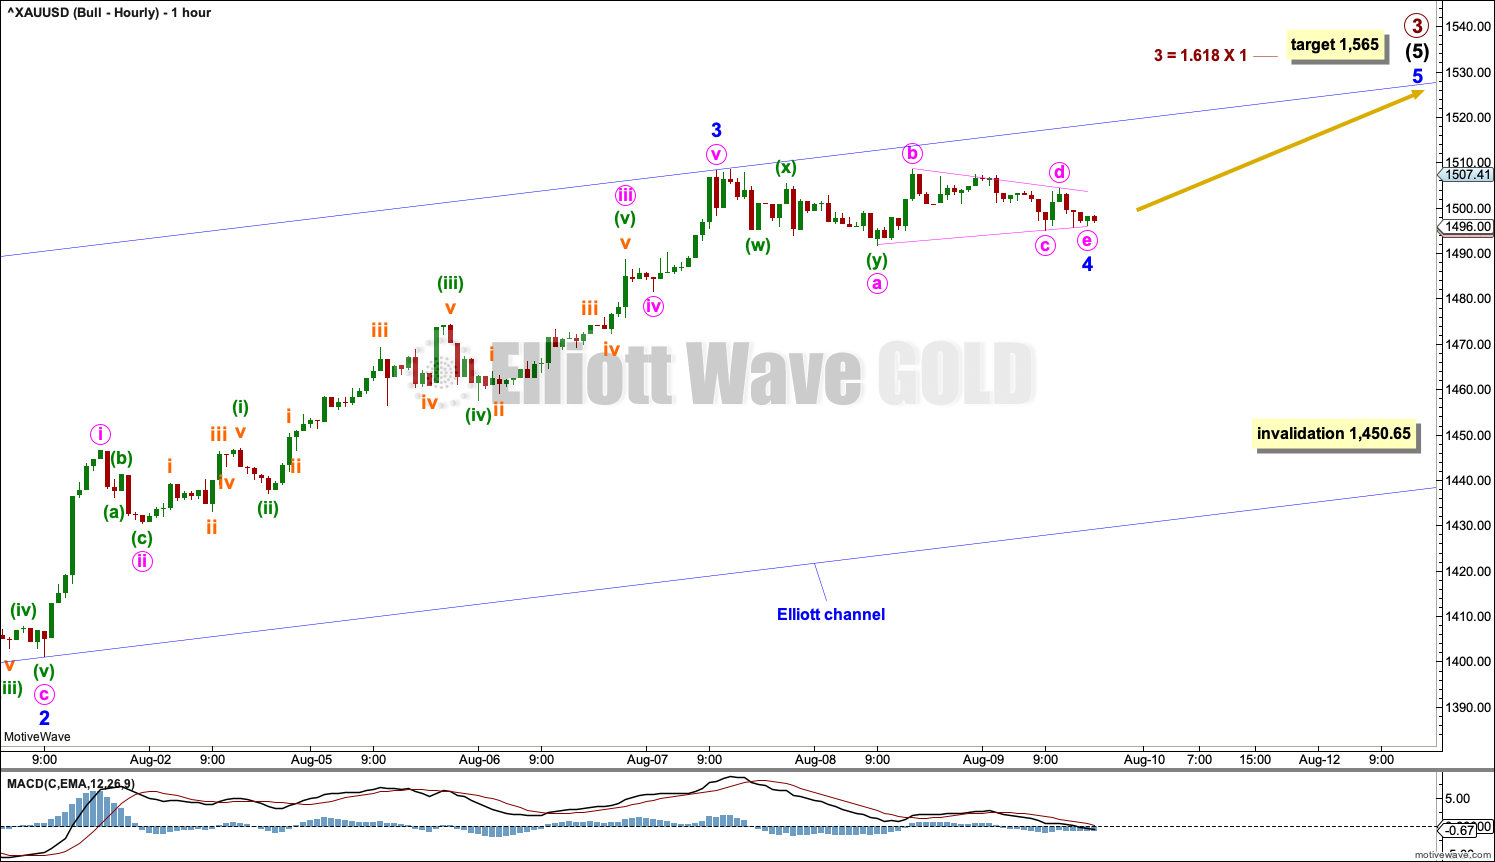
Intermediate wave (5) may only subdivide as a five wave structure, either an impulse or an ending diagonal. Fifth waves to end third waves one degree higher, as this one is, almost always subdivide as impulses (that is what shall be expected).
Within intermediate wave (5), minor waves 1 through to 3 may now be complete.
Look out for the possibility of minor wave 5 to end primary wave 3 to be a blow off top.
TECHNICAL ANALYSIS
MONTHLY CHART
Click chart to enlarge. Chart courtesy of StockCharts.com.
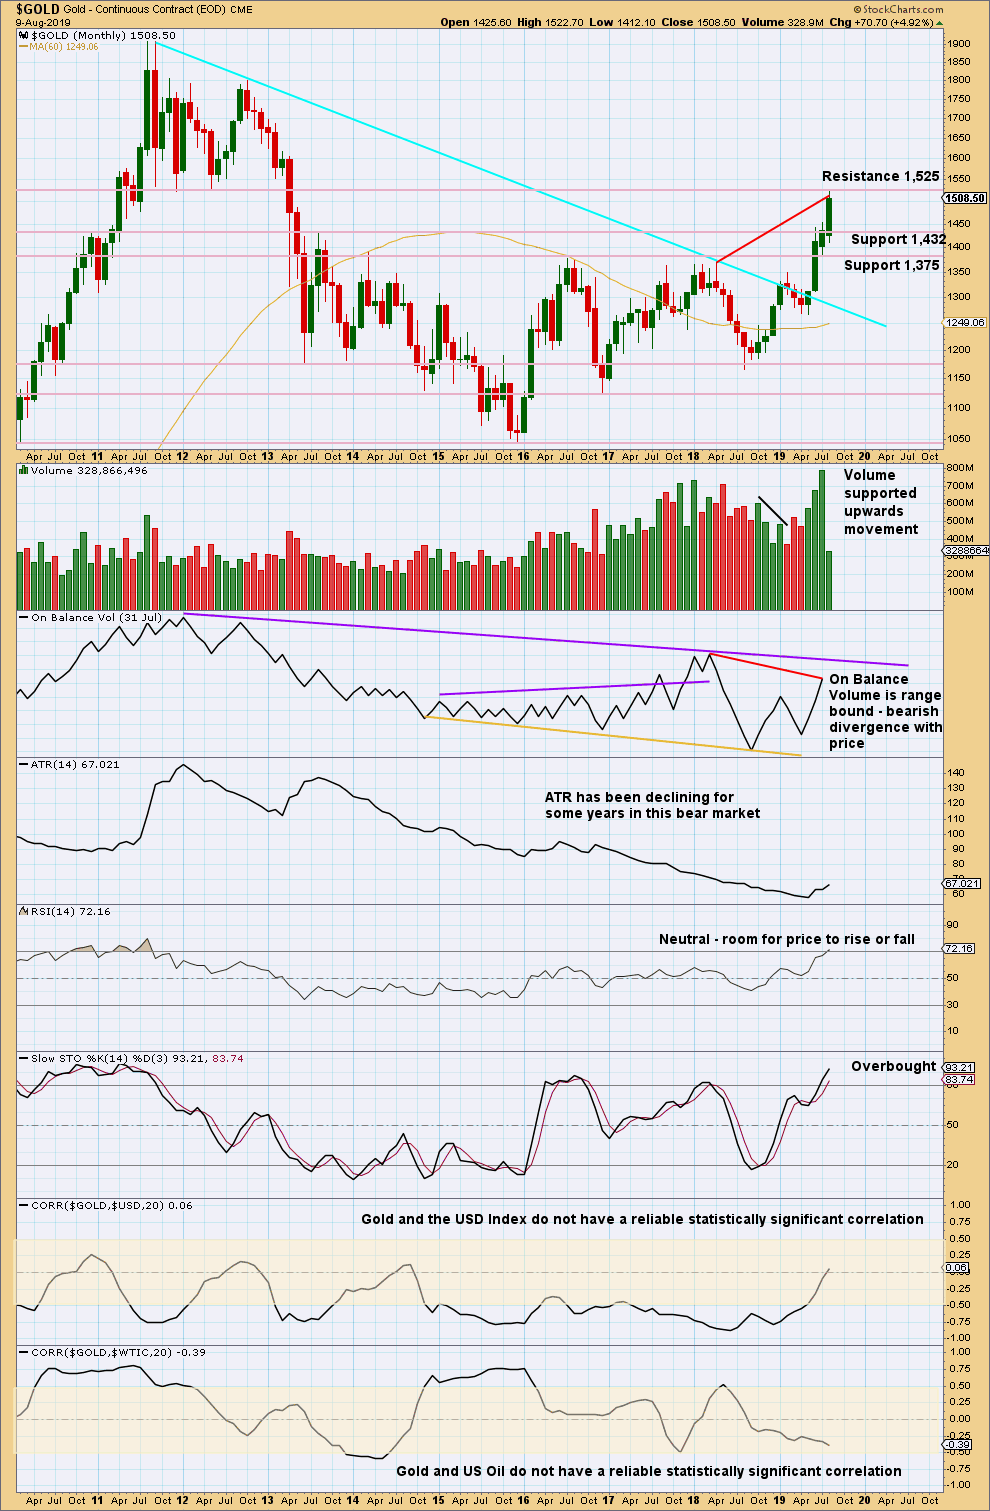
Gold has effected an upwards breakout above multi-year resistance and above the cyan bear market trend line. Price is now at strong resistance about 1,525.
The new high in price above prior highs for March / April 2018 have not been matched by new highs for On Balance Volume. This divergence is bearish and supports a bearish Elliott wave count. This divergence may be given a little weight because it is strong and evident on the monthly chart.
WEEKLY CHART
Click chart to enlarge. Chart courtesy of StockCharts.com.
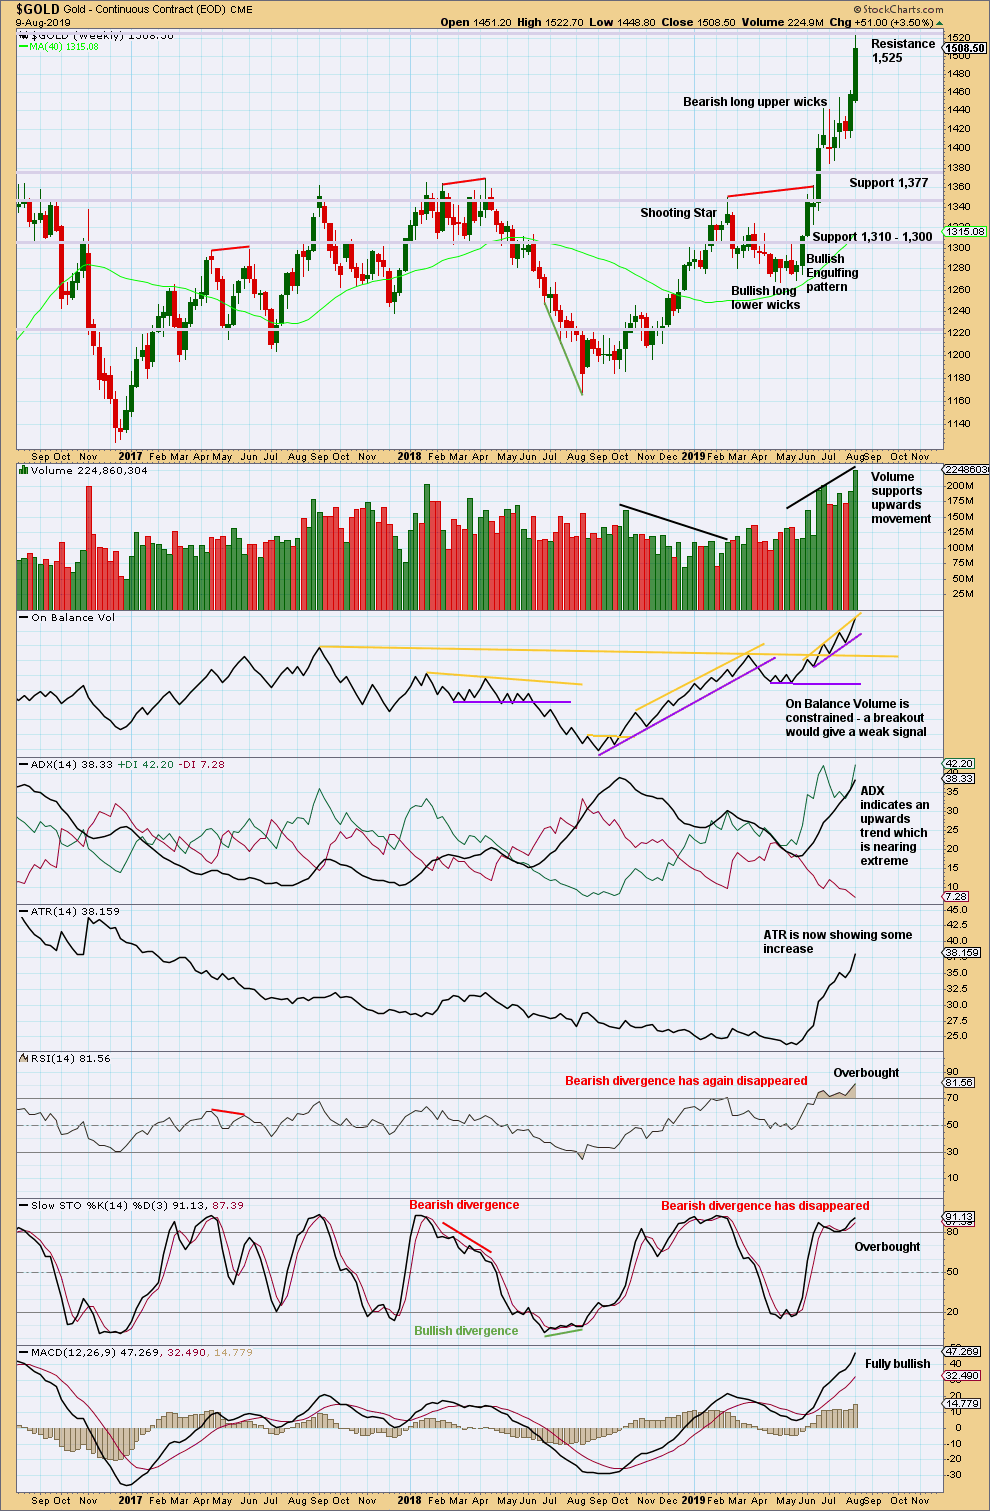
When trends for Gold reach extreme, they can continue still for a few weeks and price can continue for a considerable distance.
When both ADX and RSI reach extreme together, then that is sometimes where a trend ends.
RSI at overbought on the weekly chart is a warning to be cautious; the trend is overbought, but at this stage there is no evidence of a trend change.
DAILY CHART
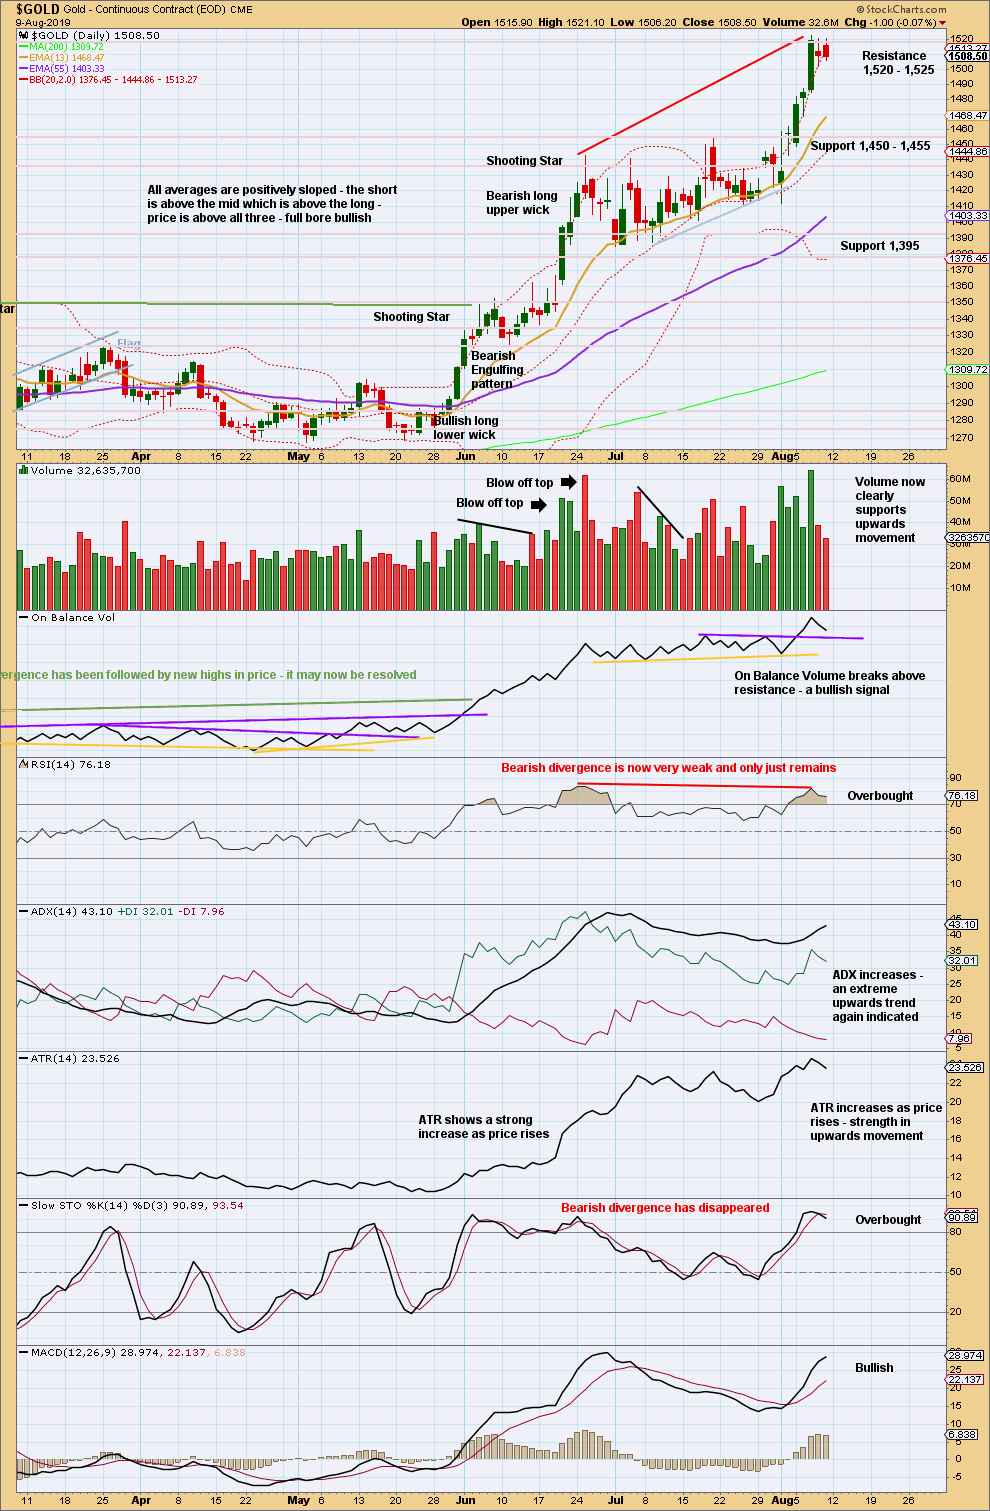
Click chart to enlarge. Chart courtesy of StockCharts.com.
Look for support in the first instance at last resistance, which is now at 1,455.
There is resistance about here at 1,520 – 1,525. Next reasonable resistance above is about 1,600.
Assume the upwards trend remains in place until proven otherwise. Proven otherwise may be a strong bearish candlestick pattern, particularly if it comes after a blow off top. At this stage, there is no evidence of a trend change.
GDX WEEKLY CHART
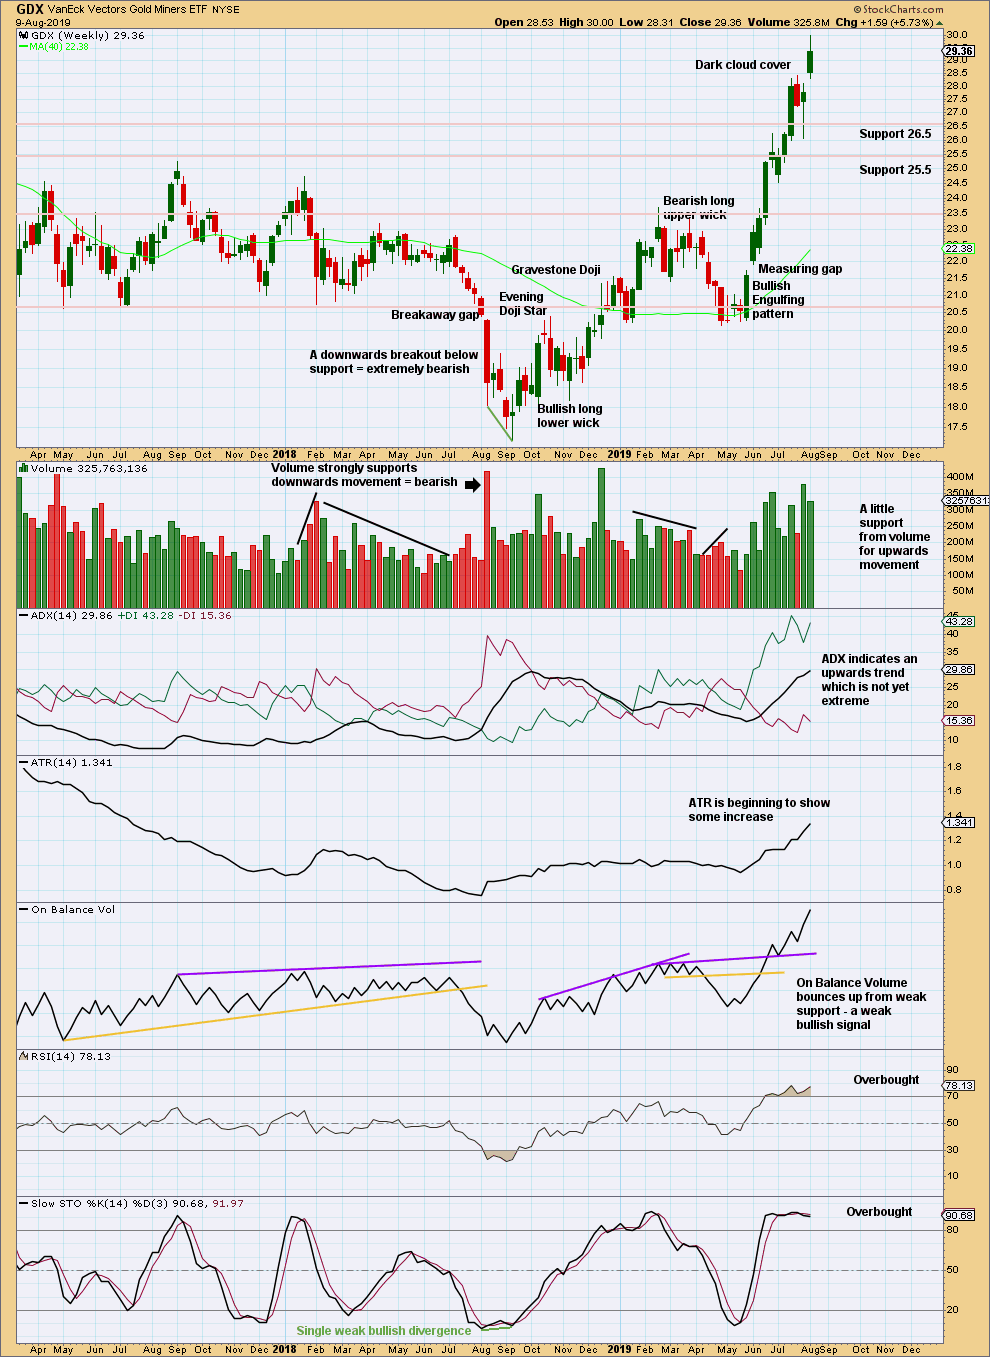
Click chart to enlarge. Chart courtesy of StockCharts.com.
The Dark Cloud Cover reversal pattern was followed by downwards movement in the following week.
Now a new high indicates the last pullback should be over.
Volume this week has slightly declined, but overall volume is rising with price.
The trend has further to go before it reaches extreme at the weekly chart time frame.
GDX DAILY CHART
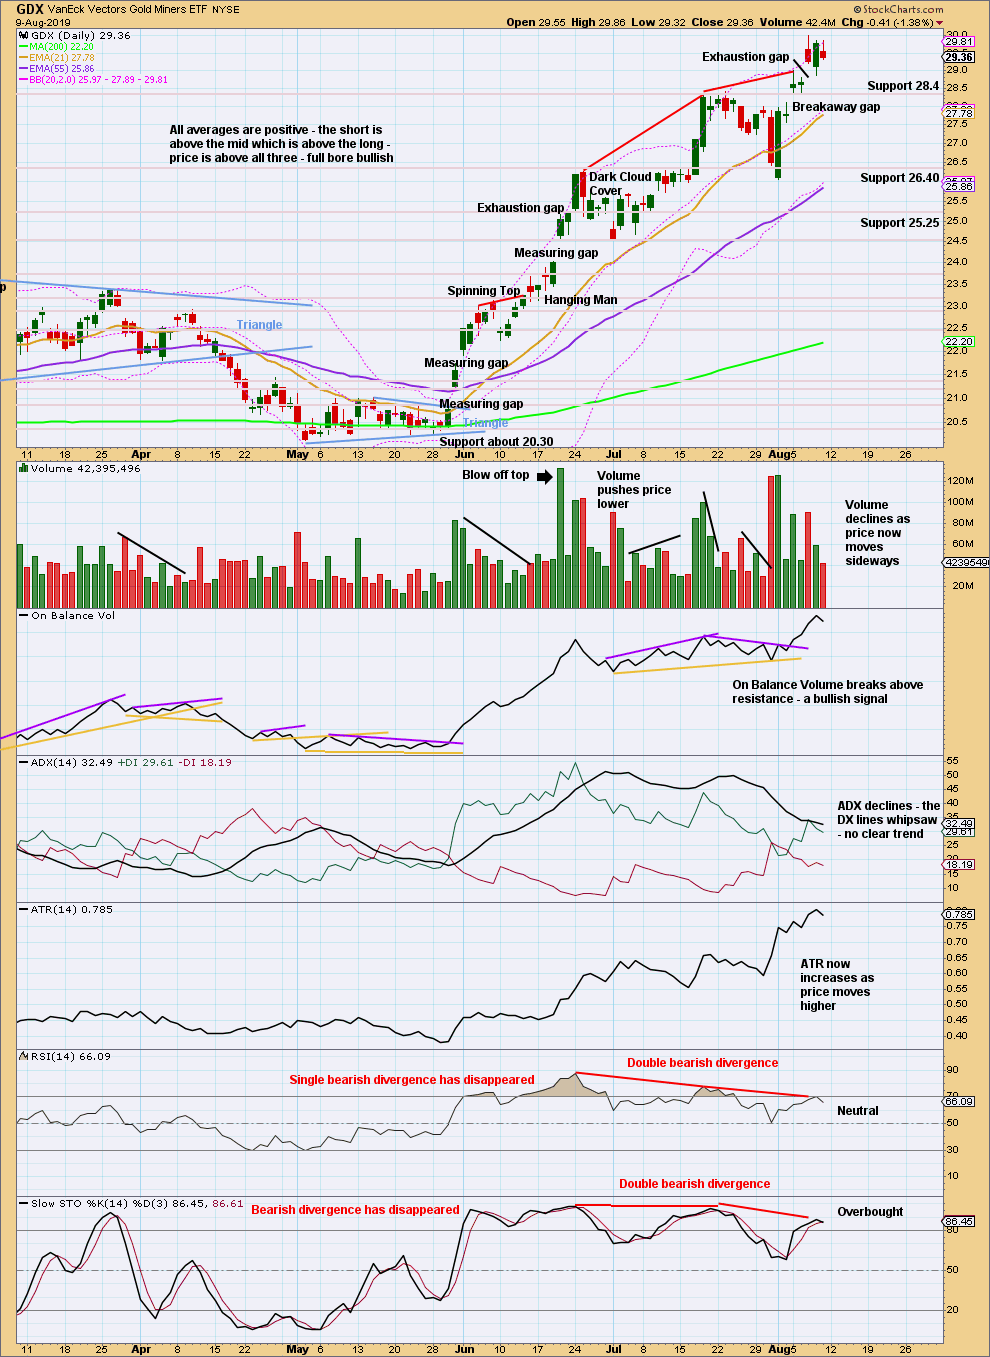
Click chart to enlarge. Chart courtesy of StockCharts.com.
A consolidation may have begun. Look for support about 28.4.
Published @ 11:31 p.m. EST.
—
Careful risk management protects your trading account(s).
Follow my two Golden Rules:
1. Always trade with stops.
2. Risk only 1-5% of equity on any one trade.
—
New updates to this analysis are in bold.
Bull hourly chart updated:
Minor 4 now fits as a completed flat. Within it minute b fits as a double combination.
The invalidation point can be moved up now that minor 4 should be over. Within minor 5 no second wave correction may move beyond its start.
I need also to move the invalidation point for the bear hourly count up to the same place for the same reason.
Bear hourly chart updated:
Intermediate (4) fits well as a complete flat with minor B within it a double combination. It is now complete. On an up towards the target is now expected.
Triangle idea for Intermediate 4 has invalidated. Looks like correction will be deeper…
Not necessarily.
The other possibilities left were a combination or flat. Both are sideways movements, just not within the converging trend lines of a triangle.
I’m hoping this analysis helps with some trading going forward. I’ve analyzed price movements and my COT report chart to see if I can glean some actionable trading advice – I do all of this with Lara’s counts in mind.
You can see attached my COT analysis. We are currently sitting at a 5.0 reading, which is as of last Tuesday when prices were about $30 – $40 lower. The reading is probably higher today (think of it as a sentiment/positioning chart). This reading has only occurred 18 times out of 710 weeks since 2006 – or 2.5% of the weeks. The last time we hit this reading was in 2016. The natural question to ask is, what happens after an initial reading like this?
What I’m showing is that we are in the potential move up over the next 12 – 18 weeks where prices will either rise another $100, and then drift sideways before crashing, or, rise another $200 and then consolidate for a move much, much higher. This is either Lara’s bear count vs. Lara’s bull count (or alternate monthly).
The last two times we reached a 5.0 reading on my COT analysis were in 2009 and then again in 2016. In 2009, after a $200 move higher in about 16 weeks after the initial 5.0 reading, the market consolidated before moving to its all time high of just under $2000. It did this without sentiment ever reaching another 5.0 extreme reading again. At that point, sentiment wasn’t helpful in determining at top (potentially, other analysis such as technical / Elliott Wave might have helped).
In 2016, the POG moved higher by about $100 in about 5-6 weeks, then spent another 10 weeks distributing at its highs, only to get whacked by $250 down.
Either way, as gold moves higher, it often exhibits price breaks that test down to prior support or resistance. After the move above $1370, there was only a brief test that barely registered any real attempt to properly test that resistance – the fact that it was multi-year resistance tells you something about the current strength of the move.
There are so few instances that price doesn’t come back down to test resistance that I have to imagine near-term we are going to test the break-out area of $1450 (cash). That by no means says gold can’t go back up here to make a marginal new high before doing so – it’s simply the reason I’ve been trying to play the short-side of the market after this breakout. There hasn’t been a proper retest yet, and I’m willing to wager this time it will test before the next big move up.
I missed the recent move higher b/c I was getting too cute with the B wave to test $1390 area again. In general, I’m now bullish for the next 2-3 months to see where Lara’s counts start to diverge, however, I’m not giving up my trading style that has worked for 15 years. Another $40 down makes sense, especially if gold can’t hold $1500 (which is psychological resistance).
From a macro perspective, I think deflation and bankruptcies are coming for commodities. For the gold sector, I think that means we see sub-$1000 prices and miners going out of business. My thesis has been that the price of gold will be the price paid for gold under ground in bankruptcy.
However, I’m willing to adjust if the entire world goes into QE madness and the confidence in the global monetary system fails. At that point, which could happen, I really, really want to be long gold and silver.
Until then, I’m a trader looking to make a buck and not get too attached to any one viewpoint.
Good luck and I hope this helps a little!
Corey
Thank you …
I’ll need to read that 2-3 more times … But you think sub $1000 gold is a strong possibility ?! .. we need to see where we go (as Lara is showing us) in the meantime.