
An inside day leaves both bullish and bearish Elliott wave counts the same. A new short-term hourly chart is provided.
Summary: There is an upwards trend in place that is very extreme. Conditions are overbought. This can continue while price moves a considerable distance further, or a trend change may occur at any time now. Caution is warranted. Risk management is essential.
The bullish Elliott wave count expects a large interruption to the trend may now have begun. It may last about four to ten weeks and may end about 1,431.
The bearish Elliott wave count expects the upwards trend may now have ended. The first confidence point is at 1,401.30. Thereafter, a new low below 1,346.45 would see the bullish wave count discarded and a bearish wave count the only remaining count.
A new high by any amount at any time frame would indicate a consolidation or trend change is still some time away. The next target would then be at 1,567 or 1,585.
Grand SuperCycle analysis is here.
Monthly charts were last published here with video here.
BEARISH ELLIOTT WAVE COUNT
WEEKLY CHART
Click chart to enlarge.
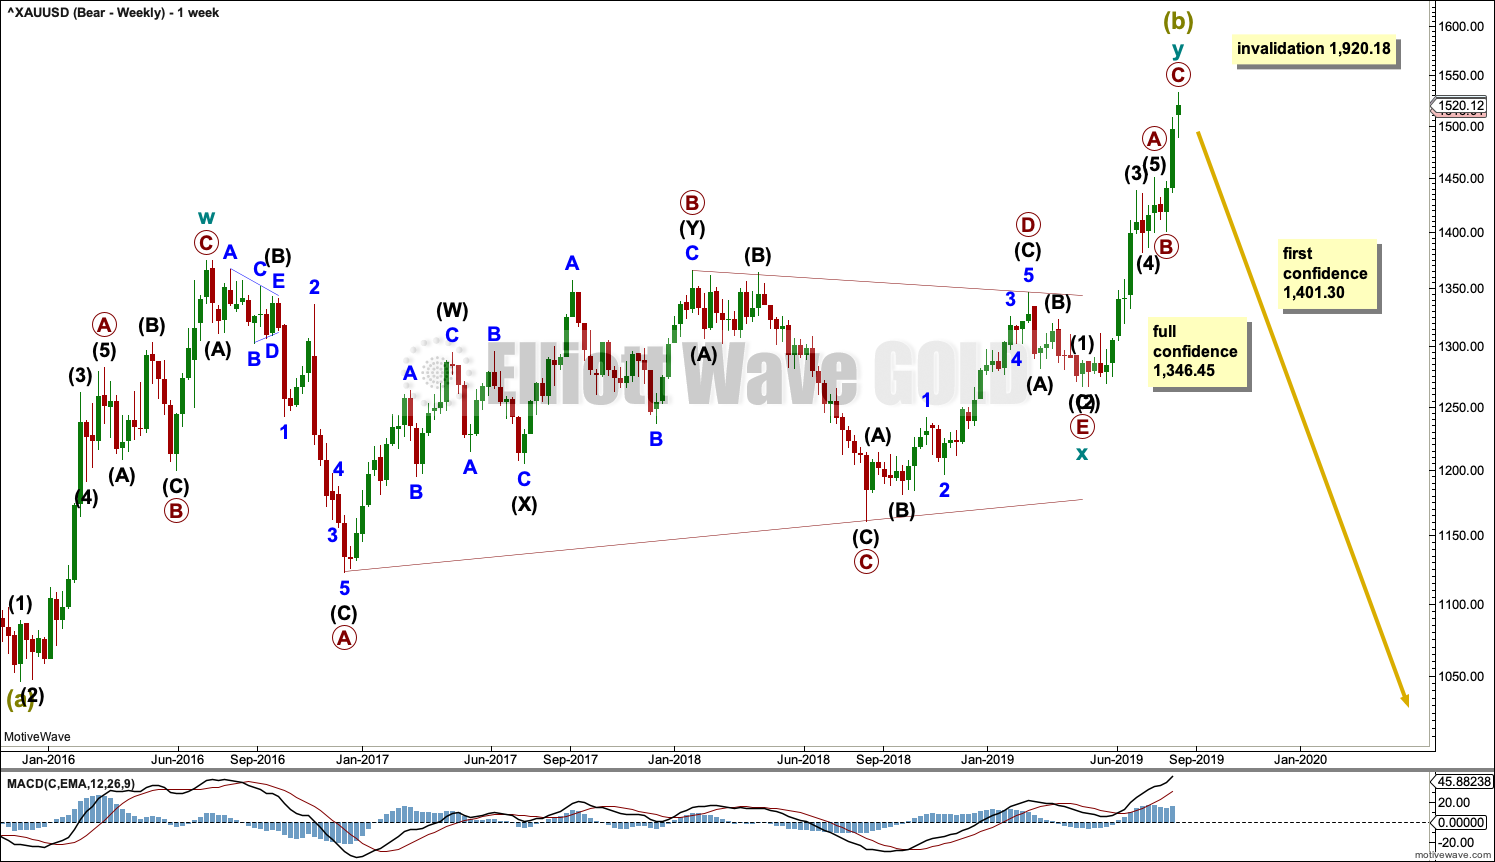
This is now the sole remaining bearish Elliott wave count.
It is now possible that Super Cycle wave (b) is a complete double zigzag.
The first zigzag in the double is labelled cycle wave w. The double is joined by a three in the opposite direction, a triangle labelled cycle wave x. The second zigzag in the double is labelled cycle wave y.
Cycle wave y now fits as a complete zigzag.
The purpose of the second zigzag in a double is to deepen the correction. Cycle wave y has achieved this purpose.
1,401.30 is the start of primary wave C. A new low below this point could not be a second wave correction within primary wave C, so at that stage primary wave C would be confirmed as over.
A new low below 1,346.45 would invalidate the bullish wave count below and add confidence to a bearish wave count.
DAILY CHART
Click chart to enlarge.
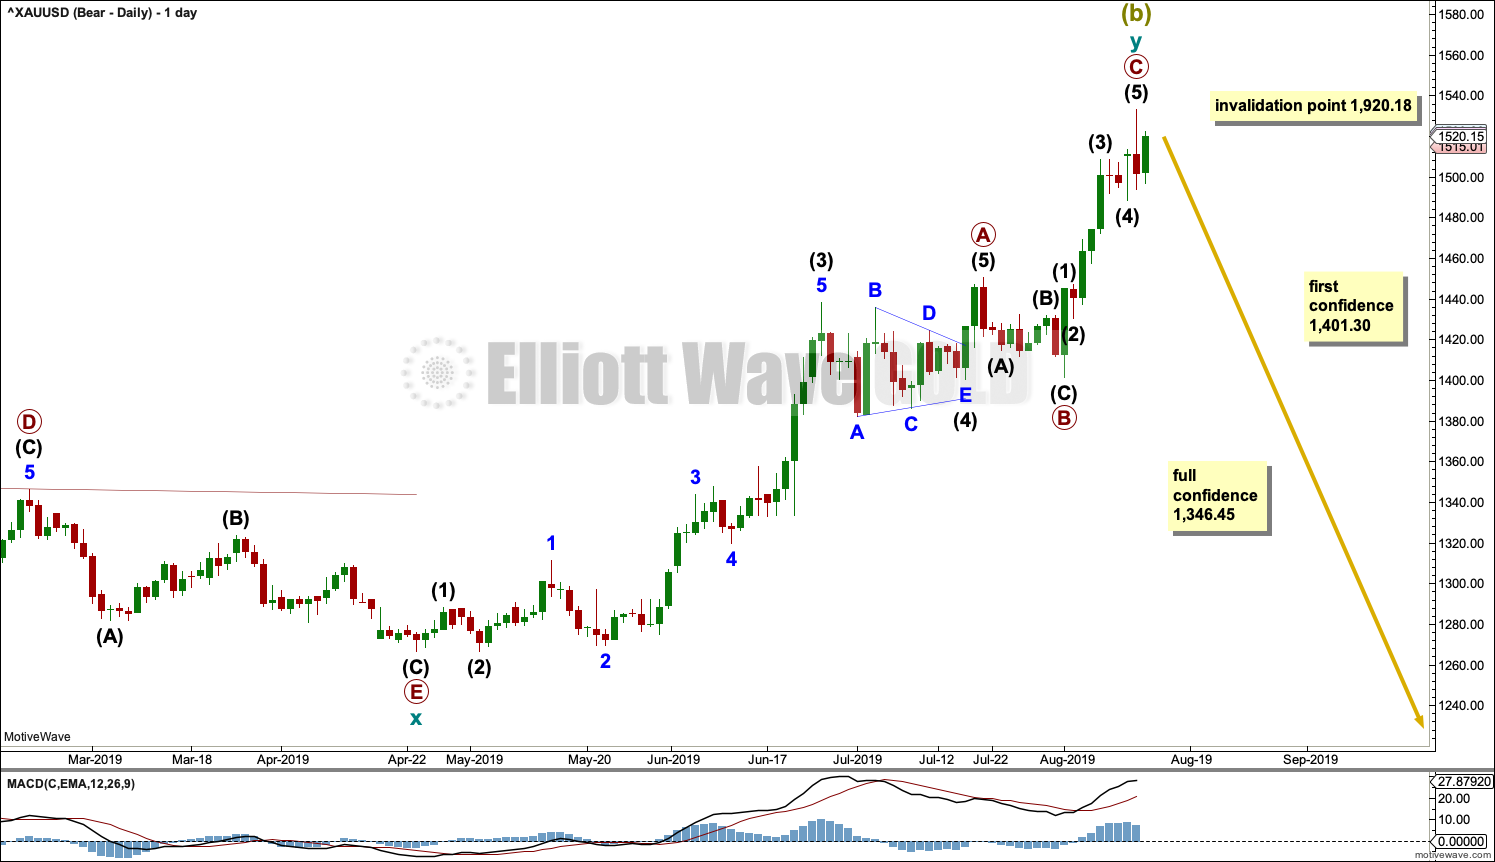
Primary wave C may now be a complete five wave structure.
If there has been a trend change, then downwards movement should unfold as a five wave structure from the high. Downwards movement should exhibit strength in either rising ATR or volume.
While price remains above the first confidence point at 1,401.30, it is also possible that primary wave C may be incomplete. Downwards movement may be a second wave correction, so the invalidation point is left at 1,920.18.
A new high above 1,533.34 by any amount at any time frame would indicate primary wave C could not be over and would be continuing higher. At that stage, the next target would be for primary wave C to reach equality in length with primary wave A at 1,585.
HOURLY CHART
Click chart to enlarge.
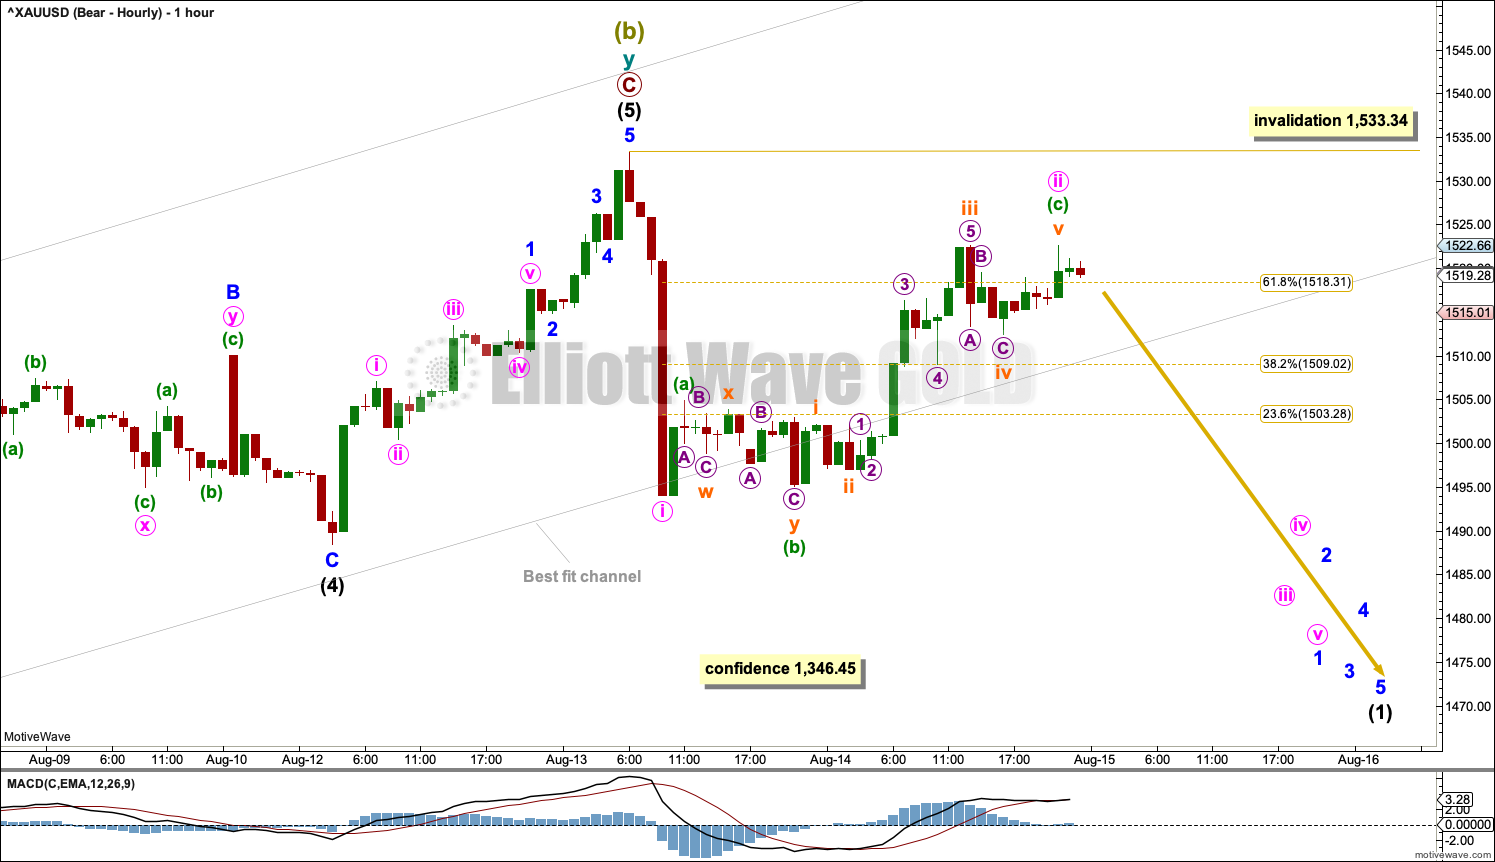
Intermediate wave (5) may now be a complete five wave structure. Downwards movement from the high is swift and strong, typical of the start of a first wave.
Minute wave ii may be a complete zigzag. If it continues higher, then minute wave ii may not move beyond the start of minute wave i above 1,533.34.
If price does make a new high by any amount at any time frame above 1,533.34, then intermediate wave (5) would be expected to continue higher. The target would then be at 1,585 for this wave count.
BULLISH ELLIOTT WAVE COUNT
WEEKLY CHART
Click chart to enlarge.
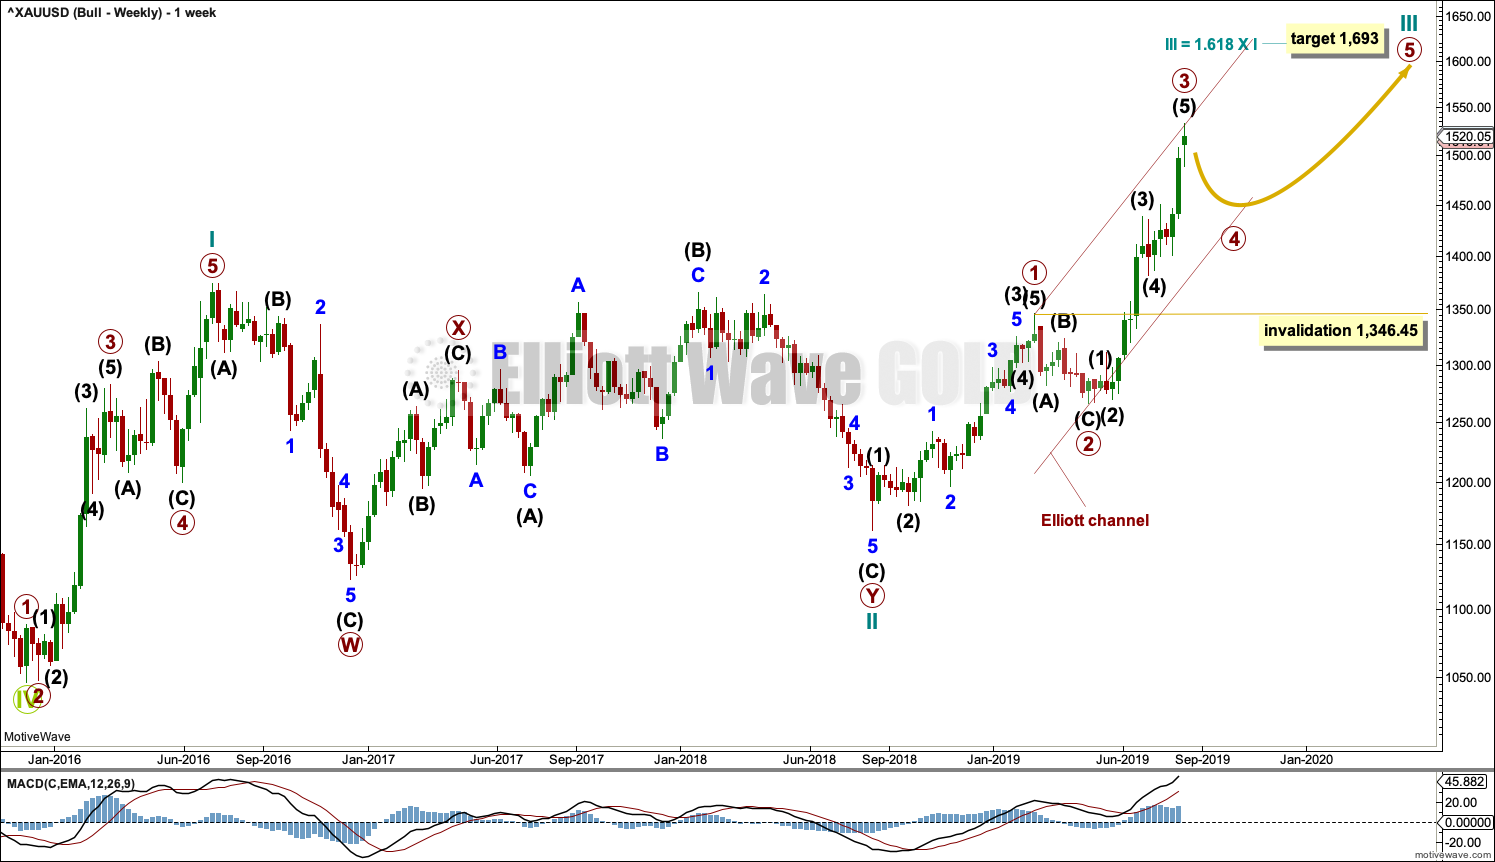
This wave count sees the the bear market complete at the last major low for Gold in November 2015.
If Gold is in a new bull market, then it should begin with a five wave structure upwards on the weekly chart. However, the biggest problem with this wave count is the structure labelled cycle wave I because this wave count must see it as a five wave structure, but it looks more like a three wave structure.
Commodities often exhibit swift strong fifth waves that force the fourth wave corrections coming just prior and just after to be more brief and shallow than their counterpart second waves. It is unusual for a commodity to exhibit a quick second wave and a more time consuming fourth wave, and this is how cycle wave I is labelled. This wave count still suffers from this very substantial problem, and for this reason the bearish wave count is still considered because it has a better fit in terms of Elliott wave structure.
Cycle wave II subdivides well as a double combination: zigzag – X – expanded flat.
Cycle wave III may have begun. Within cycle wave III, primary waves 1 and 2 may now be complete. Primary wave 3 has now moved above the end of primary wave 1 meeting a core Elliott wave rule. It has now moved far enough to allow room for primary wave 4 to unfold and remain above primary wave 1 price territory. Primary wave 4 may not move into primary wave 1 price territory below 1,346.45.
Cycle wave III so far for this wave count would have been underway now for 52 weeks. It is beginning to exhibit some support from volume and increasing ATR. This wave count now has some support from classic technical analysis.
The channel drawn about cycle wave III is an Elliott channel. Primary wave 4 may find support about the lower edge.
DAILY CHART
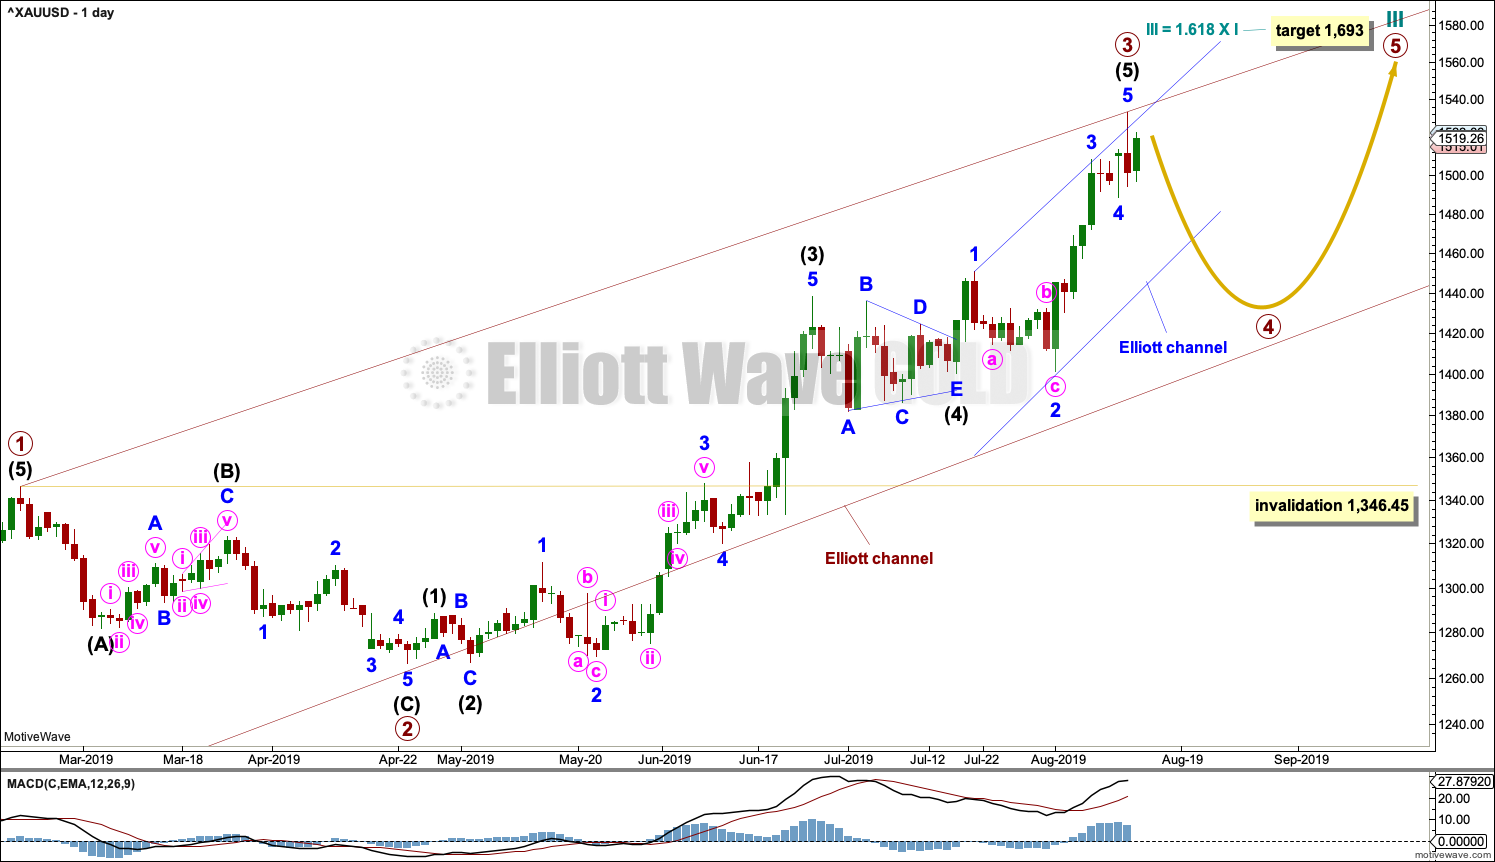
Click chart to enlarge.
Primary wave 3 may now be a complete impulse. The structure of intermediate wave (5) is now complete.
Primary wave 4 may not move into primary wave 1 price territory below 1,346.45.
Primary wave 4 may last about four to ten weeks. It may unfold as any one of more than 23 possible Elliott wave corrective structures. Primary wave 4 may end within the price territory of the fourth wave of one lesser degree; intermediate wave (4) has its range from 1,438.43 to 1,382.10.
HOURLY CHART
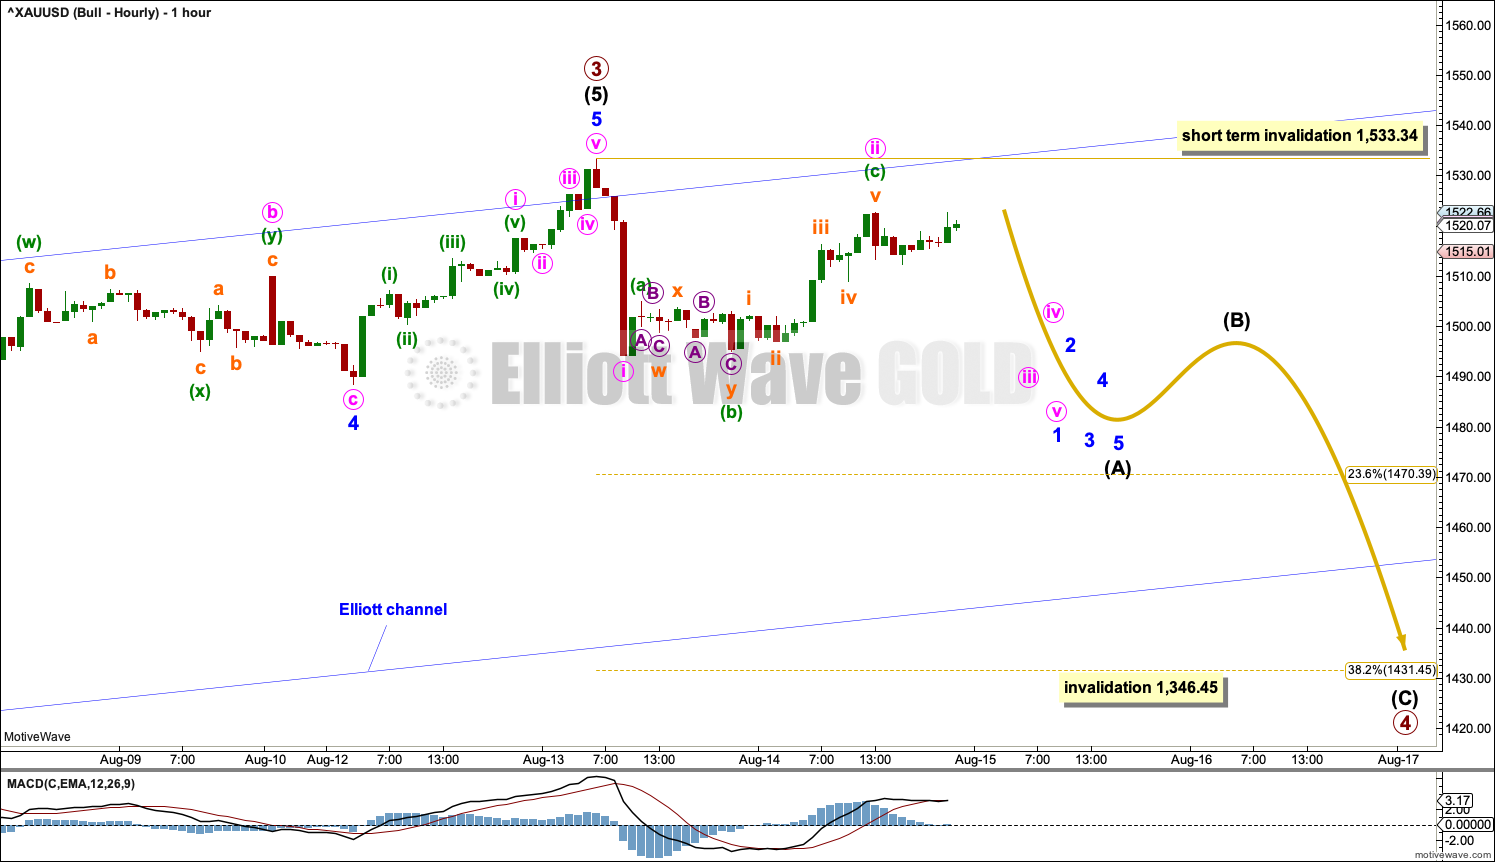
Click chart to enlarge.
Within the price territory of intermediate wave (4), from 1,438.43 to 1,382.10, lies the 0.382 Fibonacci Ratio of primary wave 3 at 1,431.45. This is the preferred target for primary wave 4.
A new trend at primary degree should begin with a five down on the hourly chart. Within this first five down, minute wave ii may not move beyond the start of minute wave i above 1,533.34.
If primary wave 4 unfolds as any one of an expanded flat, running triangle or combination, then it may include a new high above 1,533.34 within wave B or X of the corrective structure. In coming weeks the invalidation point at 1,533.34 may no longer apply (this is a short-term invalidation point only).
If price makes a new high by any amount at any time frame above 1,533.34, then the alternate hourly chart below may be used.
ALTERNATE HOURLY CHART
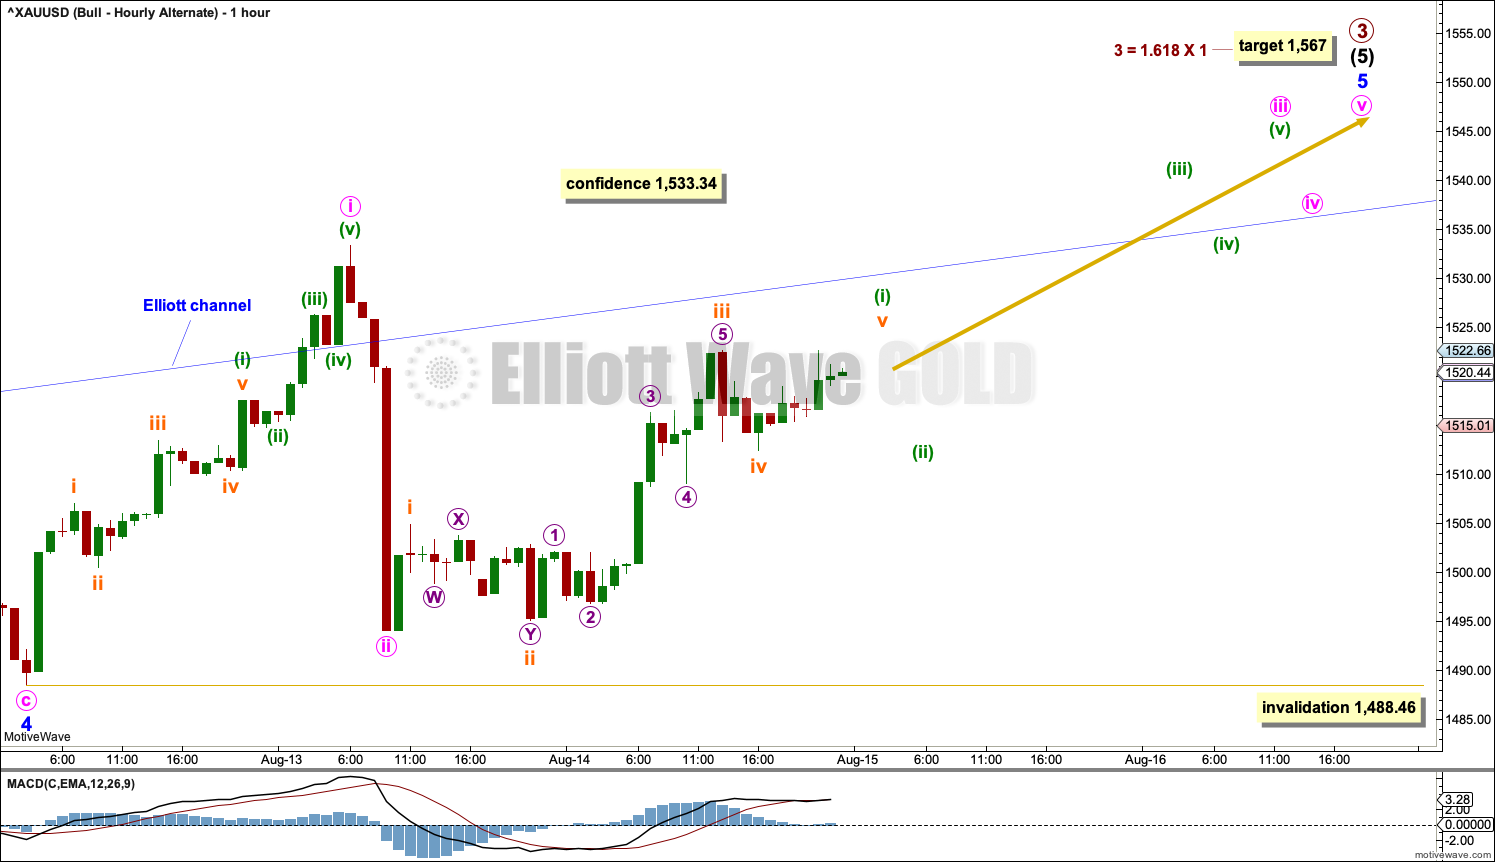
Click chart to enlarge.
The degree of labelling within intermediate wave (5) is moved down one degree. Intermediate wave (5) may be an incomplete impulse. Within the impulse, minute waves i and ii may be complete.
If minute wave ii continues lower as a double zigzag, then it may not move beyond the start of minute wave i below 1,488.46.
Invalidation of this alternate wave count with a new low below 1,488.46 by any amount at any time frame would add confidence to the two main hourly wave counts in the short term.
TECHNICAL ANALYSIS
MONTHLY CHART
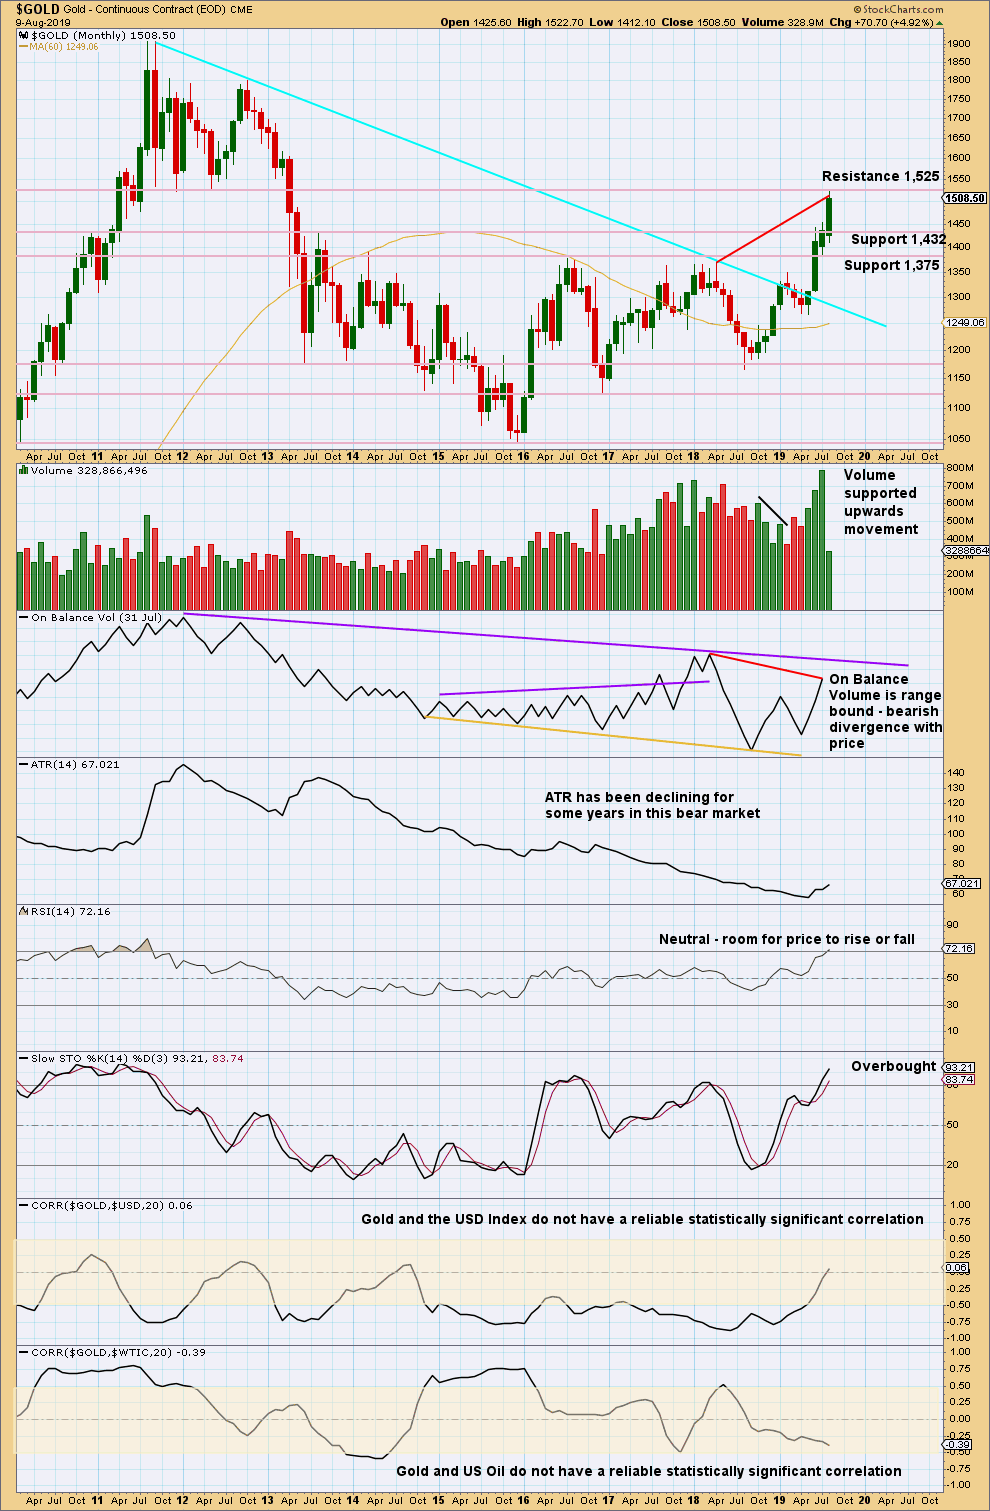
Click chart to enlarge. Chart courtesy of StockCharts.com.
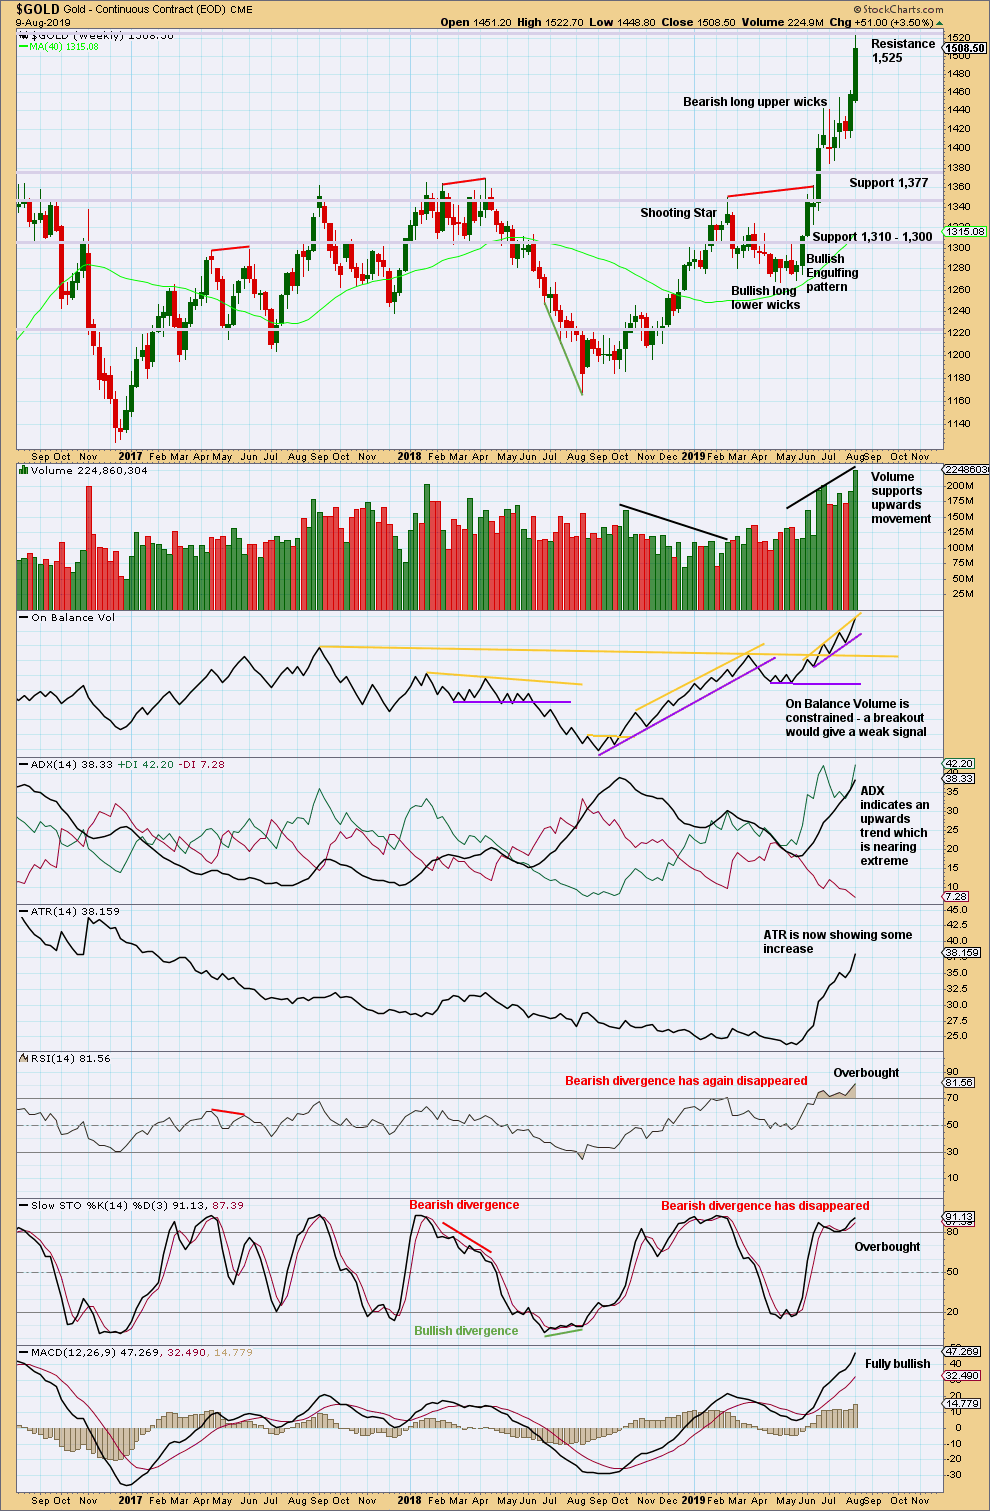
Gold has effected an upwards breakout above multi-year resistance and above the cyan bear market trend line. Price is now at strong resistance about 1,525.
The new high in price above prior highs for March / April 2018 have not been matched by new highs for On Balance Volume. This divergence is bearish and supports a bearish Elliott wave count. This divergence may be given a little weight because it is strong and evident on the monthly chart.
WEEKLY CHART
Click chart to enlarge. Chart courtesy of StockCharts.com.
When trends for Gold reach extreme, they can continue still for a few weeks and price can continue for a considerable distance.
When both ADX and RSI reach extreme together, then that is sometimes where a trend ends.
RSI at overbought on the weekly chart is a warning to be cautious; the trend is overbought, but at this stage there is no evidence of a trend change.
DAILY CHART
Click chart to enlarge. Chart courtesy of StockCharts.com.
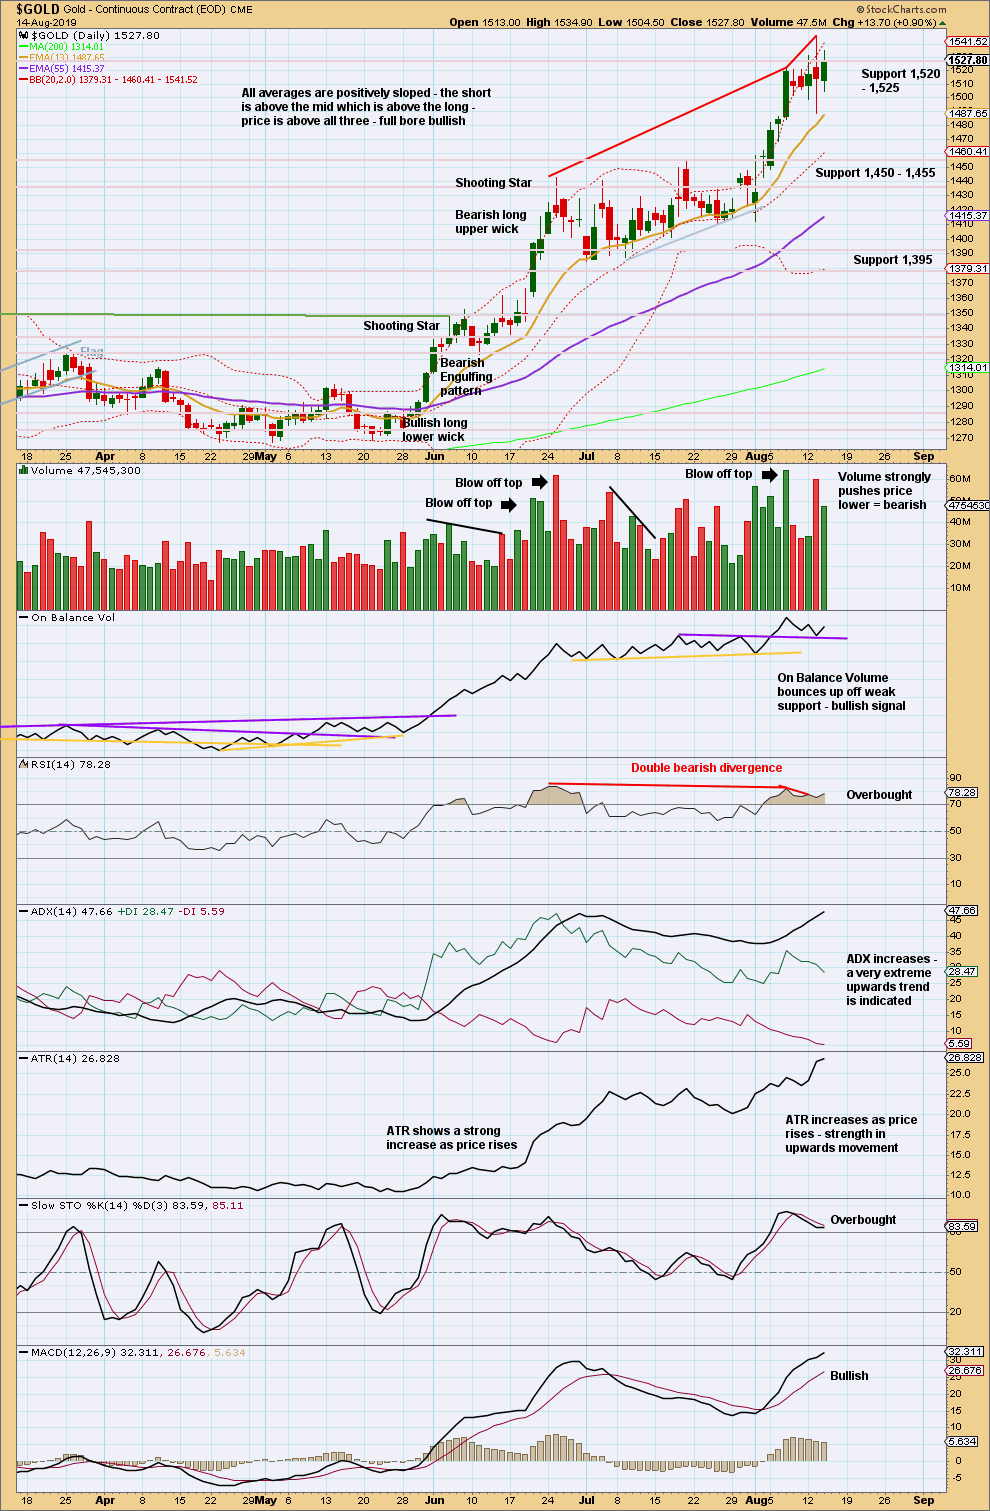
An upwards trend may continue, but it is now very extreme with RSI in overbought territory and now exhibiting double bearish divergence. While it remains possible that the upwards trend may yet continue for a further few weeks and conditions may remain extreme for a while longer, it is also possible that it may end at any time. Caution is still advised.
While price remains above the last swing low at 1,412.10, there is a series of higher highs and higher lows in place. A new low below 1,412.10 would be a lower low and would confirm a trend change.
Today price has closed above prior strong resistance at 1,520 to 1,525, but it has not done so with support from volume. This potential upwards breakout is suspicious. For confidence an upwards breakout, support from volume is required.
GDX WEEKLY CHART
Click chart to enlarge. Chart courtesy of StockCharts.com.
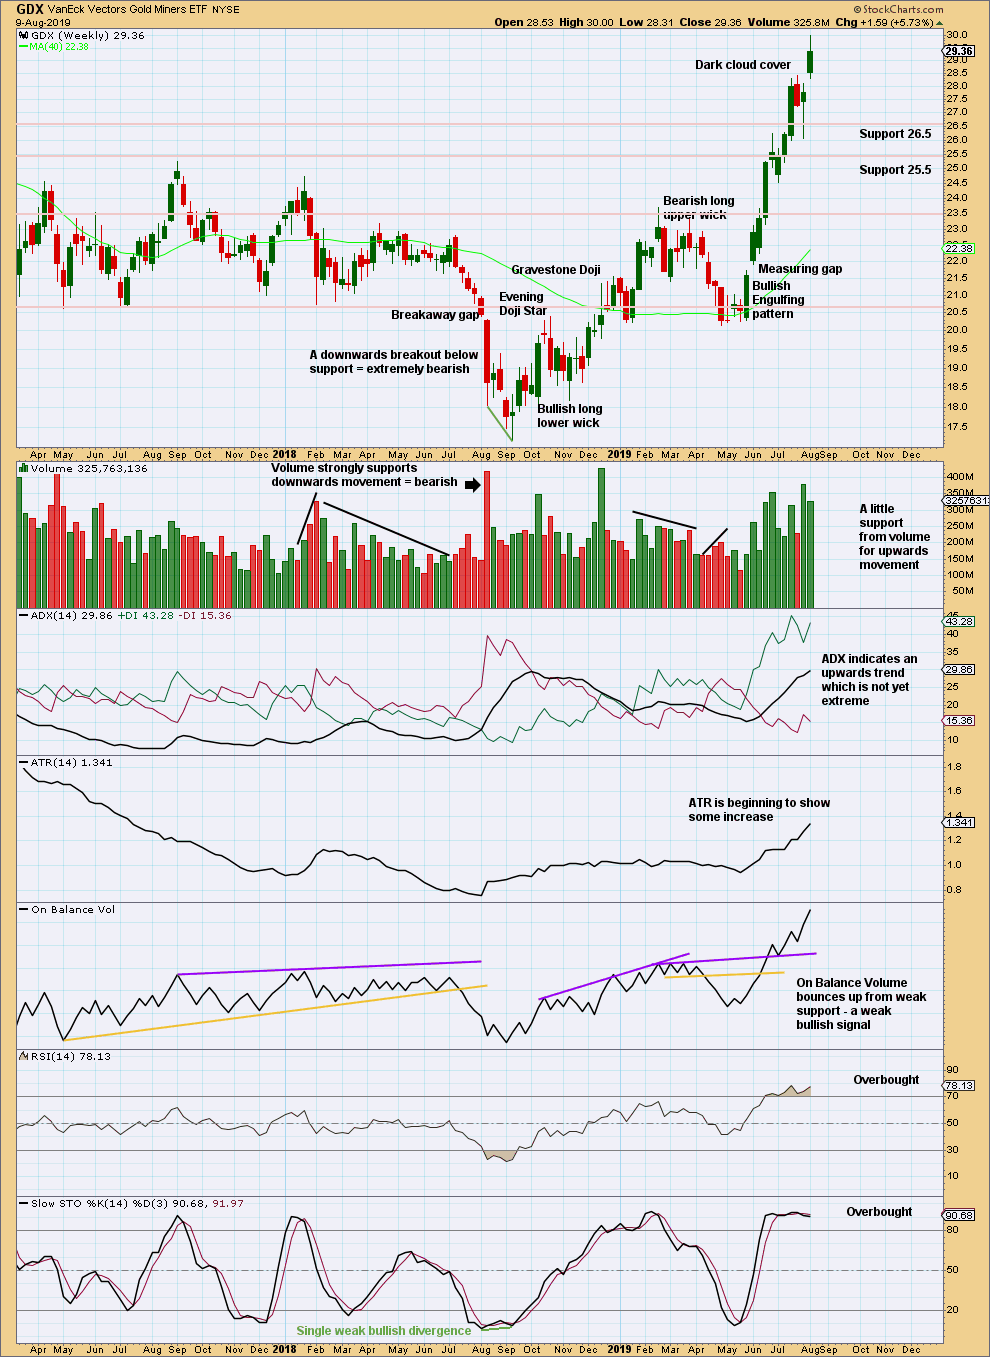
The Dark Cloud Cover reversal pattern was followed by downwards movement in the following week.
Now a new high indicates the last pullback should be over.
Volume last week has slightly declined, but overall volume is rising with price.
The trend has further to go before it reaches extreme at the weekly chart time frame.
GDX DAILY CHART
Click chart to enlarge. Chart courtesy of StockCharts.com.
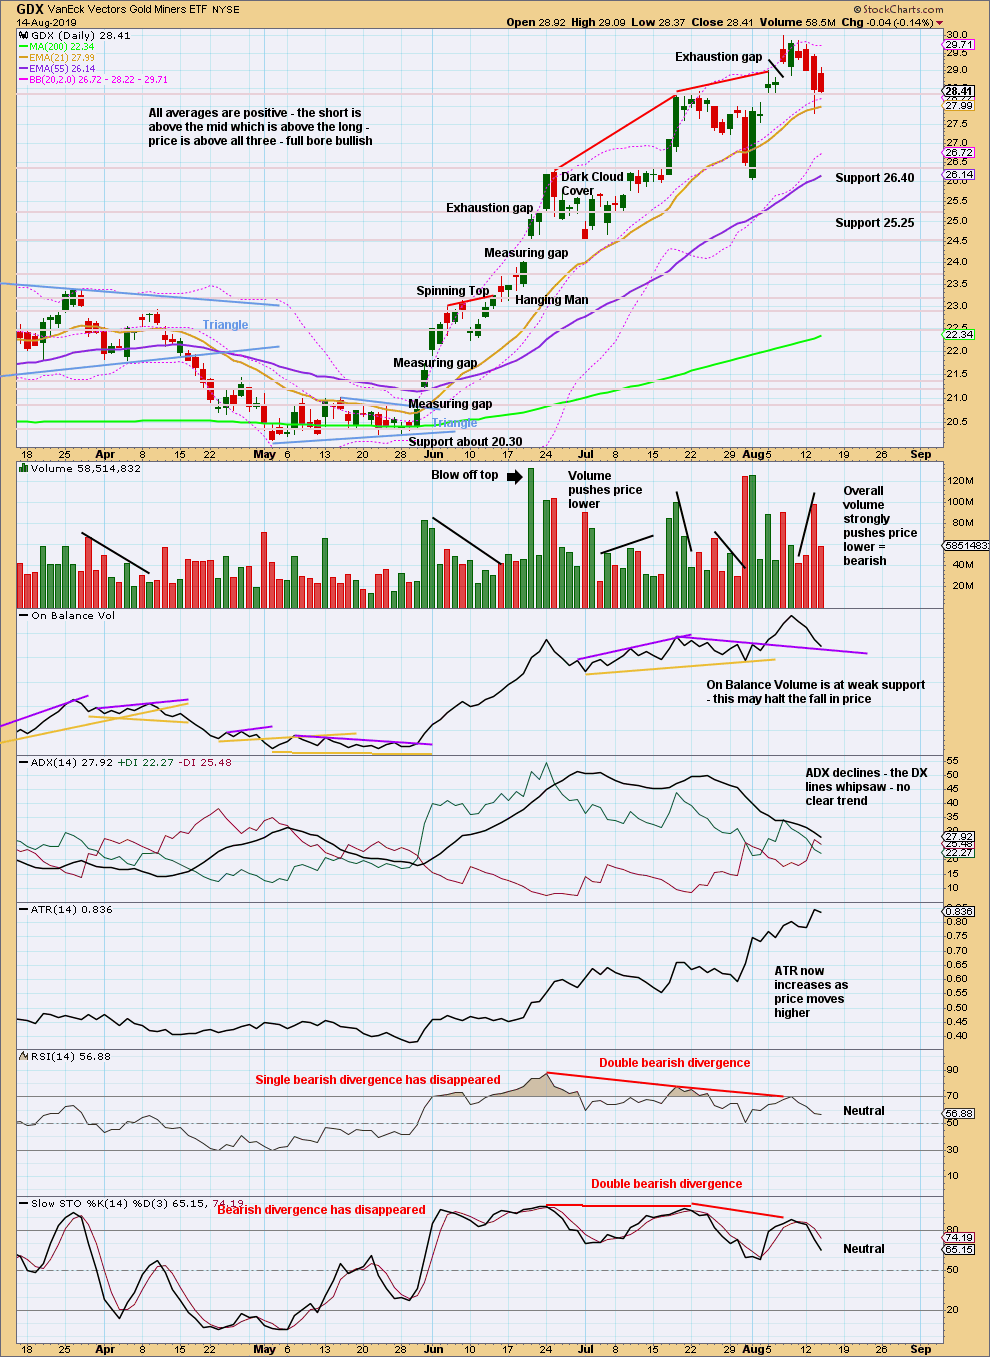
A consolidation may have begun. Look for support about 28.4.
The last swing low was at 26.04. A new low below this point would confirm a trend change.
Published @ 11:41 p.m. EST.
—
Careful risk management protects your trading account(s).
Follow my two Golden Rules:
1. Always trade with stops.
2. Risk only 1-5% of equity on any one trade.
—
New updates to this analysis are in bold.
Hourly bullish chart updated;
I do apologise for the late hour of publication of todays analysis. It all took me so much longer than usual today, it’s all getting more complicated lately. Lots of alternates to consider for both markets.
Looking at cryptocurrencies, I’m watching BTC, XRP, XMR, DASH and ETH daily at this time. All are in pullbacks which I’m waiting to see move lower before I buy some more. So far the investment I’ve made is very small, I’m holding most back until further lows see better buying opportunities.
How many members here are following my analysis of cryptocurrencies? Is anyone here waiting to buy? Has anyone purchased some already?
Hi Lara
I’ve just bought some Neo – it’s at the point I’m happy to sit and hold what I have at this time.
Hi Lara,
I just invest BTC and LTC with period buying method.
I’m guessing all these cryptos will end up at zero at some point. That being said I would like to buy a small portion on the next pullback….more of a trade and you never know…tulips….bitcoin….stock market…anything is possible…but silver is the main train I want to be aboard if the markets head south
I expect most or all of them may end up at zero at some point too.
I looked at charts of over 50 cryptocurrencies. I found many had peaked and crashed, and were showing zero signs of strength in any upwards moves off their lows. Those may well end up disappearing.
But I also found the five I’m looking at have peaked, crashed (over 80% fall in price from the all time highs) and are now showing signs of strength off their lows.
In the case of Bitcoin (the biggest and original) it has peaked and crashed three times now. I think it’s getting ready for another peak. At least, that’s what the data strongly suggests.
Thanks for sharing the info Lara.
I’m not a big fan of crypto long term, simply because its a “technology.”
And like most technologies, there will be a newer technology to either decode/debunk it, steal it, or replace it entirely (long term, of course).
But short term, yes. It can be played with like a commodity.
I really don’t care about the future or lack thereof of crypto as a currency or technology.
I’m just investing in it because it’s where bubbles are forming. And bubbles can be incredibly profitable if you can identify them and ride them up and then get out near a high.
Parabolic bubbles are tough to buy puts on. I did the last one and made a nominal amount even though I was right. The put price was very high. I’d rather go short though than long but obviously you can make money on both sides.
The central banks will make them zero unless central banks issue their owned digital coins….
I don’t know that central banks have that power. If they figure out how to make that happen, then it could be after the next bubble has burst.
They’d need to have a very good co-operation on a global scale. Maybe I’m naive, but I’m not sure all the different countries that would need to be in co-operation could do it to eliminate all cryptocurrencies.
what do you think about lack of volume? and xrp made a lower low..
BNB chart looks better to me 🙂 plus it has future as long as crypto lives
It looks okay. It didn’t manage so far to produce as big a bubble as some others. But it does have a very nice Morning Doji star off its low on the 15th of July. It did lack volume off the low in the third candlestick of the pattern though.
However, it has since been showing some signs of strength in upwards days with strong volume.
Leaving technical analysis aside for a second, Bnb coin is representing the only business in the crypto world who is printing millions every day, if I’m wrong pls correct me
A lack of volume when price moves lower is of no concern. Price can fall hard and fast due to a lack of buyers, just as it can due to sellers actively pushing price lower.
My concern for volume is for BTC recent move up from the lows made in december .